
The Non-point Source Pollution Effects of Pesticides Based on the Survey of 340 Farmers in Chongqing City
2015-02-06 03:07LianchaoYULimengGUQianBI
Asian Agricultural Research 2015年7期
Lianchao YU,Limeng GU,Qian BI
College of Economics and Management,Southwest University,Chongqing 400715,China
1 Introduction
Modern agricultural production is inseparable from the use of pesticideswhich havemade great contribution to Chinese social and economic development.But at the same time,pesticides are also the toxic chemicals imposed by human on the environment.In a country producing and consuming a lot of pesticides,the pesticide pollution is inevitable,and it is necessary for people to take appropriatemeasures to combat pesticide pollution and minimize the losseswhile affirming the positive role of pesticides.China is one of the countries first discovering and using pesticides and the pesticide consumption is highest in theworld,but themanagementof pesticides started late.In 1997,China promulgated Pesticide Management Regulations,indicating that China entered the era of managing pesticides in accordancewith laws.In the long-term use of pesticides,it has caused tremendous pollution and damage to the environment.At the same time,the pesticide pollution causes a serious impact on human body.First,during the production,transportation,storage and use of pesticides,humans are directly poisoned;second,through the food chain,humans are indirectly poisoned.With the global economic integration and development needs of agricultural products in the new phase,Chongqing City has been one of China's important agricultural commodity production bases and pollution-free agricultural products and green food havemake greatstrides in Chongqing.However,due to the humid climate and short frost-free period,vegetable can be cultivated all year round and vegetable pests occur frequently,so the pesticide residues on vegetables caused by unreasonable application of pesticides can not be ignored.For these reasons,with the survey data on 340 farmers in Chongqing City,we try to study the non-point source pollution effects of pesticides and put forth the relevant recommendations in order to provide a reference for understanding the current situation of pesticide pollution in China.
2 Data sources and statistical analysis
2.1 Data sourcesChongqing has a long history of agricultural development,and there isawide use of pesticides.The non-point source pollution of pesticides appeared early and it is typical,so Chongqing City is selected as the study area.In this paper,using the cross-sectional data,we carry out a questionnaire and interview survey of 340 farmers in Chongqing City.
2.2 Statistical analysisThis survey covers type of pesticide,whether to consider their own consumption during pesticide application,agricultural material sales points,agricultural material prices evaluation and cognition of pesticide application.
2.2.1Type of pesticide.During the survey,it is found that the proportion of using a large amount of green pesticides is 28.24%and the proportion of using a small amount of green pesticides is 45.29%.It is worth noting that the farmers who use a small amount of highly toxic pesticides or use no highly toxic pesticides account for94.41%,and the farmerswho use green pesticidesaccount for 73.53%,but the proportion of considerable use of green pesticides is low,indicating that the green pesticides promotion has achieved some success,and farmers begin to try applying green pesticides,butmost farmers hold await-and-see attitude.

Table 1 Pesticide type selection
2.2.2Whether to consider farmers'own consumption during pesticide application,agricultural material sales points and price evaluation.When all agricultural products are for their own consumption,most farmers prefer to use more green pesticides and less chemical pesticides.The proportion reaches40.29%,indicating thatmore andmore farmers realize the hazards of pesticide application to food safety.In Chongqing,there is at least one agriculturalmaterial sales point inmore than half of the villages.For the evaluation results of agricultural material prices,only one tenth of the farmers think it inexpensive and are fully able towithstand agriculturalmaterial prices and more than 40%of farmers think the agriculturalmaterial in recent years is high.Thismay be related to the fact that there is only one sales point in the village for the majority of farmers,lacking effective market competition mechanisms of agriculturalmaterials.

Table 2 Whether to consider their own consumption during pesticide application,agriculturalmaterial sales points and price evaluation
2.2.3Cognition of pesticide application.Survey results show thatalthough the pesticideapplicationwill contaminateagricultural production environment and affect the quality of agricultural products,the vastmajority of farmers do not think that the pesticide has been applied in excess,and 38.82%of farmers believe that the pesticide has been excessively applied.Meanwhile,the vast majority of farmershave amore objective understanding ofapplication effect of pesticides,and 72.94%of farmers believe that the application of pesticides is not necessarily conducive to crop growth.It should be noted that 7.06%of farmers do not know whether the pesticide application can promote the growth of crops in Chongqing City,which shows that the knowledge of agricultural production needs to be further popularized.
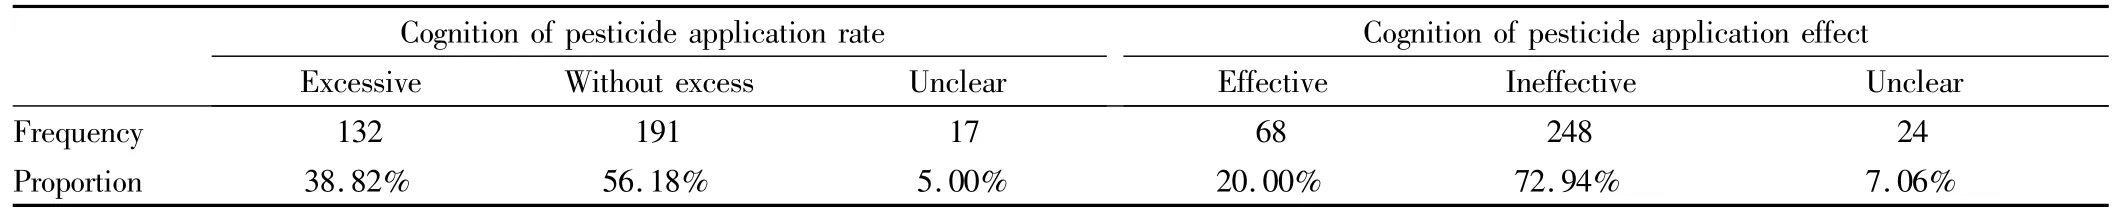
Table 3 Farmers'cognition of pesticide app lication rate and effect
In terms of farmers'cognition of pesticide hazards,the vast majority of farmers believe that the application of pesticides will bring pesticide pollution,and affect agricultural production and food quality.More than 91%of the farmers think pesticides will have an impact on soil,air and water quality,and about 95%of farmers believe thatpesticides can affect the quality of agricultural products.
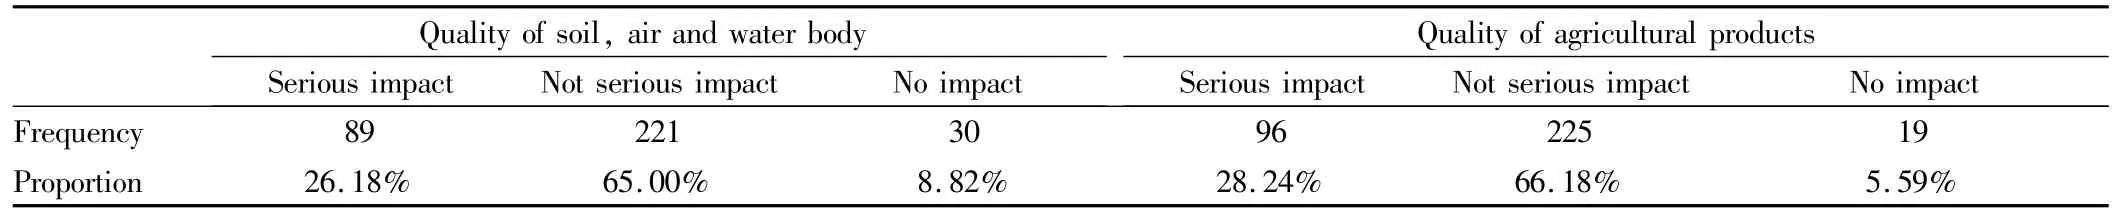
Table 4 Farmers'cognition of pesticide hazards
3 Model estimates and analysis of the results
3.1 M odelingApplication of pesticides by farmers is affected by multitudinous factors such as basic characteristics of rural householders,family and production characteristics,commodity trading characteristics,scientific pesticide applying ability characteristics,farmers'cognition of pesticide residues,and local pesticide purchase place and price.Therefore,themodel of factors in-fluencing farmers'pesticide application rate is built as follows:
where the dependent variable SP is farmers'pesticide application rate;BC representsbasic characteristics of rural householders;FC represents farmers'family and production characteristics;Trade represents commodity trading characteristics;SC represents farmers'scientific pesticide applying ability characteristics;RE is farmers'cognition of pesticide residues;PP is local pesticide purchase place and price;εis random disturbance term.
3.2 Variable selection(i)Basic characteristics of rural householders(BC),including the age and educational level of householders.On the one hand,younger farmers may be more concerned about crop yields under the stress of livelihood,thereby increasing the amountof pesticide application.On the other hand,older farmers are generally more dependent on experience in the agricultural production activities,and reluctant to accept new ideas about pesticide application;they are often relatively weak and thus increase the application rate.It is generally believed that the higher the educational level of farmers,the stronger the ability to accept new ideas and new technologies,the stronger the willingness to scientifically apply pesticide,and themore likely they are to apply the right amount of pesticides.(ii)Farmers'family and production characteristics(FC),including annual family income,gender ofmain labor,and the proportion of population engaged in agricultural production and total household population.Annual family income hasan uncertain impacton the pesticide application rate.The familywith female labor as themain labormay usemore pesticides to compensate for constraintsof physicalwork capacity.In addition,the familywith a large proportion ofagricultural populationmay choose to use the pesticides which can increase crop yields.(iii)Commodity trading characteristics(Trade).The crops with low commodity rate are mostly consumed by farmers themselves and they may apply less pesticides.However,the farmerswith high commodity rate are engaged in large-scale agricultural production,and they often have stronger awareness of costs and benefits and ability to accept advanced technologies,leading to reduction in the amountof pesticide application.Therefore,the commodity rate of crops has an uncertain impact on pesticide application rate.(iv)Farmers'scientific pesticide applying ability characteristics(SC),including whether the farmers can understand the instruction for use,and whether the farmers attend the agricultural technology training.It is assumed that the participation in agricultural technology training will have a negative effect on the pesticide application rate.(v)Farmers'awareness of pesticide residues(RE),including farmers'awareness of whether the excessive use of pesticides will affect the quality of soil,air and water and the quality of agricultural products,and whether pesticides can promote crop production.(vi)Pesticide purchase place and price(PP),including the number of agriculturalmaterial sales points in farmer's village and farmers'ability to bear the pesticide price.If there aremany agriculturalmaterial sales points in farmer's village,it is likely to increase the likelihood of farmers'purchase of pesticides.When farmers believe that the current price of pesticides is not high,they are more likely to purchase and use pesticides.
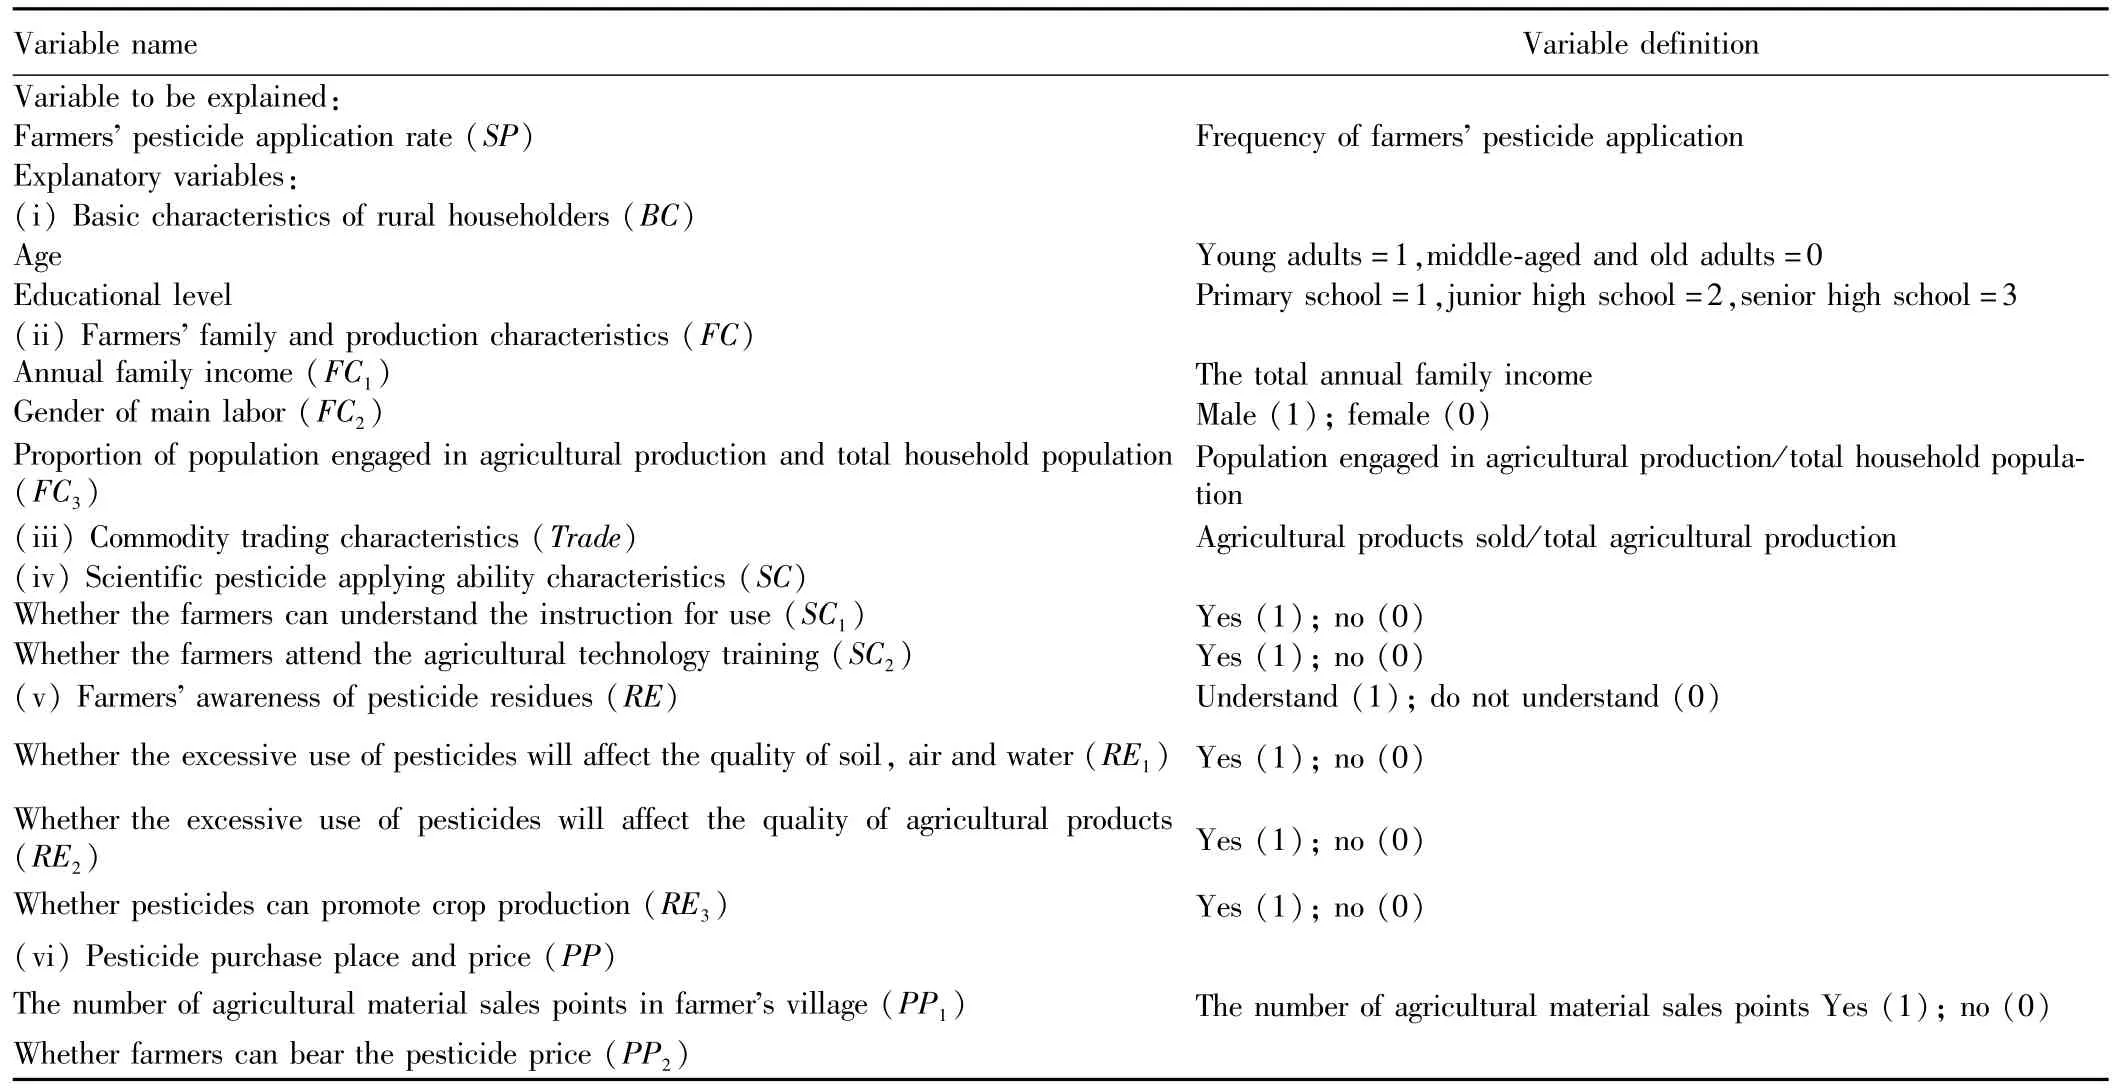
Table 5 Themain study variables and their definition
3.3 Regression results and analysisFrom Table 6,the re-gression results show that age and educational level of rural house-holders,whether the farmers attend the agricultural technology training(SC2)and whether pesticides can promote crop production(RE3)pass the significance test,while other variables do not pass the significance test,possibly due to small sample size and inaccurate regression results,but we can roughly judge the positive and negative effects of these factors on pesticide application rate from the sign of regression coefficient.In the variables passing the significance test,the familywith older householderwillapplymore pesticides,because their physical labor is limited and they are more likely to apply more pesticides to make up for the lack of the ability towork;the householderswith high educational levelwill choose to use less pesticides,which may be related to the social concept of the region.The pesticide application rate is negatively correlated with whether the farmers attend the agricultural technology training(SC2),indicating that the farmers who have participated in agricultural technology training will have stronger scientific pesticide application ability.In addition,the coefficient of RE3is significant,and farmers will usemore pesticides in order to seek higher crop yieldsandmore agricultural production profits if pesticide application can promote crop production.
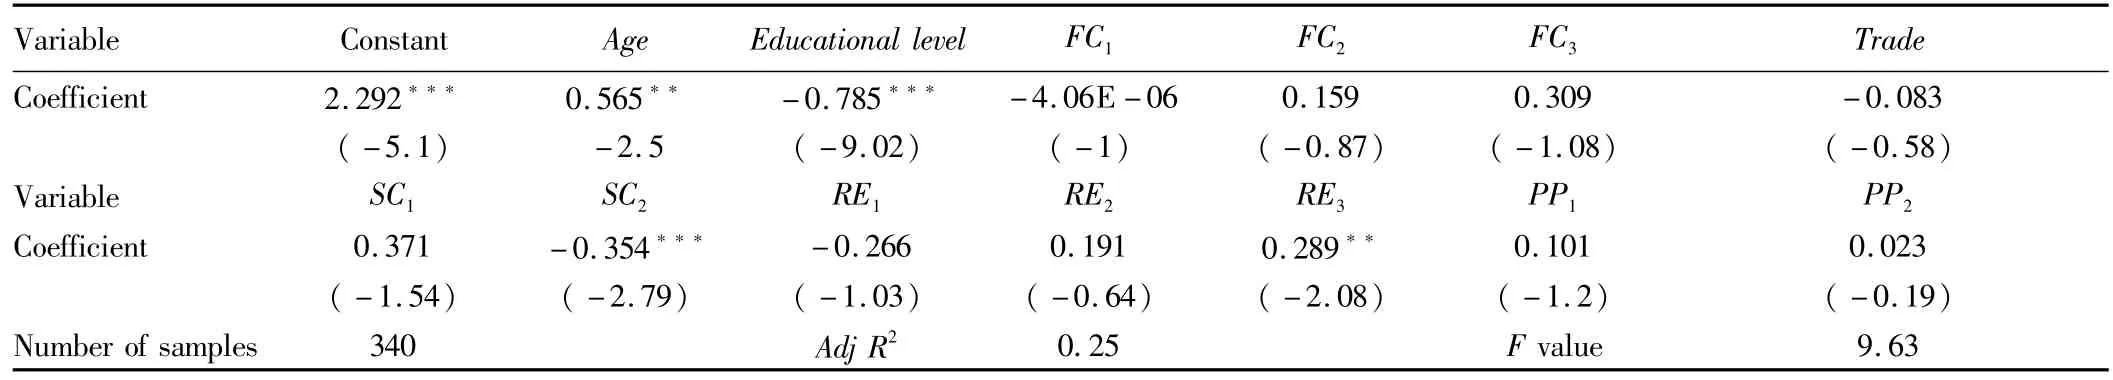
Table 6 Regression results
4 Conclusions and recommendations
4.1 ConclusionsUsing the survey data on 340 farmers in Chongqing City,this paper performs an empirical analysis of the factors influencing the non-point source pollution of pesticides.The results show that the older householderswillapplymore pesticides,whichmay be due to the weak physical strength and weak ability to accept the concept of advanced cultivation;the householderswith high level of education will choose to use less pesticides;the pesticide application rate is negatively correlated with whether farmers have participated in agricultural technology training,that is,the farmers having participated in agricultural technology training have stronger ability to scientifically apply pesticides,and in-depth understanding of advanced agricultural production technology and positive and negative effects of pesticides,so they often choose to reduce the application rate of pesticide;the cognitive factor on the role of pesticides in better promoting the growth of crops is significant,which requires the government and relevantdepartments to carry out concrete publicity ofeffectiveness and negative impact of different pesticides during the popularization of agricultural science knowledge,to prompt farmers to have a systematic and in-depth understanding of the agricultural non-point source pollution caused by pesticides.
4.2 Recommendations(i)In terms of technicalmeasures,we can enhance the pests and diseases forecasting and resistance monitoring,adjust the pesticide structure,research and develop low toxicity and efficient pesticide s and biological pesticides,and promote new biological control technologies and products.(ii)From themanagementmeasures for pesticide pollution prevention,we can strengthen the supervision and management of pesticides,strengthen technical advice for farmers'pesticide use,enhance publicity to raise people's environmental awareness and self-protection awareness,strengthen environmentalmanagement of pesticides,systematically carry out the environmentalmanagement and environmental monitoring after pesticide use,establish and improve pesticide environmentalmanagement system,and strengthen environmentalmanagement of pesticides.(iii)From themeasures for development of biological pesticides,we can implement demonstration projects to promote the use ofbio-pesticidesand conduct biological control to promote sustainable development of agriculture.
[1]TANG XY,ZHANG HP,LISP.On economic value of prevention and control of agricultural non-point source pollution[J].Chinese Rural Economy,2012(3):53-67.(in Chinese).
[2]YANG LZ,FENG YF,SHIWM,etal.Review of the advances and development trends in agricultural non-point source pollution control in China[J].Chinese Journal of Eco-Agriculture,2013,21(1):96-101.(in Chinese).
[3]YANG LZ,SHIWM,XUE LH,etal.Reduce-retain-reuse-restore technology for the controlling the agricultural non-point source pollution in countryside in China:General countermeasures and technologies[J].Journal of Agro-Environment Science,2013(1):1-8.(in Chinese).
[4]XIAO XC,HE BH,NI JP,et al.Safety assessment of water resources in Chongqing Section of the Three Gorges Reservoir Area based on DPSIRmodel from the perspective of agricultural non-point pollution source[J].Acta Scientiae Circumstantiae,2013,33(8):2324-2331.(in Chinese).
[5]PAN Y,LIU YH,WANG J,etal.Non-pointpollution control for landscape conservation analysis based on CLUE-S simulations in Miyun County[J].Acta Ecologica Sinica,2011,31(2):529-537.(in Chinese).
[6]GE JH,ZHOU SD.Analysis on economic influencing factors of agricultural non-pointsource pollution——Based on the dataof Jiangsu Province during 1978-2009[J].Chinese Rural Economy,2011(5):72-81.(in Chinese).
[7]RAO J,XU XY,JIXT.Study on the current situation,occurrencemechanism and countermeasuresof agricultural non-pointsource pollution in China[J].Problems of Agricultural Economy,2011(8):81-87.(in Chinese).
[8]LITP,ZHANG F,HU H.Authentication of the kuznets curve in agriculture non-point source pollution and its drivers analysis[J].China Polulation.Resources and Environment,2011,21(11):118-123.(in Chinese).
[9]Dale SR.Environmental kuznets curves real progress or passing buck---A case for consumption-based approaches[J].Ecological Economics,1998(25):177-194.
[10]Dinda S.Environmental kuznets curve hypothesis:A survey[J].Ecological Economics,2004(48):431-455.
[11]Grossman GM,Krueger AB.Environmental impacts of a north American free trade agreement[N].National Bureau of Economic Research Working Paper,New York:NBER,1991:3914.
[12]Grossman GM,Krueger AB.Economic growth and the environment[J].Quarterly Journal of Economics,1995(110):353-377.
[13]Panayotou T.Empirical testsand policy analysis of environmental degradation at different stages of economic development,technology and employment program[Z].Geneva:International Labor Office,1993.
[14]Roca J,Padilla E,Farre M etal.Economic growth and atmospheric pollution in Spain:Discussing the environmental kuznets curve hypothesis[J].Ecological Economics,2001(39):85-99.
[15]Shafik N,Bandyopadhyay S.Economic growth and environmental quality:Time-series and cross-country evidences[R].Background Paper for World Development Report,Washington DC:World Bank,1992.
[16]Duchemin M,Hogue R.Reduction in agricultural non-point source pollution in the first year following establishment of an integrated grass/tree filter strip system in southern Quebec(Canada)[J].Agriculture,Ecosystems&Environment,2009,131(1/2):85-97.
 Asian Agricultural Research2015年7期
- Asian Agricultural Research的其它文章
- Forecasting of the Egg Price Based on EEMD
- On Modern Fruit Production in Japan
- Study on the Improvement of Performance of Global Supply Chain Based on Quantity Flexibility Revenue Sharing Contract
- Supply Chain Optimized Strategies in the Mode of External Financing
- Financial Support for Rural Cooperative Economy in China Based on Grey Correlation Analysis
- A Study on the Driving Factors of Food Production in Huang-Huai-Hai Plain Based on Path Analysis