
Numerical simulation on the aerodynamic performance of ice coating airfoil of wind turbine blade
2015-11-03 07:02JizheHAIWenleiSUNYujunZHOU
机床与液压 2015年3期
Ji-zhe HAI, Wen-lei SUN, Yu-jun ZHOU
(School of Mechanical Engineering, Xinjiang University, Urumqi 830049, China)
Numerical simulation on the aerodynamic performance of ice coating airfoil of wind turbine blade
Ji-zhe HAI*, Wen-lei SUN, Yu-jun ZHOU
(School of Mechanical Engineering, Xinjiang University, Urumqi 830049, China)
Taking the S818 airfoil of 1.5 MW wind turbine blade as the research object. Model of the finite element of airfoil flow field was built in this paper. The non-viscous incompressible Navier-stokes equations are used as flow control equation, which conducted numerical simulation analysis on Ice-free airfoil, airfoil of rime ice, chord-length ice, and horn ice. The pressure distribution are obtained from the lift-drag ratio, velocity vector and surface pressure of different thickness of the blade airfoil in the angle of attack from -2° to 20°.The results showed that the thicker of the ice coating, the shaper maximum lift-drag ratio of airfoil are decreased. Moreover, certain thickness of chord length ice and horn ice leads to the mutation of the loss of lift-drag ratio. When ice thickness is 10 mm, the maximum lift-drag ratio amplitude reduction of horn ice reached the maximum at 22.04%, the chord length ice at 11.97% and rime ice at 6.14%. In addition, the airfoil after icing would enter stall area in advance which deteriorates aerodynamic performance of blade and reduces the power coefficient of wind turbine.
Wind turbine, Airfoil, Ice coating, Aerodynamic performance
1 Introduction
As the wind power is one of the important strategic substitute energy, the research on wind turbine goes deeper both at home and abroad. Onshore wind energy resources in Xinjiang possessing nine large fetch accounts for 37% of the national total, only second to Inner Mongolia. But the climate in Xinjiang is so harsh, nearly half a year’s time in the snow-covered winter and great difference of day-night temperature that the wind turbine would be iced when runs under low temperature condition below zero especially meeting supercooled drops. blade of wind turbine prones to icing which changes the external shape and aerodynamic performance of blade. Thus it has negatively influence on transformation efficiency, may damage blade in severe case and causes accident. To improve the utilization efficiency of wind energy, it’s of great necessity to conduct a research on the effects of aerodynamic performance of icing wind turbine blades.
A number of researches on icing wind turbine blades have been done internationally. For one thing, Montreuil [2] et al verified the variation about drops collection coefficient under various weather conditions through the calculation model adopted by theoretical analysis and experimental demonstration and they obtained good results. Forting [3] et al studied the effect of deice system especially by focusing on icing wind turbine and they described two theories about the formation of rime ice and glaze ice based on the experiments. For another, Zhang Dalin [4] etc. domestic scholars made a numerical simulation to calculate the air flow field of ice-forming surface impacted by supercooled droplets through applying Reynolds averagedN-Sequations andk-εtwo-equation turbulence model. Yi Xian [5] using Calculation model of Ice accretion process can predict the growth process of icing at the forefront of the wing.
S818 of NREL airfoil was selected as the research object in this work. We established the finite element analysis model of Ice-free airfoil, rime ice, chord length ice and horn ice airfoil’s flow field and analyzed the variation of airfoil lift, drag and surface pressure characteristics of different thicknesses and different ice-model comparatively. Finally the mechanism of icing airfoil aerodynamic performance was obtained which provided fundamental basis for further valid measure of deicing.
2 Icing airfoil and calculation model
Due to the various temperature, air humidity and fluid speed, icing structure on the blade airfoil was different.The matted rime ice with poor transparency formed on the surface of airfoil when temperature was lower, below -15 degrees Celsius, because the droplets froze immediately and the inclusion of air in droplets had no chance to discharge. However, when the temperature was a little higher the droplets couldn’t freeze immediately and a part of droplet moved to rear airfoil so that groove formed in leading edge of airfoil and horn ice in rear. Moreover, chord length ice formed under the SLD (supercooled liquid drops) condition. The condensing droplets can’t evaporate completely with a heat protection system at leading edge and the backflow of droplets develops into ice covering on the upper and lower surfaces. As a result of above formation mechanism, the shape of chord length ice varies in different place which made the edge shape of chord length ice more complex than the horn ice’s. Airfoil with three icing shape was selected as research object. It was described in Fig.1.
To begin with, the work chose Navier-Stokes equations of incompressible viscous based on Reynolds-averaged as flow-controlled equation, Spalart-Allmaras model which was suitable for airfoil flow as the turbulent model and SIMPLE pressure-velocity coupling equations as calculation methods [6]. Furthermore, the Convection Interpolation was second-order upwind scheme, Gradient Interpolation used least square method on a cell by cell basis and pressure interpolation was also second-order format. The sixth section of the S818 airfoil was selected as the research object. The chord length of Airfoil was 2.412 m, installation angle was 6.35°and the constant wind speed was 10 m/s. At this point, Reynolds number was 1.6×10⁶. Divided airfoil flow field grid is shown in Fig.2.
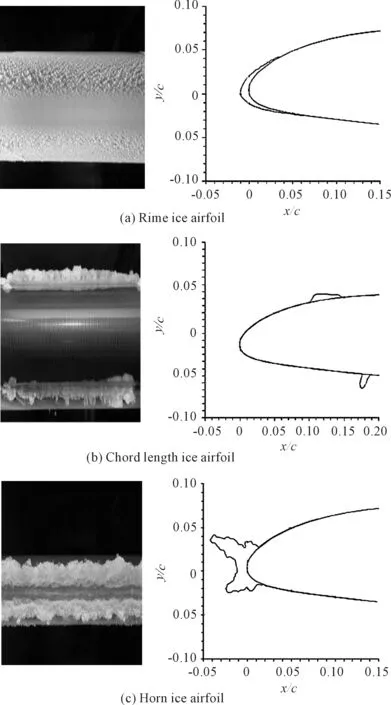
Fig.1 Solid model and two-dimensional trajectory of different ice-model
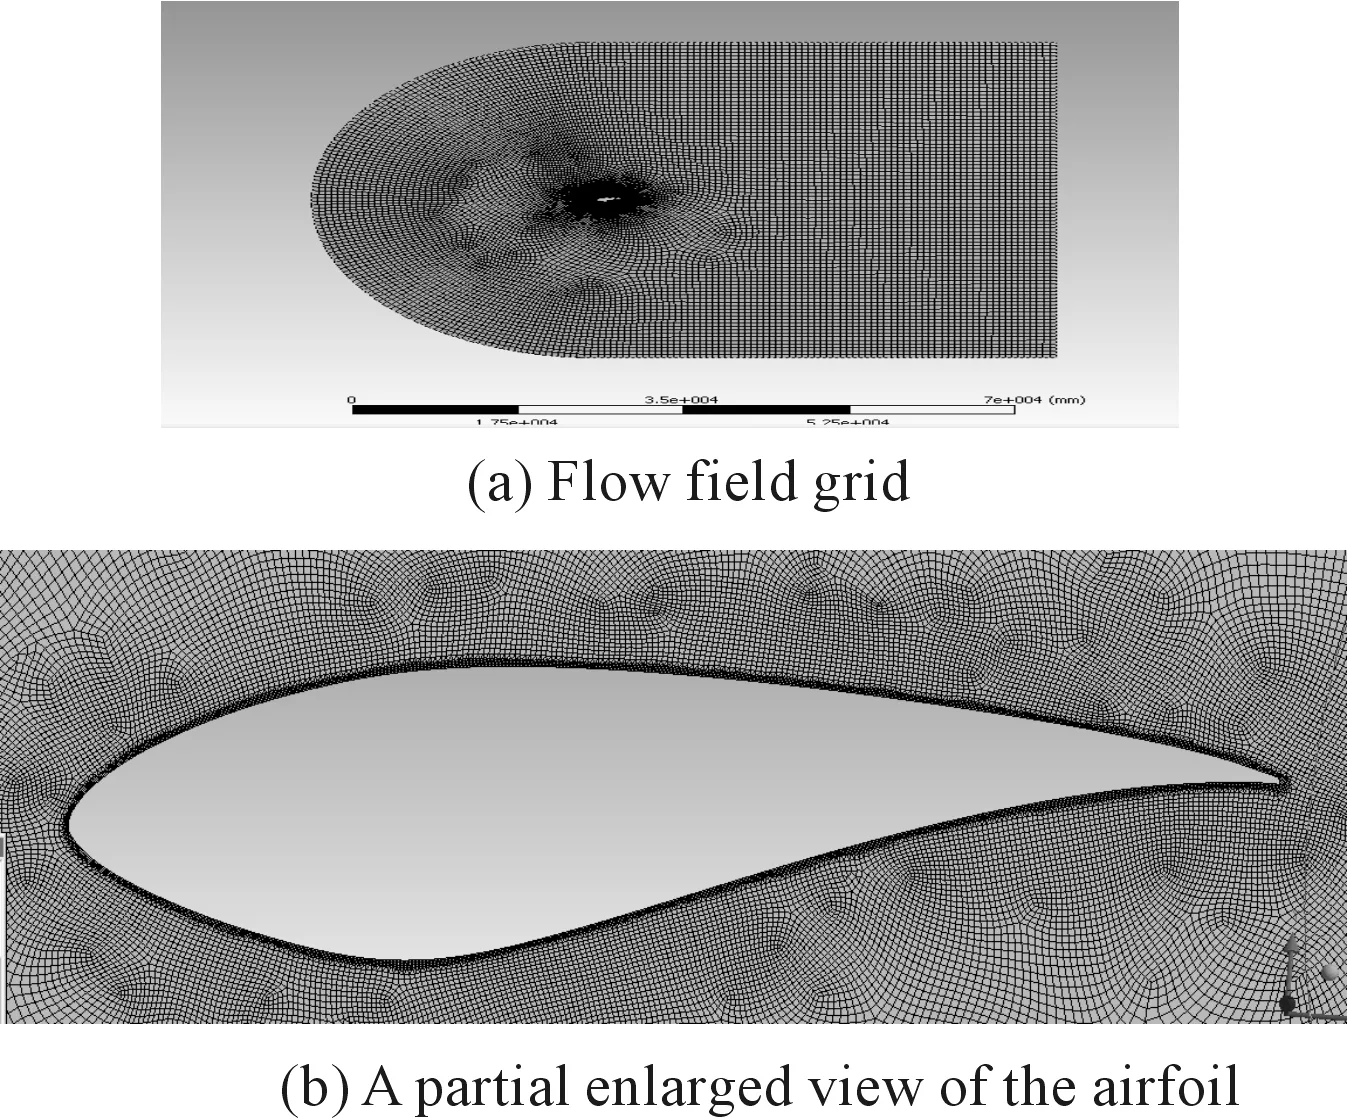
Fig.2 S818 airfoil computing grid
3 Basic theory of aerodynamics
3.1 Wind turbine power coefficient
The axial velocity inducing factoraand the radial velocity inducing factor b were stable value.
(1)
Where,λis tip speed ratio, combining with the knowledge of aerodynamics.CP, the power coefficient, can be calculated as follows.
(2)
Where,ζis lift-drag ratio andλtis the tip speed ratio of wind turbine design.
It can be concluded from the above formula that coefficient of wind turbine power was irrelevant to lift and drag coefficient value but only relates to lift-drag ratio of airfoil. The greater the value of airfoil lift-drag ratio was, the higher power efficiency was.λtis a constant value for a running wind turbine so that only the airfoil lift-drag ratio affects the utilization efficiency of power.
3.2 Fluid control equations
This article studied on flow around of airfoil under low wind speed condition in which inflow parameters Reynolds number was 1×10⁶-2×10⁶and Mach number was 0.04-0.08. In general, the fluid with Mach number lower than 0.1 can be regarded as incompressible flows and heat transfers was out of consideration.
The equations of numerical solution were Navier-Stokes equations of incompressible viscous based on Reynolds-averaged and it’s expressed in the Cartesian coordinate system[8] as follows:
Mass equation:
(3)
Momentum equation:
(4)
Where,uis the average fluctuating velocity;xis the position vector;ρis the air density;Pis pressure;uefis the effective viscosity coefficient;u′ is the fluctuating instantaneous value;i,j,kis the three components of Cartesian coordinate system.
3.3 Turbulence equations
Taking the compressibility of fluid, feasibility of establishment, requirement of precision and the limit of time into consideration comprehensively, Spalart-Allmaras model was used as turbulence model to calculate boundary flux. This model was first used in flow calculations especially when adverse pressure gradient exists within the flow region. It did well in calculation of boundary layer which was often selected for calculation near the Flow separation area. Additionally, the model combined with wall function was applicable for low grid precision and we can get accurate solution. To solve the dynamic viscosity of the vortex, Spalart-Allmaras model is a simple equation relatively.
The corresponding transport equation [9] is:
(5)

4 Icing airfoil lift and drag performance analysis
Based on the different icing conditions, the work established aerodynamic analysis model on Ice-free airfoil, airfoil of rime ice, chord-length ice and horn ice.We analyzed and calculated the influence of icing thickness and different icing shape to the aerodynamic performance under the condition of inflow wind with attack angle from -2° to 20°.
4.1 The influence of icing thickness to the aerodynamic performance
It can be concluded from Fig.3 to Fig.5 that the lift-drag ratio of airfoil decreased with the increase of the thickness of three shapes of ice. What’s more, between -2° and 5° attack angle the lift-drag ratio of airfoil increased in a small range. After 5° attack angle it reduced greatly and the thicker ice was the greater amplitude reduction was. The calculation results are shown in Table 1.
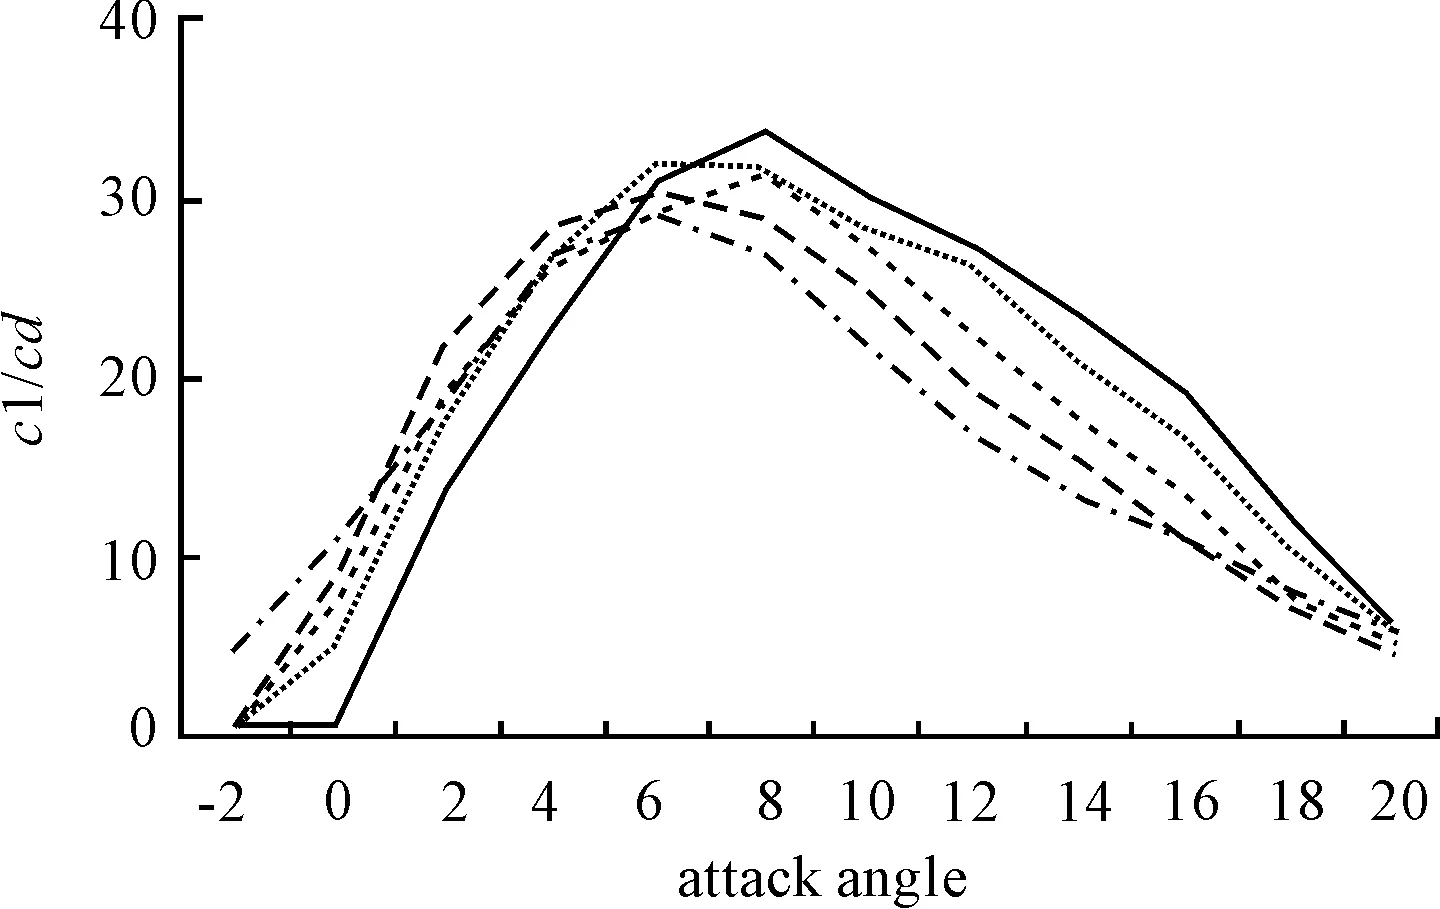
Fig.3 Lift-drag ratio curve of rime ice airfoil with different thickness
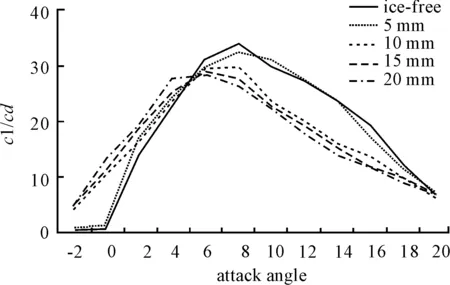
Fig.4 Lift-drag ratio curve of chord length ice airfoil with different thickness
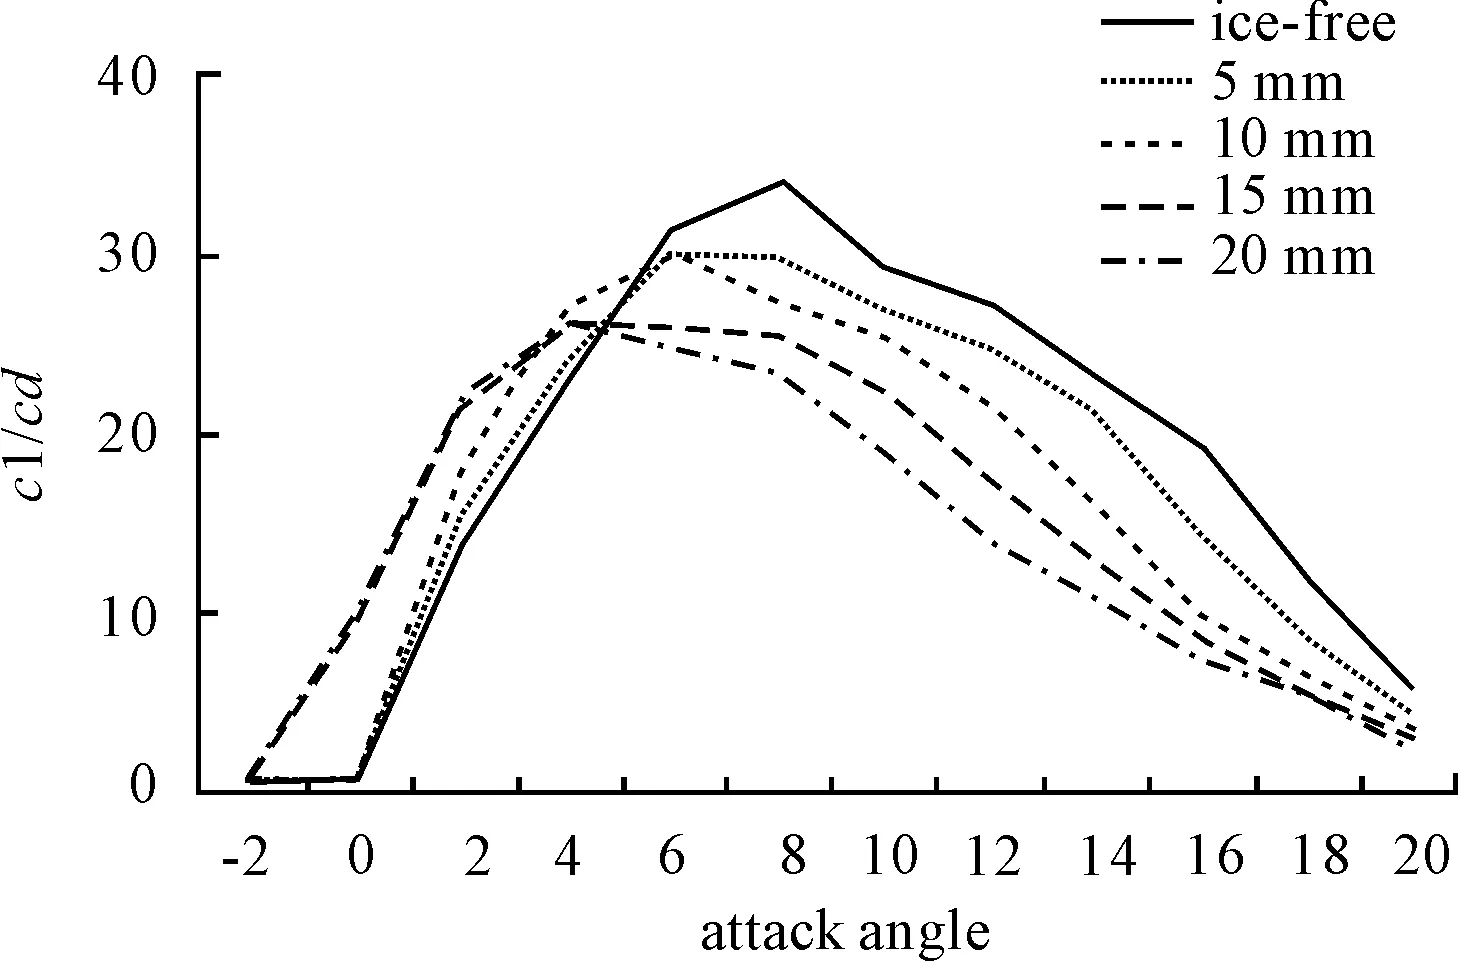
Fig.5 Lift-drag ratio curve of horn ice airfoil with different thickness
Table 1 Comparison of aerodynamic force of different icing thickness
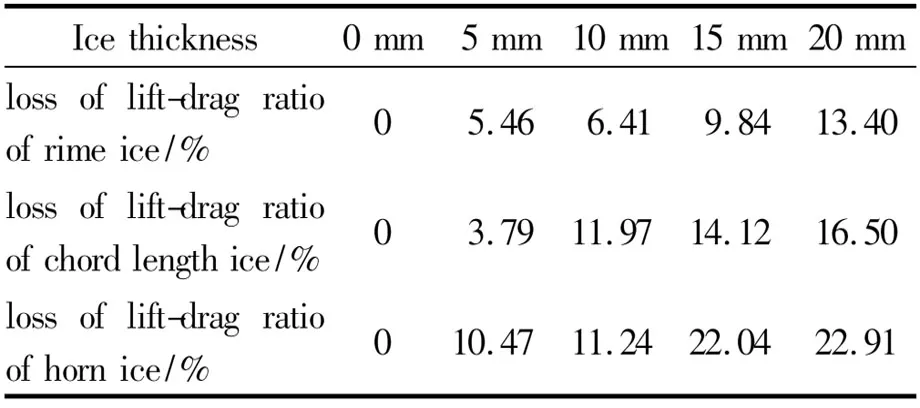
Icethickness0mm5mm10mm15mm20mmlossoflift-dragratioofrimeice/%05.466.419.8413.40lossoflift-dragratioofchordlengthice/%03.7911.9714.1216.50lossoflift-dragratioofhornice/%010.4711.2422.0422.91
As is shown in Table 1, the change of the loss of maximum lift-drag ratio of rime ice appeared to be uniform. Nevertheless, reduction was three times than before when the thickness of chord length ice was 15 mm and it became uniform again at 15 or 20 mm thickness.
There was a great mutation of reduction which was 10 times than the uniform when at 15 mm thickness of horn ice and reduction was back to uniform at 20 mm. Consequently, the increase of the horn ice thickness influenced coefficient of wind turbine power most.
Besides, the maximum lift-drag ratio of ice-free airfoil appeared at 8° attack angle. However, when ice thickness of rime ice and horn ice was 15, 20 mm it appeared at 6° and 4° attack angle which led to the stall of airfoil in advance.
4.2 The impact of different shape ice-model on airfoil aerodynamic lift and drag characteristics
To obtain a further understanding about the impact of different ice model on the coefficient of wind turbine power, three shapes with 10 mm thickness of icing airfoil were selected to have a comparative analysis, as shown from Fig.6 to Fig.8.
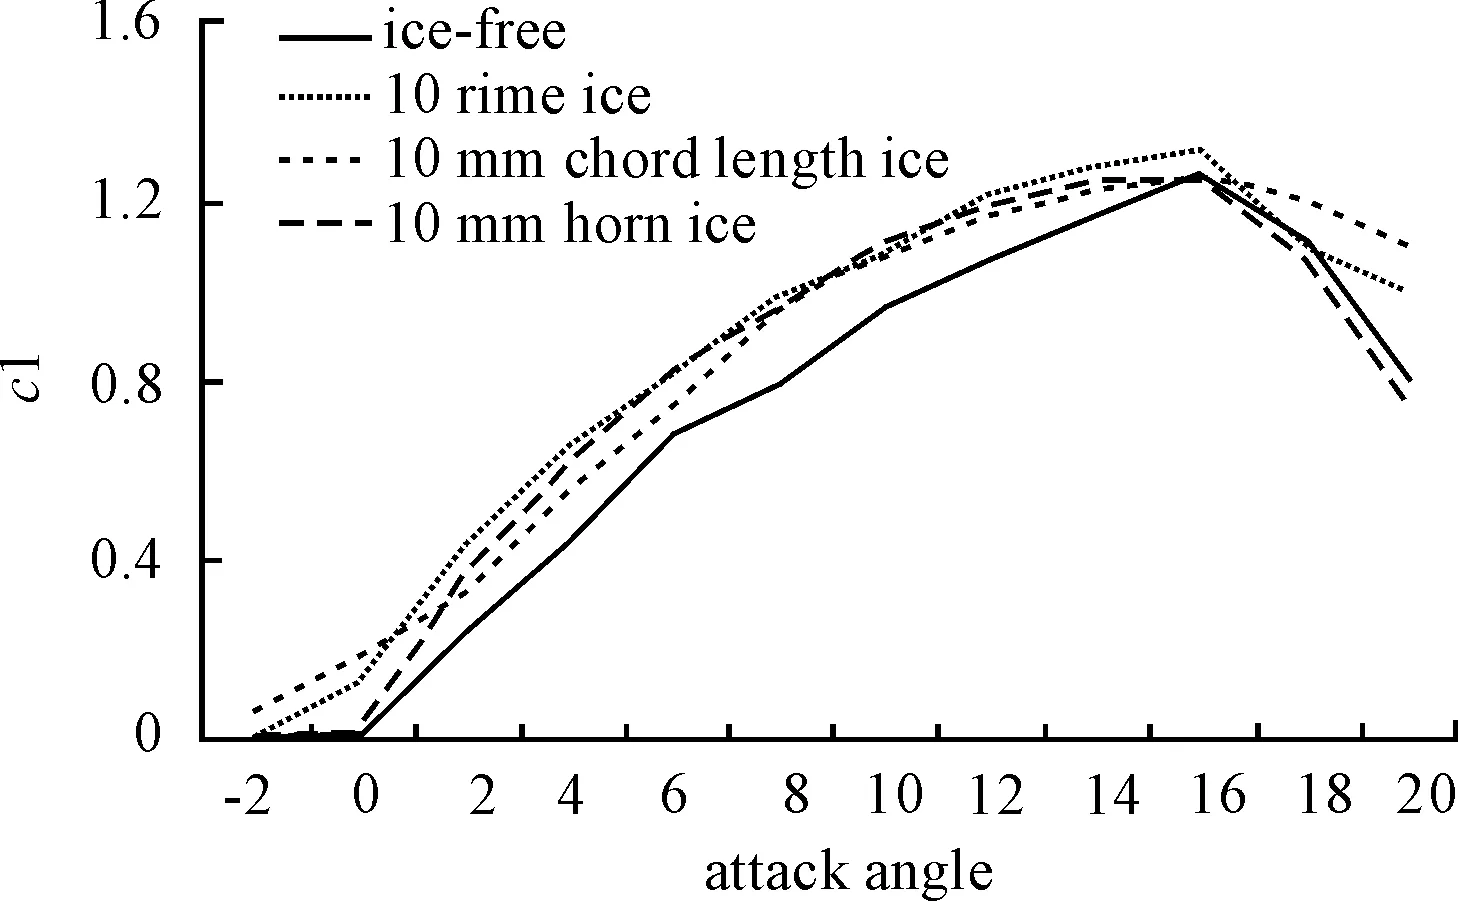
Fig.6 Lift coefficient comparison chart of airfoil with different thickness
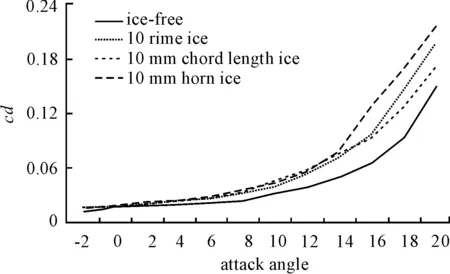
Fig.7 Drag coefficient comparison chart of airfoil with different thickness
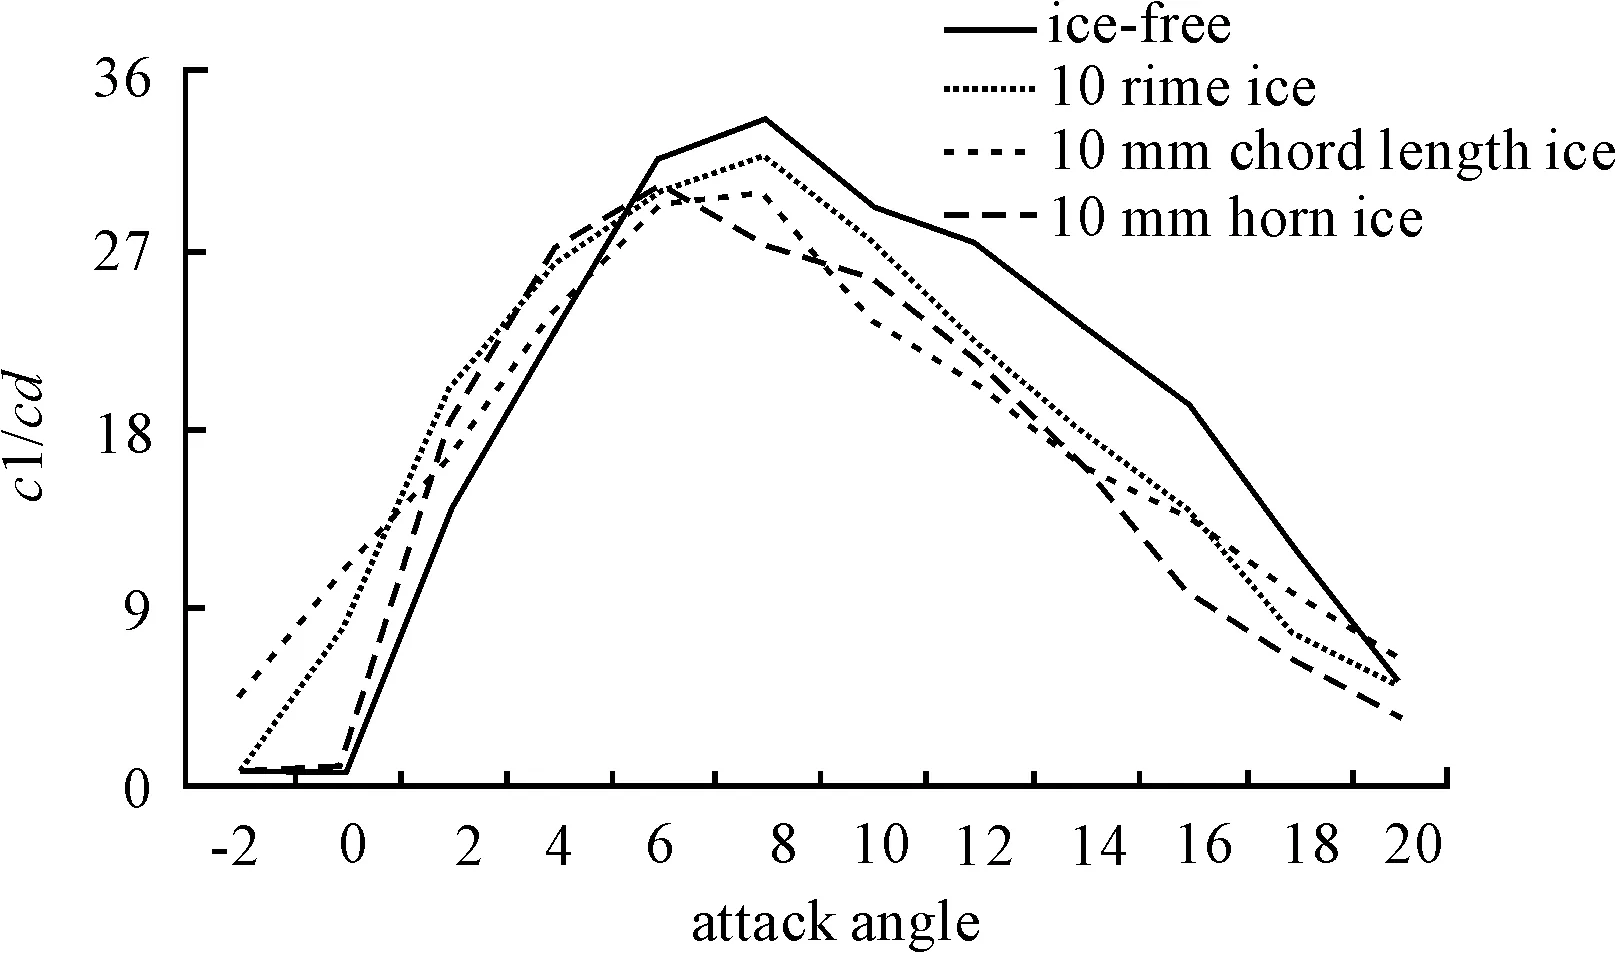
Fig.8 Lift-drag ratio comparison chart of airfoil with different thickness
Fig.6 indicates that the three ice-models with same ice thickness and attack angle from 1° to 16°, rime ice had the largest lift coefficient values, followed by the horn ice and the chord length ice was the minimum. From -2° to 1° and 16°to 20° of the attack angle, chord length ice had the largest lift coefficient values, followed by the rime ice and the horn ice was the minimum.
Fig.7 shows that three ice-models at the same attack angle less than 12° had almost the same drag coefficient values and after 12°horn ice had the largest drag coefficient values, followed by the rime ice and the chord length ice was the minimum.
At 10 mm icing thickness, the lift coefficient increased rapidly in a range of low attack angle while the drag coefficient increased sharply with the increase of attack angle. It can be concluded from the analysis of Table 2 that at the same thickness, the most evident reduction of lift-drag ratio was caused by horn ice and the stall of airfoil occurred ahead.
Table 2 Comparison of aerodynamic force of different ice-models
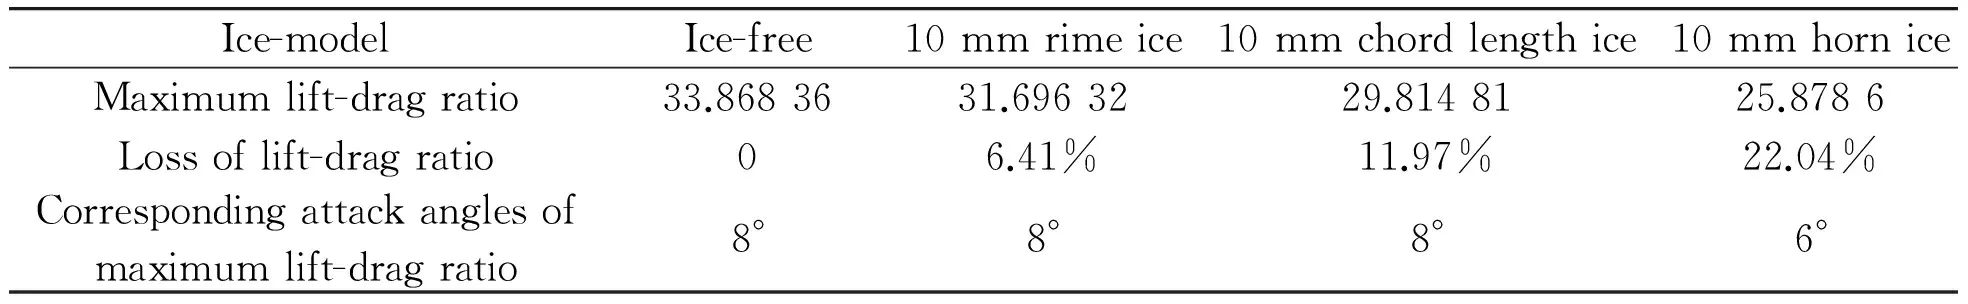
Ice-modelIce-free10mmrimeice10mmchordlengthice10mmhorniceMaximumlift-dragratio33.8683631.6963229.8148125.8786Lossoflift-dragratio06.41%11.97%22.04%Correspondingattackanglesofmaximumlift-dragratio8°8°8°6°
5 The analysis of surface pressure and velocity field of icing airfoil
The overall dimension of airfoil changed after icing which altered the speed and direction of the flow through blade [10]. Taking airfoil of three 10 mm thickness ice-model for study, velocity field and pressure on the different ice-model surface were obtained through analysis at 10° of attack angle, as shown in Fig.9 and Fig.10.
Comparing Fig. 9 (a) and (b), it can be found that there was little difference between the separation area in trailing edge of rime icing airfoil and no ice airfoil. Although the rime ice made the upper surface velocity increase obviously, the lower surface increased accordingly which decreased the pressure difference on the whole.
Fig.9 (d) indicates that there was a big separation bubble in flow field with the existence of horn ice. Because of the stagnation point on ice, boundary layer can’t coordinate the adverse pressure gradient appearing on the top of horn ice. The shape mutation in leading edge increased the flow velocity, changed the flow direction and separated flow on upper surface which gave birth to the low velocity area on near wall and vortex in trailing edge. Moreover, the big separation bubble redistributed pressure so the impulse changed, lift decreased and resistance increased.

Fig.9 The flow field distribution of four icing airfoil types at attack angle of 10°
Fig.9 (c) shows that in airfoil of chord length ice from leading edge to the one-third chord length the flow velocity decreased and flow direction became irregular. Also, after one-third chord length on the lower surface the flow separated and it led to the low velocity with vortex coming into being on near wall between the chord length ice and trailing edge while. Meanwhile, the flow velocity on far wall was greater than on no ice airfoil.
In a word, velocity field of chord length ice airfoil is complex and this icing type lengthens the downward flow and it develops the bound layer along the chord length direction. The shape always was various in different position of the chord length which made it more complicated than horn ice on influence of coefficient of wind turbine power.
From Fig.10 (a) and (b), it can be concluded that 10 mm rime ice almost had no effect on upper and lower pressure distributions and it just increased the pressure difference slightly. Comparing the 10mm chord length airfoil with no ice airfoil, the chord length ice had greatly changed the pressure distribution on airfoil surface especially when the upper surface pressure decreased suddenly after increase and the lower surface pressure distribution was irregular. After the fluid flowing through the chord length icing airfoil the pressure distribution gradually became steady but the upper and lower pressure difference was approximately a half than before.
Fig.10 (a) and (d) shows that upper and lower surface pressure distributions with obvious fluctuations was extremely uneven in leading edge of horn ice airfoil. Specifically, upper pressure difference tended to be stable near one-third chord length of airfoil and it slowly increased similar to no-ice airfoil’s near trailing edge. From one-tenth of chord length the lower surface pressure distributions tended to be stable and to trailing edge surface pressure value remained the same. Thus, on account of the significant angularity of horn ice, static pressure of whole airfoil surface changed and vortex was formed in the rear airfoil.
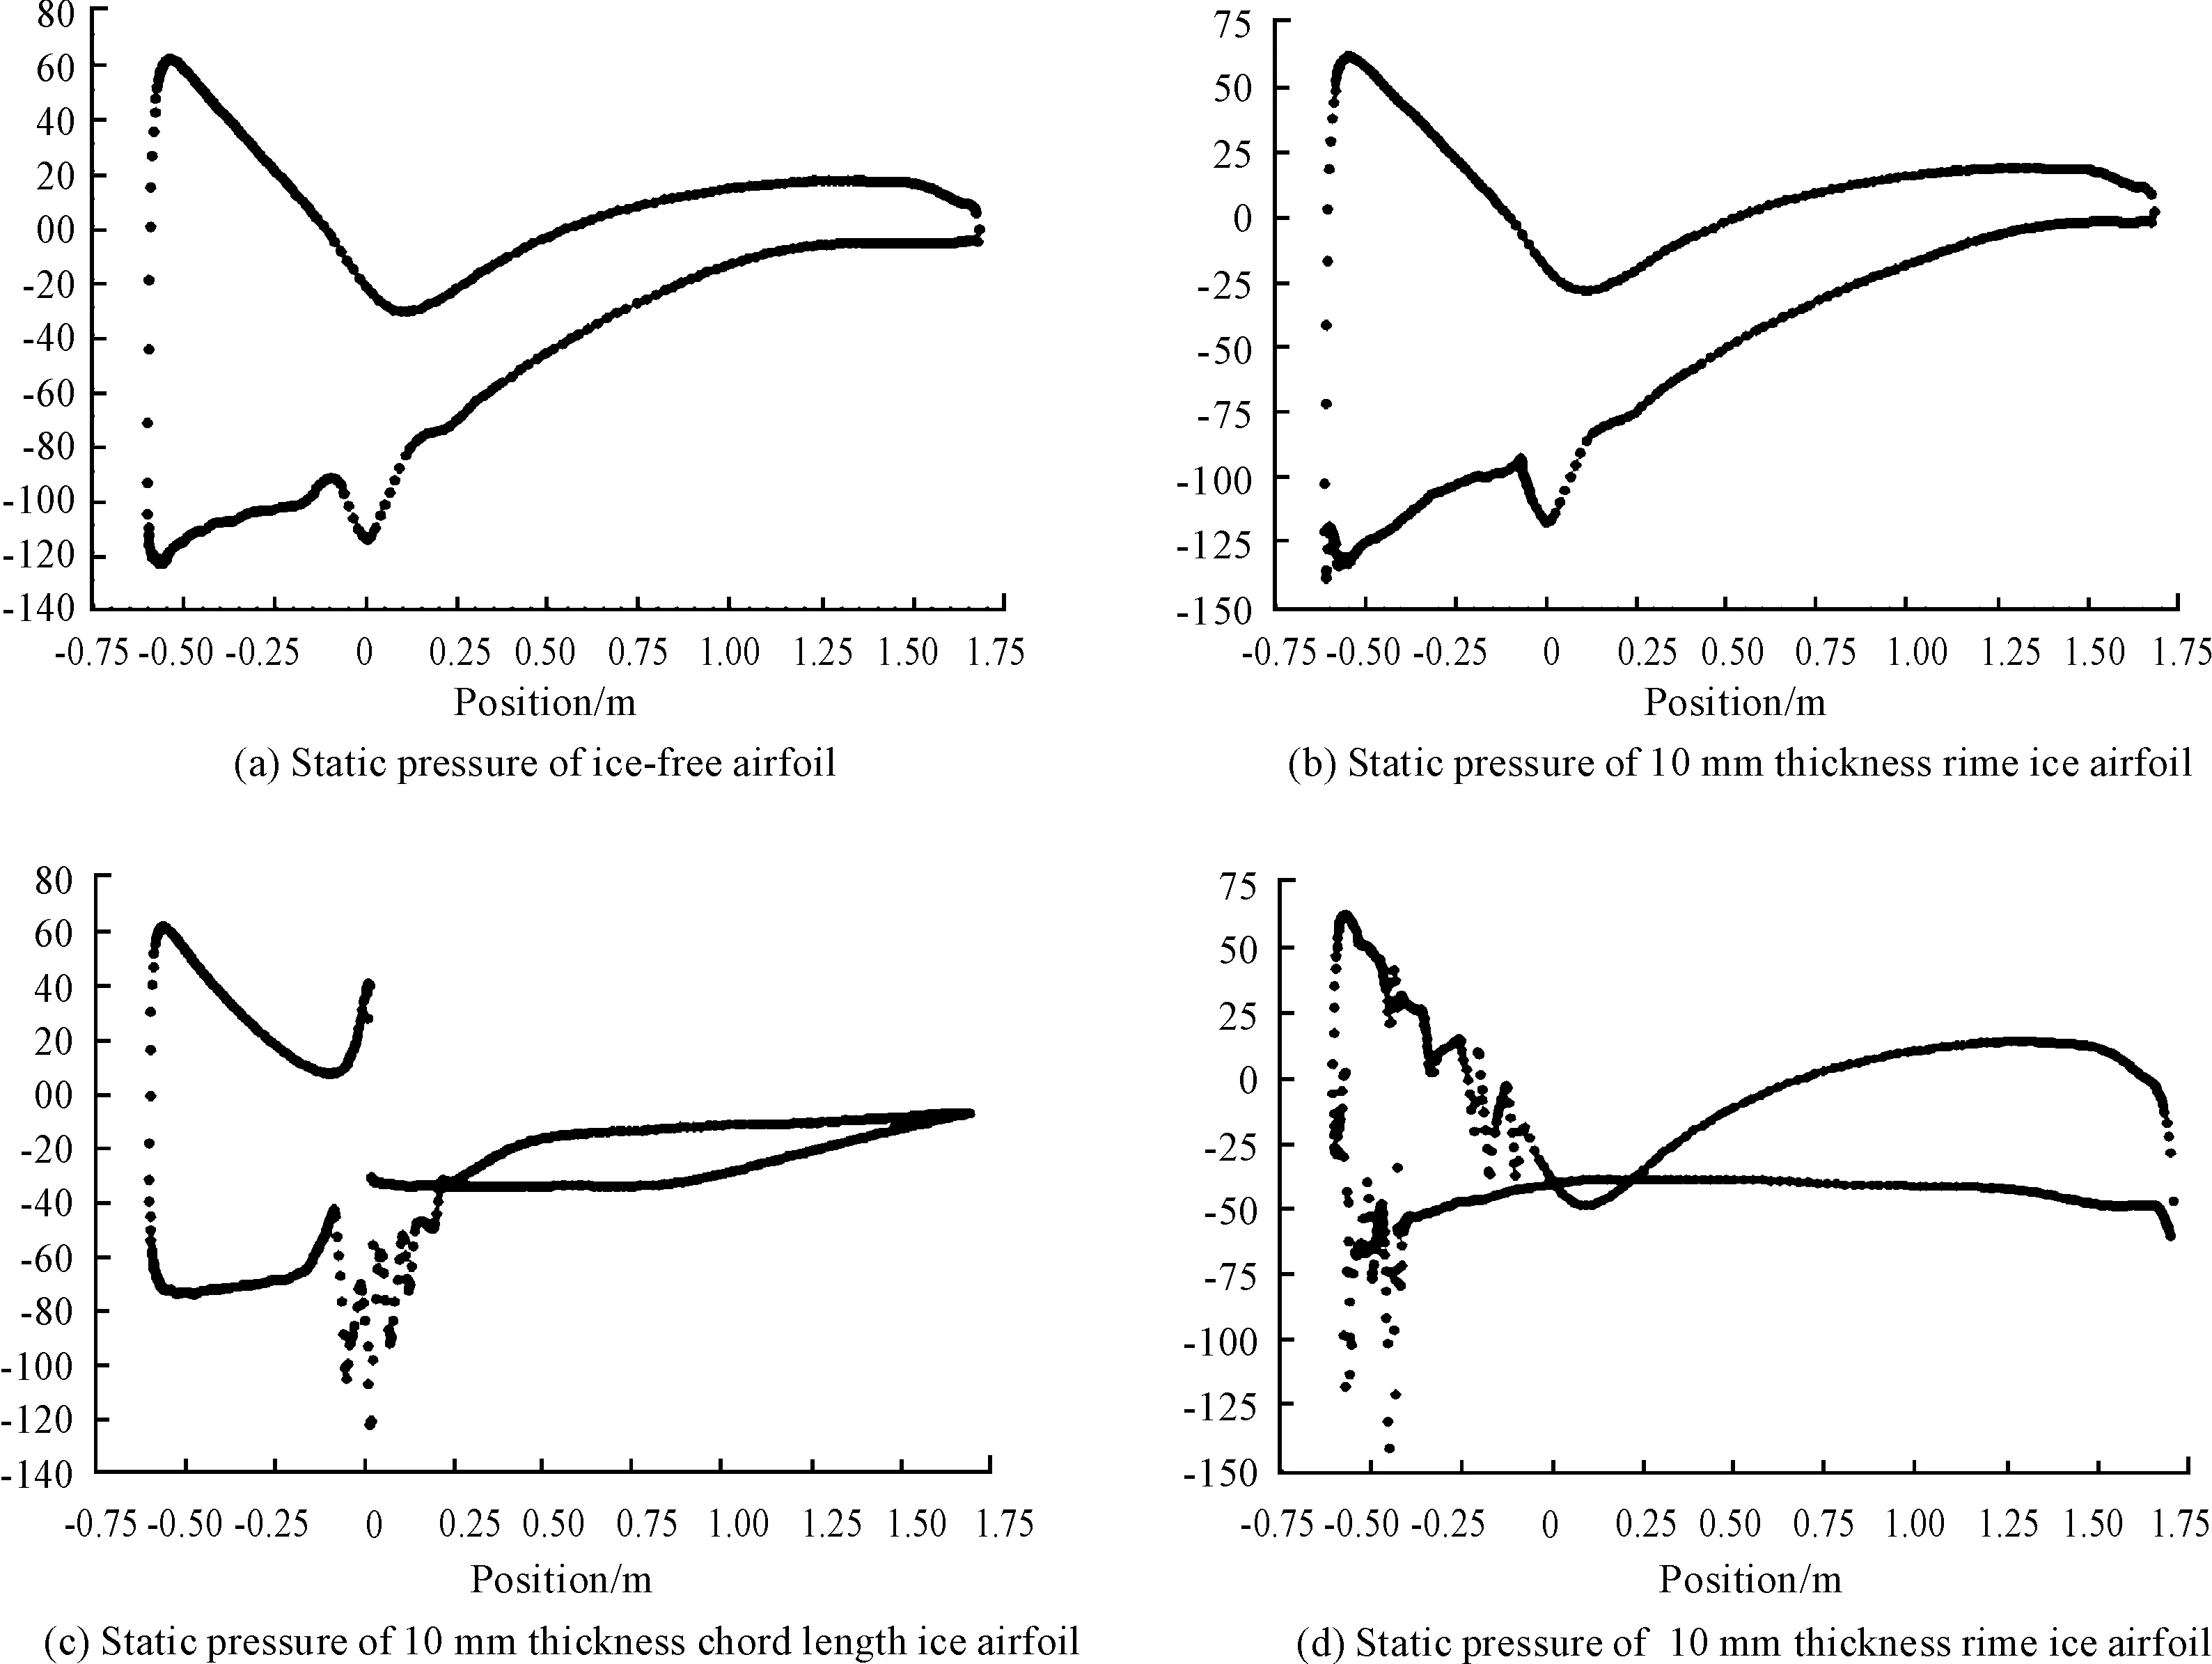
Fig.10 Surface static pressure distribution curve of four kinds of airfoil at 10° attack angle
6 Conclusions
In summary, through the aerodynamic performance numerical simulation of three ice-model (rime ice, chord length ice and horn ice) airfoil, the work analyzed the effect of different ice-model on aerodynamic performance of the airfoil in three aspects from the lift and drag, the velocity field and surface pressure distribution.
The results are as follows :
1) With the increase of the thickness of three ice-models, the maximum lift-drag ratio of airfoil decreased and in different degree the stall occurred in advance. After 5° attack angle the lift-drag ratio comparing with the ice-free airfoil’s reduced greatly and the thicker ice was the greater amplitude reduction was. Certain thickness of chord length ice and horn ice led to the mutation of the loss of lift-drag ratio and the influence of horn ice was more significant for the amplitude reduction was 10 times than normal.
2) When ice thickness of three ice-models is 10 mm, the maximum lift-drag ratio amplitude reduction of horn ice reached the maximum at 22.04%,the chord length ice at 11.97% and rime ice at 6.14%. All results above indicate that horn ice has the greatest impact on airfoil aerodynamic performance, followed by the rime ice and the chord length ice is the slightest.
Those results provide theoretical basis for feasible deicing measure and efficient strategy of fan control in different season to guarantee the security and stability of fan operation.
Acknowledgements
This paper is supported by National Natural Science Foundation of China (No.51065026 and No.51465055) and the Natural Science Foundation of Xinjiang (No. 2014211A010).
[1]Liu Xiong, Chen Yan, Ye Zhiquan. Analysis of the influence of aerodynamic performance enlarging the airfoil’s trailing edge thickness [J]. Solar Technology. 2006(27): 489-495.
[2] Montreuil E, Chazottes A, Guffond D. Enhancement of Prediction Capability in Icing Accretion and related Performance Penalties Part I: Three-dimensional CFD Prediction of the Ice Accretion. 1st AIAA Atmospheric and Space Environments Conference.
[3] Fortin G, Perron J. Wind Turbine Icing and De-Icing[C]// 47th AIAA Aerospace Sciences MeetingIncluding The New Horizons Forum and Aerospace Exposition, Orlando, Florida, 2009.
[4]Zhang Dalin, Yang Xi, Haisong A. Numerical simulation of supercooled water droplets impingement on icing surface[J]. Journal of Aerospace Power, 2003 (1): 87-91.
[5]Yi Xian, Zhu Guolin. Numerically simulating of ice accretion on airfoil[Z]. 2002, 20 (4):428-433.
[6]Hai Jizhe, Sun Wenlei, Zhou Yujun. Study on Aerodynamic Characteristic of Blade Airfoil of Wind Turbine [J]. Fluid machinery, 2013, 41(8): 30-34.
[7]Jiang Haibo, Cao Shuliang, Yang Ping. Power limit of horizontal axis wind turbine [J]. Chinese Journal of Mechanical Engineering, 2011(47): 112-118.
[8]Tang Jin. Research of Improving Aerodynamic Performance of Wind Turbines Blade Profile [D]. Beijing: Tsinghua University, 2004.
[9]Wang Fujun. Fluid dynamics analysis of computational[M]. Beijing: Tsinghua University Press, 2004.
[10]Wang Wenlong, He Bin, et al. Numerical simulation of aerodynamic performance on icing airfoil of wind turbines blade [J]. Renewable energy resources, 2013(31): 60-64.
风力机叶片覆冰翼型气动性能的数值模拟
海几哲*,孙文磊,周玉俊
新疆大学 机械工程学院,乌鲁木齐830049
以某1.5 MW风机叶片S818翼型为研究对象,建立了翼型流场有限元分析模型。采用基于Reynolds平均的Navier-Stokes不可压缩粘性方程作为流动控制方程,对无冰翼型、霜冰、弦长冰及角冰翼型进行数值模拟分析,得到了-2°-20°攻角下不同厚度叶片翼型的升阻比、速度矢量和表面压力分布。研究结果表明:覆冰越厚,翼型的最大升阻比降幅越大。对于弦长冰和角冰在厚度达到一定值时,使得升阻比损失产生较大的突变。在覆冰厚度都为10 mm时,角冰的最大升阻比减幅最大,达到22.04%;其次是弦长冰为11.97%,霜冰的最小为6.41%。同时结冰后的翼型会提前进入失速区,导致桨叶气动性能恶化,降低了风机的功率系数。
风力机;翼型;覆冰;气动性能
8 March 2015; revised 11 May 2015;
Ji-zhe HAI, Associate professor.
Doctor. E-mail: haijizhe@163.com
10.3969/j.issn.1001-3881.2015.18.002 Document code: A
TK83
accepted 13 July 2015
Hydromechatronics Engineering
http://jdy.qks.cqut.edu.cn
E-mail: jdygcyw@126.com
猜你喜欢
天然气与石油(2022年4期)2022-09-21
北京航空航天大学学报(2021年6期)2021-07-20
测控技术(2018年5期)2018-12-09
测控技术(2018年9期)2018-11-25
能源(2018年5期)2018-06-15
能源(2017年9期)2017-10-18
现代工业经济和信息化(2016年12期)2016-05-17
安徽冶金科技职业学院学报(2015年3期)2015-12-02
振动工程学报(2015年1期)2015-03-01
太阳能(2015年6期)2015-02-28

- 机床与液压的其它文章
- Design and simulation of the hardware in the loop simulation platform for vehicle ACC system
- The design of the hydraulic cylinder test bed based on cartridge valves
- Research on flexible manufacturing system real-time scheduling optimization
- Mathematic modeling method for addendum line of spiral bevel Gear
- A research on film thickness of a typical dynamic seal for hydraulic actuators
- Manufacturing of self-lubricating diamond tools with Ni-Cr alloy adding with Ni/C