
Numerical study of hydrodynamic process in Chaohu Lake*
2015-11-25 11:31CHENYuanying陈苑盈LIUQingquan刘青泉
水动力学研究与进展 B辑 2015年5期
CHEN Yuan-ying (陈苑盈), LIU Qing-quan (刘青泉)
Laboratory for Mechanics in Fluid Solid Coupling System, Institute of Mechanics, Chinese Academy of Sciences,Beijing 100190, China, E-mail:chenyuanying@imech.ac.cn
Numerical study of hydrodynamic process in Chaohu Lake*
CHEN Yuan-ying (陈苑盈), LIU Qing-quan (刘青泉)
Laboratory for Mechanics in Fluid Solid Coupling System, Institute of Mechanics, Chinese Academy of Sciences,Beijing 100190, China, E-mail:chenyuanying@imech.ac.cn
2015,27(5):720-729
In this paper, the hydrodynamic characteristics of water flow in Chaohu Lake are studied by using the finite volume coastal ocean model (FVCOM), which is verified by the observed data. The typical flow field and the 3-D flow structure are obtained for the lake. The flow fields under extreme conditions are analyzed to provide a prospective knowledge of the water exchange and the transport process.The influence of the wind on the flow is determined by the cross spectrum method. The results show that the wind-driven flow dominates most area of the lake. Under prevailing winds in summer and winter, the water flows towards the downwind side at the upper layer while towards the upwind side at the lower layer in most area except that around the Chaohu Sluice. The extreme wind speed is not favorable for the water exchange while the sluice’s releasing water accelerates the process. The water velocity in the lake is closely related with the wind speed.
Chaohu Lake, FVCOM, flow field, wind-driven, extreme situation, flow’s response
Introduction
The Chaohu Lake (117oE16ʹ54″-117oE51ʹ46″,31oN25ʹ28″-31oN43ʹ28″), in the middle and lower reaches of Yangtze River, lies in Anhui Province, China. It is one of the five largest freshwater lakes in China. It is about 54.5 km long from east to west and 21 km long from south to north. Its area and average depth are 780 km2and 2.7 m, respectively. In general, it is divided into two parts, the east part and the west part,by the line of Zhongmiao-Mu Mountain-Qitou Mouth as shown in Fig.1. There are 11 rivers around the lake. Among them, Hangbu-Fengle River, Pai River, Nanfei River, Dianbu River contribute more than 90% of the runoff[1]. Chaohu Sluice lies at the connection of east Chaohu Lake and Yuxi River, and its design discharge rate is 1 370 m3/s. The construction of the sluice leads to a reduction of water exchange from 1.36×10⁹ m3to 1.72×10⁸ m3between the lake and Yangtze River[2],which has a further great impact on the lake’s hydrodynamic process. Due to the extended retention time in the lake and the increased emission of the pollution like industrial waste and sewage runoff from around the lake, Chaohu Lake has become one of the three most eutrophic lakes in China. And the water quality in the lake shows a great heterogeneity in space. Generally speaking, the western part is in the hypertrophic state while the east part is in the mesotrophic state[3]. Algae blooms can more frequently and in greater amount be found in the western part than in the eastern part, and the northwest corner of the lake is the highest incidence area[4].
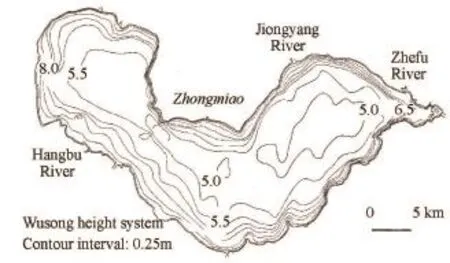
Fig.1 Schematic diagram of Chaohu Lake, rivers around it, and the underwater topography of the lake
The horizontal distribution of biomass is usually determined by factors as the hydrodynamic process,the water temperature and the nutrient transport[5]. As to Chaohu Lake, the uneven distribution of the water quality is closely related with the hydrodynamic process and the nutrient loading from rivers around the lake[6]. Thus, in order to have a better understanding of the eutrophication problem in the lake, the dynamic and transport process needs to be studied firstly.
Some previous studies and qualitative descriptions of the typical flow field of Chaohu Lake can be found in Journal of Chaohu Lake, where one may find that the flow in Chaohu Lake is a combined one, dominated by the gravitational flow and affected by the wind force. Tu et al.[1]suggested that the flow is driven by the wind and the gravity at the same time. According to their flow filed data collected in 1987, the flow in the west part is driven by the wind, i.e., the water at the surface flows to the downwind side while the water at the bottom flows in an opposite direction,however in the area close to the Chaohu Sluice, the water is apparently affected by the discharge, i.e., the water flows from west to east no matter what its depth is[1]. Even though the basic description of the hydrodynamic characteristics of Chaohu Lake can be acquired from some previous works, there are very limited detailed and quantitative studies. The driven force and the flow patterns of the lake are still poorly understood and need to be further studied.
Numerical models can help the lake management in selecting the optimal control strategies. Simulation of the flow filed can assist us to know more clearly what behind the water quality changes and eutrophications. Numerical simulations were carried out in some shallow waters to investigate their hydrodynamic and transport process. Xu and Liu[7]established a 2-D numerical model to study the wind-induced currents in Lake Taihu. Further, Gao et al.[8]studied the transport process and the TP distribution based on the hydrodynamic process in the lake. Wang et al.[9]used the Lagrangian particle tracking method to investigate the seasonal circulation of the Bohai Sea and compare the effects of different factors on the circulations. Wang et al.[10]coupled a 2-D hydrodynamic model with the water quality framework to study the sediment transport process and the heavy metal pollution in Taihu Lake. As a trend, the numerical method has become one of the most effective methods to analyze the fluid dynamic process of lakes in detail.
Consequently, this paper studies the typical flow field of Chauhu Lake by a comprehensive numerical simulation using 3-D hydrodynamic numerical models,to obtain the driven factors of the flow, the characteristics of the flow field, and the response process of the flow to the driven factors in Chaohu Lake. The 3-D flow structure of the lake is described to provide a basis from the perspective of hydrodynamics for the further researches of the transportation process.
1. Material and method
The numerical simulations are carried out by using the finite-volume coastal ocean model(FVCOM), which is a 3-D free-surface model with unstructured grids. The FVCOM was widely used to study the hydrodynamic and transport process in aquatic areas such as lakes, estuaries and oceans[11-14]. It was applied in shallow waters, like Lake Taihu in China to study the surface mixed layer depth[15], and also Lake El-Manzala in Egypt for salinity distribution and water management[16]. Recently, it was also used to investigate the seasonal circulation and thermal structure in Great Lakes[17].
The governing equations of the water movement in the FVCOM are as follows[18]:
(1) Momentum equations
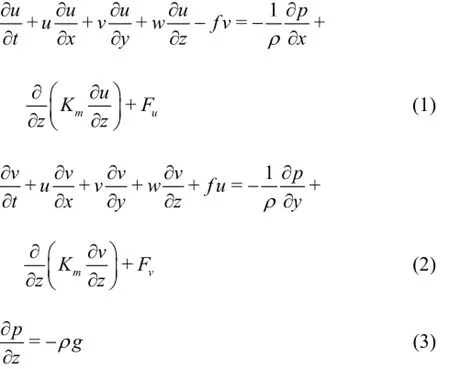
(2) continuity equation

in whichx,y,z are the east, north and vertical coordinates, respectively,u,v,w are the velocities in the corresponding direction,p is the pressure,ρ the density,g the gravitational acceleration,fthe Coriolis parameter, andKmthe vertical eddy viscosity coefficient.
Surface and bottom boundary conditions are as follows:
Atz=ζ(x,y,t)

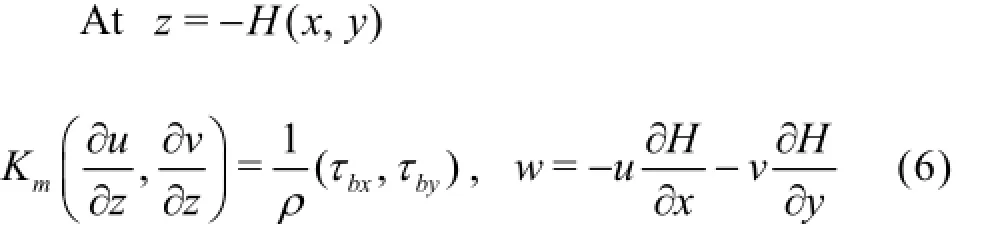
in which (τsx,τsy)are the surface wind stresses inx and y directions, respectively, andare the bottom stresses inxand y directions,ζ is the height of the free surface,Cdis the drag coefficient and is determined by
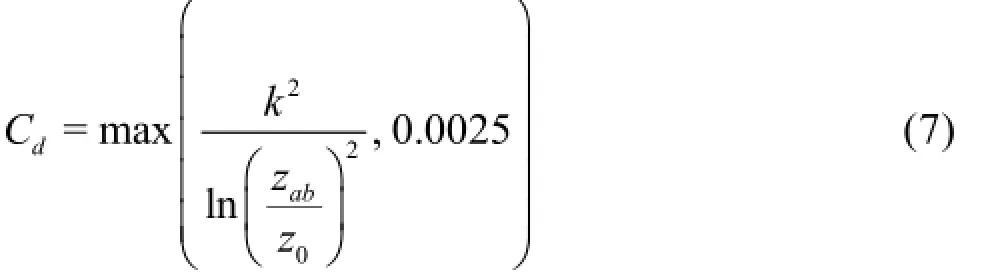
where k =0.4is the von Karman constant,zabis the height of a logarithmic bottom layer andz0is the bottom roughness parameter.
For adding discharge from a river at a specific node, thexandycomponents of the velocity resulting fromQ at different layers are:
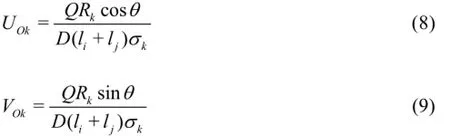
whereQ is the river water discharge,θis the angle betweenxdirection and the coastline,σkis the thickness of thekt hlayer,liand ljare the half lengths of the coastal sides of the neighbor elements.
In the vertical direction, all equations are transformed to theσ coordinate according to the expression

whereH is the bottom depth, andDthe total water column depth.σ coordinate is convenient in representing an irregular bottom topography and making it smooth. The σ coordinate is widely used in numerical models, especially for places w[i1t9h-22s]teep topographies such as lakes and coastalareas.
In the above equations, the vertical eddy viscosity coefficient Kmis calculated by the MY-2.5 model(the Mellor and Yamada level 2.5 turbulent closure model).

in whichl is the turbulent macroscale,qis the turbulent kinetic energy, andq2=(u′2+v′2)/2,Sisma stability function

in which Gh=(l2g/q2ρo)ρz, and the upper bound of Ghis 0.023 in unstable stratification cases and the lower bound is -0.28 in stable stratification cases.

Fig.2 Unstructured mesh for simulation
In the model, the mode splitting method is used,by which the currents are divided into external and internal modes with two different time steps. And for the external mode, a modified fourth-order Runge-Kutta time-stepping scheme is used, with a secondorder temporal accuracy. In the internal mode, the momentum equations are solved by a combined explicit and implicit scheme. A first-order accurate forward Euler scheme is used to solve the local change of currents, a second-order accuracy upwind scheme is used to compute the advection terms explicitly and the vertical diffusion terms implicitly. With a fast convergence, in our case, it takes about 50h for the velocity to converge to a constant under the stable wind condition. Unstructured grids are used for the calculation,with a resolution of about 500 m, as shown in Fig.2. The domain is divided into five uniform layers in the vertical direction and the number of layers increases downwards. The underwater topography is shown in Fig.1, measured in 1986, recorded by Journal of Chaohu Lake.
The wind data used in this research are obtained from Mushan automatic weather station in Hefei,Anhui Province (as shown in Fig.1), where the hourly data of the wind direction and speed in 2012 are recorded. Besides, the wind data on 11th August, 1987from Chaohu and Hefei weather station (shown in Fig.1) are also used for the model verification.
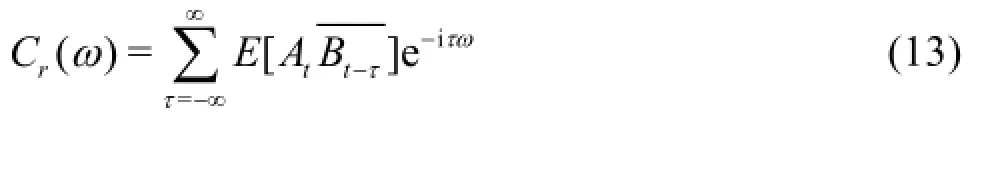
The cross spectral method is employed to analyze the correlation between the water flows and the wind force and the response time. The cross spectrum Cr(ω)between two time seriesAandBis defined by
Let Cr(ω)=X(ω)+iY(ω). The coherence C(ω)and the phase differenceφ(ω)between the time seriesA andB can be calculated by Eq.(14) and Eq.(15), respectively.
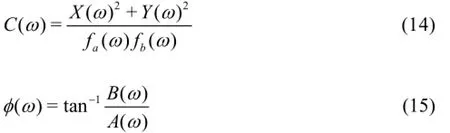
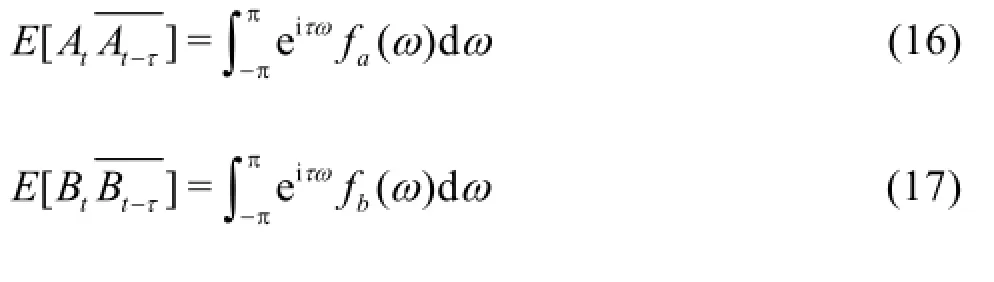
where fa(ω)and fb(ω)are the power spectrums of A(ω)and B(ω), respectively. And fa(ω)and fb(ω)are defined as:
The observed flow field on August 10th to 12th,1987 by Tu et al.[1]is used for the model verification. 8 main rivers around Chaohu Lake are considered and the month-average discharge in August 1987 is used. The water discharge of Chaohu Sluice is set to be 500 m3/s in the simulation. The discharge data of the rivers and the sluice are shown in Table 1[1]. As recorded by Hefei Automatic Station and Chaohu Automatic Station, the daily average wind speed on August 11th, 1987 is 3.0 m/s and 1.3 m/s, respectively. The data are offered by China Meteorological Data Sharing Service System. And the southeast wind is prevailing in summer[1]. Thus the speed in the wind field is set to be 3.0 m/s southeast in the west part and is continuously decreased to 1.3 m/s east. Because we fail to find the roughness data for Chaohu Lake in both the in-situ observation and in the numerical experiment, we set the bottom roughness height to be 0.01 m, in view of the numerical experiments in Taihu Lake[23]. This is because both lakes lie at the middle and lower Yangtze River and have a similarity in their sediment deposition.
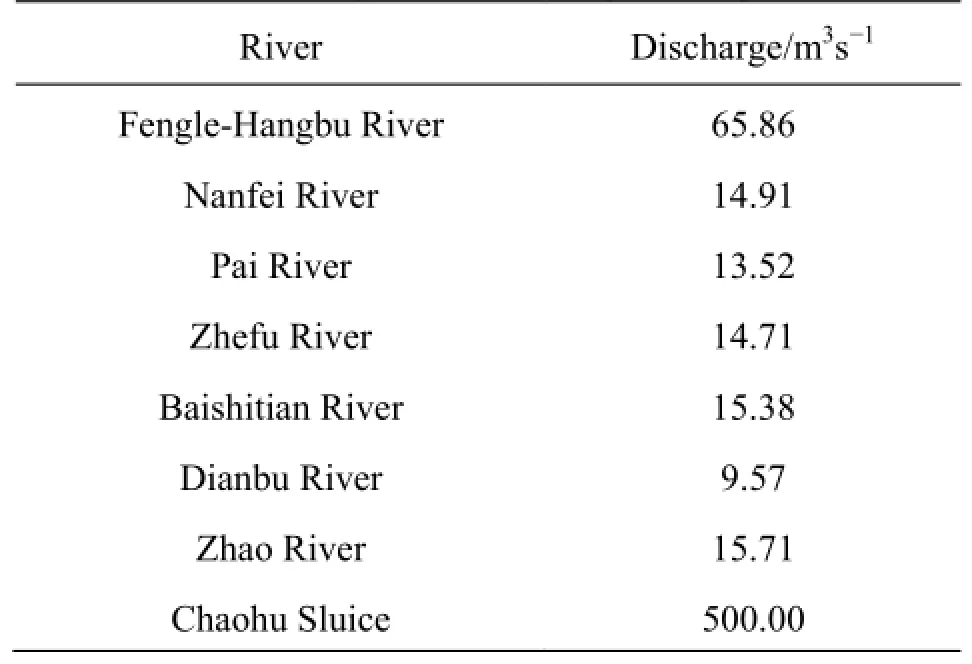
Table 1 Month-average river discharge in August, 1987
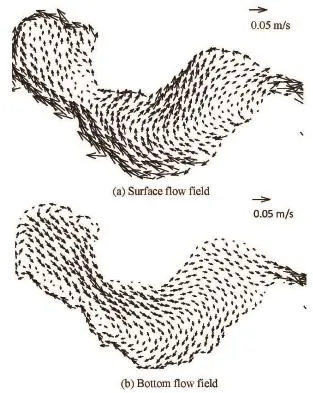
Fig.3 Simulated flow field for calibration
Simulated results (Fig.3) show that at the surface layer, the water in the western lake flows towards the downwind side and a return flow exists in the middle of the lake, which changes its direction from northwest at the estuary of Zhaohe River to northeast at Zhongmiao. At the same time, the water flows towards Chaohu Sluice in the east end of the lake. The flow at the surface has a velocity between 0.01 m/s and 0.06 m/s. At the bottom layer, there exists a compensation current at the western lake, which flows towards the upwind side. And the water at the east end of the lake still flows eastwards because of the sluice’s releasing water. The velocity at the bottom layer is between 0.005 m/s and 0.05 m/s. A comparison with the observed flow field in Fig.4 indicates that the simulated results are in good agreement both in the velocitymagnitude and direction and have well revealed the flow structure in the lake.

Fig.4 Observed flow field by Tu et al.[1]
2. Results and discussions
2.1 Basic patterns of typical flow fields
2.1.1 Comparison between wind-induced flow and gravitational flow
As stated above, the current in Chaohu Lake is a combination of the wind-induced current and the gravitational flow. In order to compare the different effects of these two driving factors, the wind-induced current and the gravitational flow in the lake are simulated separately.
The southeast wind is prevailing in summer,while in winter it is the northwest wind. The wind speed is usually between 0.5 m/s and 4 m/s. To obtain the typical wind-induced flow field in Chaohu Lake,we use the average wind speed in 2012 observed in Mushan Station, i.e. 2.7 m/s, and the wind direction is southeast, which is the prevailing wind direction in summer. 8 main rivers, including Hangbu-Fengle River, Pai River, Nanfei River, Dianbu River and Baishitian River, which account for over 99% of the total runoff into Chaohu Lake, are considered in the simulation. And the discharge rate of Chaohu Sluice is 500 m3/s. The rivers and their runoffs are shown in Table 1. We simulate the wind-induced current by just considering the wind force and disregarding the river inflow and the sluice’s discharge. And we simulate the gravitational flow by only considering the river inflow and the sluice’s discharge with the wind speed kept zero.

Fig.5 Simulated results of wind-induced motion
Simulated results of the wind-induced flow field under the 2.7 m/s southeast wind are shown in Fig.5. The surface water flows towards the downwind side,i.e., in the northwest direction, with a velocity between 0.015 m/s and 0.055 m/s. The bottom water flows in a reverse direction, which is a compensation flow induced by the wind, with a velocity between 0.015 m/s and 0.23 m/s. For the depth-average flow field, there exist five local circulations in the whole lake, and the velocity is between 0.004 m/s and 0.04 m/s.
The simulated gravitational flows are shown in Fig.6. Both of the surface and bottom flow fields show the same pattern as the depth-average flow. A main current is formed flowing from west to east. The velocity in the east part of the eastern lake is between0.01 m/s and 0.3 m/s and becomes larger in the area around the sluice. Compared with the current described above, the velocity in other areas is in the order of 10-3m/s, small enough to be neglected. In the area around river estuaries, no large velocity is found, because the runoff discharges from the rivers are quite small and the area of Chaohu Lake is large. Comparing the simulated results of the wind-induced motion and the gravitational flow, it is found that the velocities of the wind-induced current are around 10-2m/s while the velocities of the gravitational flow in most area are around 10-3m/s. In most area of the lake, the wind-induced motion with the annual-average wind speed is dominant. Only in the area around the sluice,the velocity of the wind-induced motion and that of the gravitational flow are comparable. Hence, the wind force is the main driving factor and the lake is dominated by the wind-induced flow.
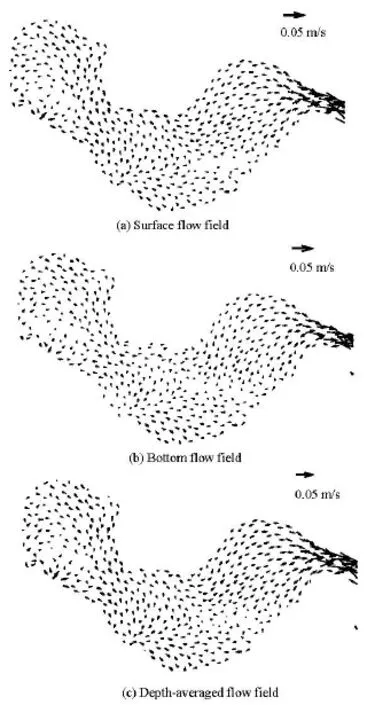
Fig.6 Simulated results of gravitational flow
2.1.2 Flow field under the prevailing wind in summer
As stated by Tu et al.[1], in the area of Chaohu Lake, the southeast wind is prevailing in summer and it is the northeast wind in winter. In order to study the characteristics of the typical flow field in the lake, the flow field under the prevailing wind in summer is simulated, which takes the river discharge and the wind force into account at the same time. The wind speed is 2.7 m/s, the average wind speed observed in Mushan Station in 2012. And a similar study will be presented in the next section regarding to the flow field under the prevailing wind in winter.

Fig.7 Typical flow field under summer prevailing wind
As shown by Fig.7, the wind-induced motion dominates most area of the lake, where the water flows towards the downwind side at a speed in the range of 0.01 m/s to 0.05 m/s at the surface layer and flows towards the southeast direction at a speed in the range of 0.015 m/s to 0.025 m/s at the bottom. While in thearea around Chaohu Sluice, the water in all depths flows towards east because of the sluice’s discharging water. Five local circulations exist at the depth-average flow field. The locations are the northeast part of the western lake, the southwest part of the western lake, the area around Zhongmiao-Mushan, the estuary of Zhefu River and the estuary of Zhao River. The two reverse circulations at the western lake are combined to form a current at the northwest corner, which flows into the eastern lake through the north of Mushan. The velocity of the current is between 0.012m/s and 0.02 m/s. Two counter-clockwise circulations exist in the area around Zhongmiao-Mushan and the estuary of Zhefu River. And a clockwise circulation exists near the estuary of Zhao River. Because all circulations are local ones and no global circulation exists, the flow field is not favorable for the water exchange in the lake. This is also the reason why there is a great difference in the water quality between the western and the eastern lakes.
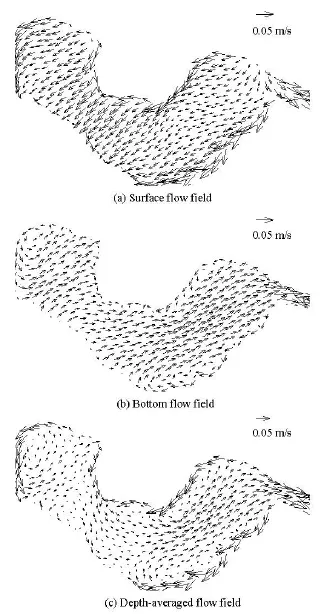
Fig.8 Typical flow field under winter prevailing wind
In all, the flow field in Chaohu Lake is dominated by the wind-induced motion, especially in the western lake and the west part of the eastern lake. In the east part of the eastern lake, the flow is the combination of the wind-induced motion and the gravitational flow.
2.1.3 Flow field under the prevailing wind in winter
The typical flow field under the prevailing wind in winter is simulated and the results are shown in Fig.8. The wind speed is 2.7 m/s and the wind direction is northeast. Under the average wind speed, most parts of the lake are dominated by the wind-induced flow. The water flows southwest at the surface layer with a velocity between 0.01 m/s and 0.05 m/s while the water flows in the opposite direction as a compensation current at the bottom layer with a smaller velocity of between 0.01 m/s and 0.025 m/s. There are four circulations in the depth-average flow field, in the northwest part of the western lake, the estuary of Hangbu River, the area around Zhongmiao and the estuary of Zhao River. A current is formed at the eastern lake, which flows from the southwest direction to the northeast direction and finally towards the sluice. As there is a counter-clockwise circulation at the northwest part of the western lake, the water exchange between the area and the other place is not easy and the northwest part of the western lake becomes the most severely polluted area.
In both the typical flow fields of summer and winter, one or two local circulations exist in the western lake. The local circulation is not favorable for the water exchange and the nutrient transport between two half lakes, thus the quality of the water in the western lake is much worse than that in the eastern lake. Besides, circulations exist in the area around Zhongmiao under both situations, which hinders the nutrient from being exchanged with the outside water and makes the pollution gather heavily in that place. On the other side, a current is formed at the eastern lake under these two typical conditions. The current flows from the southeast direction to the northwest direction and further towards the sluice, thus it promotes the water exchange in the area.
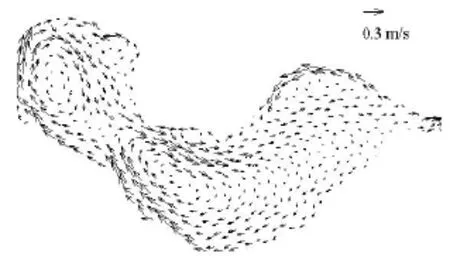
Fig.9 Flow field under extreme windspeed of 10.3 m/s
2.2 Flow fields under special situations
2.2.1 Flow field under extreme wind speed in summer
In order to examine the flow pattern at the extreme wind speed, the 90th percentile wind speed recorded by Mushan Station in 2012, i.e. 10.3 m/s, is used to simulate the depth-averaged flow field of the windinduced current. The simulated results (Fig.9) show that there still exist two circulations in the southwest part and the northeast part of the western lake. The southwest circulation, occupying 2/3 of the western lake, is larger than that formed under the average wind speed, while the northeast circulation is smaller. The circulations in the area around Zhongmiao and the estuary of Zhefu River still exist. And a new large local circulation appears in the west part of the eastern lake. From the above results, it can be inferred that local circulations would be formed for both the average and extreme wind speeds, and will hamper the water exchange with other areas.
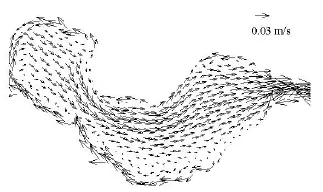
Fig.10 Flow field under design discharge rate of 1 370 m3/s
2.2.2 Flow field with design discharge rate of Chaohu Sluice
The design discharge rate of Chaohu Sluice,1 370 m3/s, is used to study the influence of the discharge rate on the flow field. The results are shown in Fig.10. Similar to Fig.7(c) with a discharge rate of 500 m3/s, five circulations exist in the depth-average flow field, in the northeast part of the western lake,the southwest part of the western lake, the estuary of Zhao River, the area around Zhongmiao and the estuary of Zhefu River, respectively. However, the current, which is formed at the northwest corner and flows from the western lake to the eastern lake, become stronger with a larger discharge rate. It further flows towards the Chaohu Sluice after entering the eastern lake. The velocity of the current reaches 0.015 m/s-0.03m/s while it is just 0.01 m/s-0.02 m/s when the discharge rate is 500 m3/s. The two local circulations still exist in the western lake, but they are smaller compared with those in Fig.7(c). Instead, the current is much stronger and the water exchange is quicker.
2.3 Response of flow to wind
As mentioned above, the flow in Chaohu Lake is dominated by the wind-induced motion. The magnitude and the direction of the wind velocity determine the magnitude and the direction of the flow. Thus, we further investigate how the flow field responds to the wind. Based on this analysis, the basic characteristics of the flow field in the lake can be deduced if the wind speed is known. Here, the flow field in the lake is simulated by using the wind speed collected at Mushan Station during 2012, with a sampling cycle of 1 h. Also, we use the runoff data of Fengle-Hangbu River and Chaohu Sluice during 2012 in the simulation, for the runoff of other rivers are comparatively small and can be neglected.
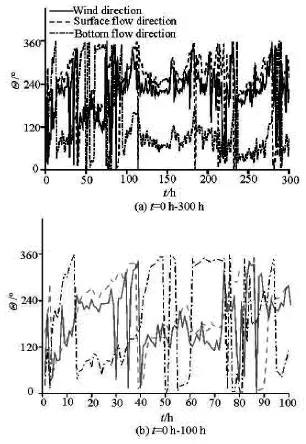
Fig.11 Response of surface flow direction to wind direction
We choose a specific point in the middle of the western lake, far away from the boundary and with the same flow characteristics as most part of the lake. We define the north direction as 0oand the angle increases clockwisely.θw(t),θs(t)and θb(t)denote the direction of the wind, the surface flow and the bottom flow at timet, respectively. Figure 11 shows the relationship between the flow’s direction and the wind’s direction. It can be seen that the unsteady direction of the surface flow is very close to the wind’s direction. While the difference between the wind’s direction and the unsteady direction of the bottom flow is close to180o. Also, it is found that the change of the flow’s direction is more stable than the change of the wind’s direction, as shown in Fig.11(b). For example, at around the 30th h, 35th h and 80th h, the wind’s direction experiences three cycles, which represents obvious changes of the wind’s direction. However, the moving directions of the flow at these three periods do not change as significantly as the wind’s directions.
Besides, from the 40th h to the 41st h,θw(t)increases from13oto 121oand then remains stable for about 5 h. With such a sustained change, from the 40th h to the 44th h,θis 19o,28o,94o,128oands143o, and remains stable at around 143o, meanwhile,θis 174o,250o,267o,300oand 328o, and rebmains stable at around335o. It implies that with a sustained change of the wind’s direction, the flow responds to the input and remains stable after about 4 h. Thus, the necessary condition of the change of the flow’s direction is the continuous effect of the changed wind’s direction, and a sudden change of the wind direction, such as the impulse input as stated above, cannot leads to a significant change of the flow’s direction. The change of the flow is smoother than that of the wind and it lags behind the change of the wind for about 4 h.

Fig.12 Response of surface flow velocity to wind speed
The relationship between the magnitude of the flow velocity and the magnitude of the wind speed is shown in Fig.12. It illustrates that the magnitude of the flow velocity is very sensitive to the change of the wind speed. An impulse in the wind speed, even though just for 1 h to 2 h, can cause a corresponding change of the flow velocity. Besides, the velocity of the surface flow is a little bit larger than the velocity of the bottom flow.
The cross spectrum is used to analyze the relationship between the wind speed and the velocity of the surface and bottom flows. The correlations of the wind speed and the velocity of the surface flow and the velocity of the bottom flow are 0.993 and 0.989,respectively, which indicates strong correlations. Besides, the phase-difference of the surface flow and the wind is 27.2owhile the phase-difference of the bottom flow and the wind is196.5o, which means the time of response is 4.5 min and 32.7 min, respectively and the surface flow responds faster than the bottom flow to the wind.
3. Conclusions
The FVCOM is used to study the hydrodynamic characteristics in Chaohu Lake. The main conclusions are as follows:
(1) The flow field in Chaohu Lake is a combination of the wind-induced current and the gravitational flow. The wind-induced flow is much stronger than the gravitational flow in most area and the wind force is the main driving force. Only in the estuary of Zhefu River and the area around Chaohu Sluice, the gravitational flow is comparable with the wind-induced flow.
(2) In the typical flow fields under the prevailing wind, most area is dominated by the wind-induced flow, except the area around the sluice. The water flows towards the downwind side at the surface while towards the opposite side as a compensation flow at the bottom. In the area around Chaohu Sluice, the water flows from west to east at all depths because of the sluice’s discharging water. In the depth-average flow field, there exist five circulations in the lake under the southeast wind. Among them, two reverse circulations exist in the western lake. And four circulations exist in the depth-average flow field under the northeast wind, including one circulation at the northwest part of the western lake. Local circulations at the western lake are not favorable for the water exchange between two half lakes.
(3) Under the extreme wind speed of 10.3 m/s of the southeast wind, two reverse circulations are formed at the western lake, which is unfavorable for the water exchange with other areas. With the discharge rate of 1 370 m3/s, two smaller circulations exist at the western lake. And a stronger current is formed flowing from west to east, accelerating the water exchange in the lake.
(4) The time series of velocity in the lake is closely related with the wind force. The flow at the surface has the same direction as the wind, while it is in the opposite direction at the bottom. The flow’s direction changes more smoothly than the wind direction. But the flow velocity is very sensitive to the wind speed.
Acknowledgements
The authors would like to thank the China Meteorological Data Sharing Service System for offering the historical wind data at Hefei Station and Chaohu Station, and the automatic monitoring network of Anhui Province for the wind data at Mushan Station. This work was supported by the Special Foundation(Class D) of “Hundred Talents Program” of Chinese Academy of Sciences.
References
[1] TU Qing-ying, GU Ding-xi and YIN Cheng-qing et al. Eutrophication in Chaohu Lake[M]. Hefei, China: University of Science and Technology of China Press,1990(in Chinese).
[2] WANG Hua-ke, TANG Hong-bing. Study of the effect of ecological diversions for Chao Lake to improve the rivers and lakes’ exchange relations[J]. China Water Resources, 2010, (23): 27-29(in Chinese).
[3] LIU Wei. Eutrophication tendency and its prevention and control strategy in the east part of Chao Lake[J]. Journal of Chaohu College, 2008, 10(3): 100-103(in Chinese).
[4] XIE Ping. Reading about the histories of cyanobacteria, eutrophication and geological evolution in Lake Chaohu[M]. Beijing, China: Science Press, 2009(in Chinese).
[5] MARCE R., FEIJOO C. and NAVARRO E. et al. Interaction between wind-induced seiches and convective cooling governs algae distribution in a canyon-shaped reservoir[J]. Freshwater Biology, 2007, 52(7): 1336-1352.
[6] CHEN Yuan-ying, LIU Qing-quan. On the horizontal distribution of algal-bloom in Chaohu Lake and its formation process[J]. Acta Mechanica Sinica, 2014, 30(5): 656-666.
[7] XU Xu-feng, LIU Qing-quan. Numerical study on the characteristics of wind-induced current in Taihu Lake[J]. Chinese Journal of Hydrodynamics, 2009, 24(4): 512-518(in Chinese).
[8] GAO Y., XU X. F. and LIU Q. Q. Numerical study on the distribution characteristics of TP in Taihu Lake,China[J]. Disaster Advances, 2010, 3(4): 560-562.
[9] WANG J., SHEN Y. and GUO Y. Seasonal circulation and influence factors of the Bohai Sea: A numerical study based on Lagrangian particle tracking method[J]. Ocean Dynamics, 2010, 60(6): 1581-1596.
[10] WANG Chao, SHEN Chao and WANG Pei-fang et al. Modeling of sediment and heavy metal transport in Taihu Lake, China[J]. Journal of Hydrodynamics,2013, 5(3): 379-387.
[11] MORALES L., FRENCH J. and BURNINGHAM H. Hydrodynamic modelling of small upland lakes under strong wind forcing[C]. European Geosciences Union General Assembly 2012.Vienna, Austria, 2012, 14: 567.
[12] BEARDSLEY R. C., CHEN C. and XU Q. Coastal flooding in Scituate (MA): A FVCOM study of the 27 December 2010 nor'easter[J]. Journal of Geophysical Research: Oceans, 2013, 118(11): 6030-6045.
[13] XUE P., CHEN C. and QI J. et al. Mechanism studies of seasonal variability of dissolved oxygen in Mass Bay: A multi-scale FVCOM/UG-RCA application[J]. Journal of Marine Systems, 2013, 131: 102-119.
[14] GE J., DING P. and CHEN C. et al. An integrated East China Sea-Changjiang Estuary model system with aim at resolving multi-scale regional-shelf-estuarine dynamics[J]. Ocean Dynamics, 2013, 63(8): 881-900.
[15] ZHAO Qiao-hua, SUN Ji-hua and ZHU Guang-wei. Simulation and exploration of the mechanisms underlying the spatiotemporal distribution of surface mixed layer depth in a large shallow lake[J]. Advances in Atmospheric Sciences, 2012, 29(6): 1360-1373.
[16] BELETSKY D., HAWLEY N. and RAO Y. R. Modeling summer circulation and thermal structure of Lake Erie[J]. Journal of Geophysical Research: Oceans,2013, 18(11): 6238-6252.
[17] BAI X. Z., WANG J. and SCHWAB D. J. et al. Modeling 1993-2008 climatology of seasonal general circulation and thermal structure in the Great Lakes using FVCOM[J]. Ocean Modelling, 2013, 65: 40-63.
[18] CHEN C., BEARDSLEY R. C. and COWLES G. An unstructured grid, finite-volume coastal ocean model(FVCOM) system[J]. Oceanography, 2006, 19(1): 78-89.
[19] THOMA M., GROSFELD K. and MAYER C. Modelling mixing and circulation in subglacial Lake Vostok,Antarctica[J]. Ocean Dynamics, 2007, 57(6): 531-40.
[20] LIU Zhao-wei, CHEN Yong-can and LI Ling et al. Sigma-coordinate numerical model for side-discharge into natural rivers[J]. Journal of Hydrodynamics,2009, 21(3): 333-340.
[21] JIANG Y., WAI O. W. Drying-wetting approach for 3D finite element sigma coordinate model for estuaries with large tidal flats[J]. Advances in Water Resources,2005, 28(8): 779-92.
[22] JIN K. R., JI Z. G. and HAMRICK J. H. Modeling winter circulation in Lake Okeechobee, Florida[J]. Journal of Waterway, Port, Coastal, and Ocean Engineering, 2002, 128(3): 114-125.
[23] TANG Lu-lu, WANG Peng and YAO Qi. Three-dimensional numerical simulation of current, waves and sediment transport in Taihu Lake[J]. Water Resources Protection, 2011, 27(2): 1-5(in Chinese).
10.1016/S1001-6058(15)60534-0
(March 7, 2014, Revised August 3, 2014)
* Biography: CHEN Yuan-ying (1988-), Female, Master
LIU Qing-quan,E-mail: qqliu@imech.ac.cn

- 水动力学研究与进展 B辑的其它文章
- Classification of flow regimes in gas-liquid horizontal Couette-Taylor flow using dimensionless criteria*
- MHD flow of a visco-elastic fluid through a porous medium between infinite parallel plates with time dependent suction*
- Polymer flow through water- and oil-wet porous media*
- Hydrodynamics and modeling of a ventilated supercavitating body in transition phase*
- Numerical analysis of the unsteady behavior of cloud cavitation around a hydrofoil based on an improved filter-based model*
- Thermal instability and heat transfer of viscoelastic fluids in bounded porous media with constant heat flux boundary*