
Spectroscopic flow evaluation of nonequilibrium CO2-Ar plasma flow in an arc-jet facility
2015-12-23 07:11GenkiNISHIDAGoujiYAMADAHiromitsuKAWAZOE
材料与冶金学报 2015年1期
Genki NISHIDA,Gouji YAMADA,Hiromitsu KAWAZOE
(4-101 Minami,Koyama,Tottori,680-8552,JAPAN)
Recently,Mars explorations have been proposed as future space missions all over the world.For the success of these missions,Mars entry flight is main concerned.Spacecraft receive severe heat loads due to the aerodynamic heating during atmospheric entry flights.Therefore the development of a thermal protection system (TPS)is required to protect spacecraft from the aerodynamic heating during atmospheric entry flights.Heat tests using an arc-heated wind tunnel have been conducted for the development of a thermal protection system.To improve the accuracy of the heat tests,the characterization of the test flows is necessary.Most of such investigations have dealt with air plasma flow,considering earth entry flights.Because the Mars atmosphere consists of 95.7% CO2,2.7% N2,and 1.6% Ar by volume[1],a carbonaceous gas needs to be considered as a test gas.Recently,spectroscopic measurements were conducted to investigate characteristics of the arc-heated plasma flow using CO2and CO2-N2mixture as test gases[2].In this study,the temperature distribution along the stagnation streamline around a blunt body was obtained by a spectrum fitting technique.However,error bars for the vibrational temperatures of C2are too large due to the effect of background continuum radiation unresolved in the measured spectrum.Therefore,the thermochemical state of CO2arc plasma flows has not been yet clarified.The effect of background continuum radiation should be reduced for better clarification.Park et al[3,4].proposed the area intensity method and applied it to the flow evaluation of air arc plasma flows.The effect of background continuum radiation could be successfully reduced and the temperature distribution around a blunt body was obtained with high accuracy clarifying the thermochemical state of air arc plasma flows.The area intensity method can be a useful way to characterize CO2arc plasma flows.However,the method has not been applied yet to the flow evaluation of CO2plasma flows.
In this study CO2-Ar mixture is used as a test gas because the addition of Ar into test gas is essential for providing a stable arc plasma flow,and for avoiding erosion of electrodes[5].The purpose of this study is to characterize CO2-Ar arc plasma flows by applying the area intensity method.
1 Experimental Setup
Figure 1 shows a schematic drawing of the arc-heated wind tunnel used in this study.This facility is composed of the hollow-electrode type arc heater,working gas supply,a convergent-divergent nozzle for hypersonic flow,a test chamber,a vacuum tank,and a spectroscopic measurement system.The arc heater consists of hollow-type cathode and anode electrodes connected to a convergent-divergent nozzle.The electrodes and nozzle are independently cooled by cooling water.The designed Mach number of the nozzle is calculated to be approximately 5 for CO2on the assumption that flow is isentropic.The test section is located just after the nozzle which is attached to the end of the anode.A disk model made of copper is placed in the centerline of the plasma flow to generate a shock wave.The spectroscopic measurement system is composed of a quartz convex lens,a spectrometer (Andor,SR303i),a bundle optical fiber and a charge-coupled device (CCD)camera (Andor,DU920OP-OE).The radiation from the stagnation streamline is focused by a convex lens on the collecting surface of the optical fiber.On the collecting surface,10 fibers elements are aligned at 1.0 mm intervals,so that radiation from ten locations can be collected at a time.The spectroscopic measurement system using the bundle optical fiber enables us to observe a spatial profile of emission spectra along the stagnation streamline around the disk model with high accuracy.
Table 1 shows the test condition in this study.A mixture of CO2-Ar is used as a test gas with the respective volume flow rate of 4 L/min and 20 L/min.The initial pressure of the test chamber is 13.33 Pa.The arc-heated wind tunnel is operated with 9.0 kW input power.
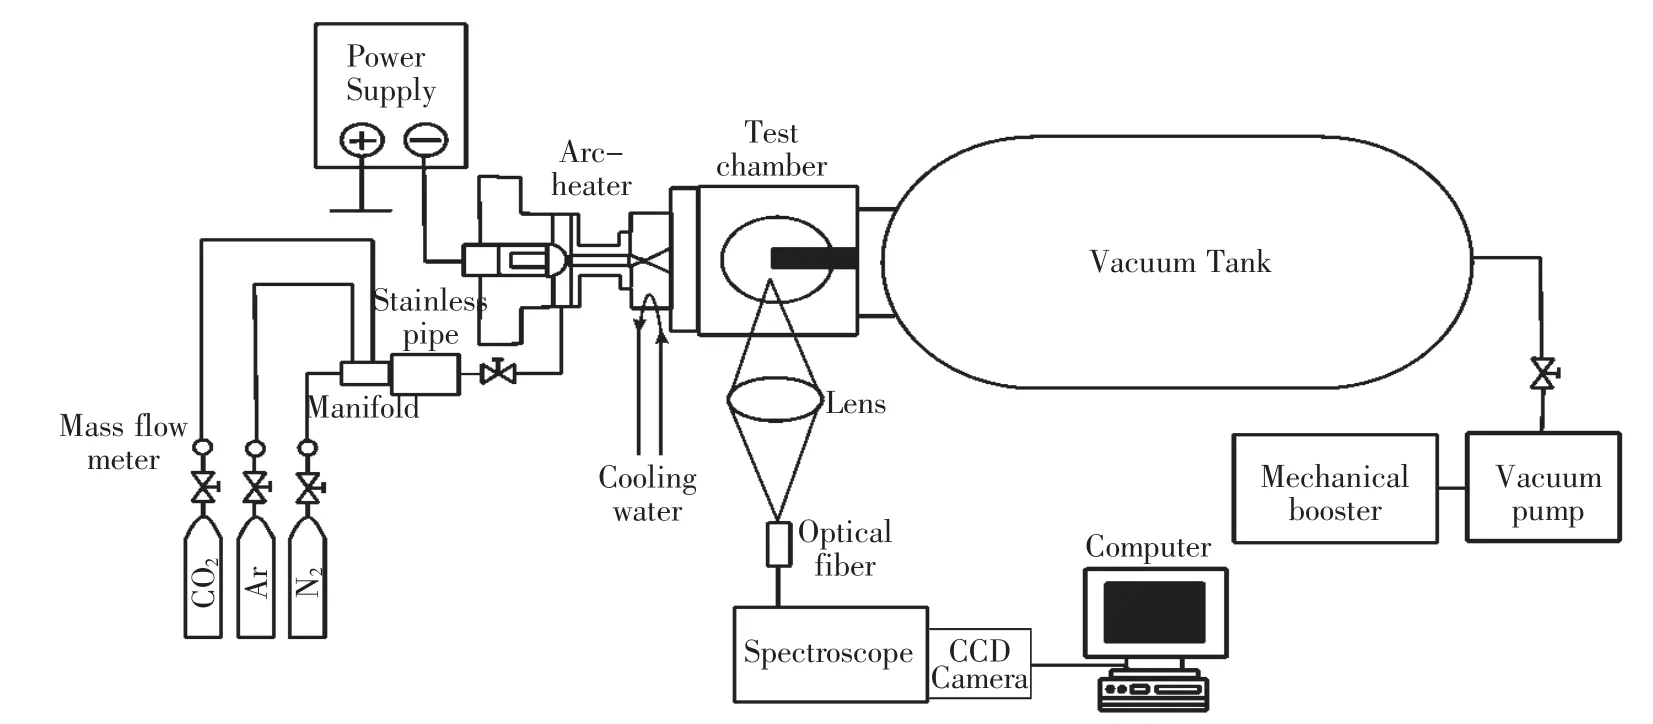
Fig.1 Schematic drawing of the arc-heated wind tunnel

Table 1 Test condition
2 Results and discussion
2.1 Measured spectrum
Figures 2 (a)and (b)show an example of the measured spectra of the CO2-Ar plasma in the free stream and shock layer,respectively.These spectra are assembled from six spectra obtained at different center wavelengths.In both spectra,C2Swan bands are predominant and the intensity is too high in the visible region.Background continuum radiation overlaps with the radiation from C2Swan bands.Atomic lines of Cu are seen in the near ultraviolet region.This is because the electrode made of copper is partially melted and vaporized by the arc heating.However,the intensity is too low.The three major vibrational sequences of C2Swan bands can be seen and the vibrational sequence of Δv=1 is the most intense.Other molecular and atomic spectra are not observed and overlapped with C2Swan bands.In the shock layer,the effect of background continuum radiation is considered to be small because the vibrational sequences of C2Swan bands can be seen more clearly.From Figs.2 (a)and (b),it is found that C2is a strong radiator in the CO2-Ar plasma flow.In addition,higher vibrational levels tend to have a non-Boltzmann distribution.Therefore,the Δv=0 sequence of C2Swan bands is used for the temperature evaluation in this study.
2.2 Temperature Evaluation Method
Figure 3 shows the high-resolution spectrum for the Δv=0 sequence of the C2Swan bands using a 1 200-lines/mm grating.Three bandheads of(0,0),(1,1)and (2,2)are clearly identified by referring to standard tables of molecular spectra[6].Atomic lines of Cu overlap with C2spectrum.However (0,0),(1,1)and (2,2)bandheads of C2can been clearly resolved.The temperatures are estimated by the use of these bandheads.To estimate rotational and vibrational temperatures from measured spectra of C2Swan bands,a spectrum fitting method[2]was applied in past studies.However,error bars for the vibrational temperature of C2were too large due to the effect of background continuum radiation unresolved in the measured spectrum.To solve this problem,the temperature evaluation is conducted by applying the area intensity method to the C2Swan bands in this study.In this method,the ratio of the integrals over the wavelength in certain regions are used and correlated with the temperatures using SPRADIAN2[7].Then,the ratios obtained from the measured spectra are used to determine the rotational and vibrational temperatures based on the correlations.Figure 4 shows area ranges of the bandheads used to estimate the rotational and vibrational temperatures.The area ratio W2/W1 is used to estimate the rotational temperature while the area ratio W3/W1 is used to estimate the vibrational temperature.The area baseline is taken from the minimum value near the bandheads instead of the absolute zero of the emission intensity to reduce the influence of the background continuum radiation.First,the correlations between temperatures and area ratios are obtained by calculating theoretical spectra using SPRADIAN2.Figure 5 shows the correlation between the rotational temperature Trand the area ratio W2/W1 of theoretical spectra.The rotational temperature can be determined by correlating the measured area ratio with the curve in this figure.For the measured spectrum in Figure 3,the rotational temperature is determined to be 3300 K with the area ratio W2/W1 of 0.302.Figure 6 shows the area ratio W2/W1 as a function of vibrational temperature for three different rotational temperatures.Clearly,the area ratio W2/W1 is a very weak function of the vibrational temperature while that is sensitive to the rotational temperature.Therefore,the area ratio is a reliable indicator of the rotational temperature.Figure 7 shows the correlation between the vibrational temperature Tv and the area ratio W3/W1 of theoretical spectra.For the measured spectrum in Figure 3,the vibrational temperature is determined to be 9 600 K with the area ratio W3/W1 of 0.461.By applying this method to the measured spectra obtained at other locations,the spatial distribution of the rotational and vibrational temperatures is obtained along the stagnation streamline around the disk model.

Fig.2 Measured spectrum of CO2-Ar plasma

Fig.3 Measured spectrum of C2 Swan Δv=0 band
2.3 Spatial Distribution of Temperatures
Figure 8 shows the spatial distribution of the rotational and vibrational temperatures.In this figure,circle marks represent the rotational temperature and square marks represent the vibrational temperature.The vibrational temperature is significantly higher than the rotational temperature in the free stream.This is due to the vibrational nonequilibrium process.In the free stream,the translational temperature decreases because the arc-heated plasma flow is expanded by the nozzle.Since the relaxation time between translation and vibration modes is very long compared to that between translation and rotation modes,the vibrational temperature is higher than the rotational temperature in the free stream.In the shock layer,small variations of rotational and vibrational temperatures can be seen.The rotational temperature increases by about 1000 K while the vibrational temperature decreases by about 1000 K.Since the translational temperature increases due to the formation of shock wave,the rotational temperature increases in the shock layer.Energy exchange between translation and vibration modes is activated in the shock layer,resulting in the decrease of the vibrational temperature.However,the vibrational temperature is still higher than the rotational temperature,indicating that the vibrational relaxation process is not completed.From the present result,it is found that the thermochemical state of the CO2-Ar arc plasma flow is in the vibrational nonequilibrium state along the stagnation streamline around the disk model and the vibrational relaxation process in the shock layer is faster than that in the free stream.
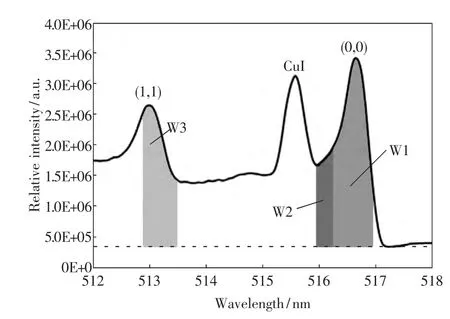
Fig.4 Area range for temperature estimation
3 Conclusion

Fig.5 Correlation between the rotational temperature Tr and the area ratio W2/W1

Fig.6 Dependence of area ratio W1/W2 on temperatures
In this study,spectroscopic measurements of CO2-Ar arc plasma flow are conducted using a hollow electrode arc heated wind tunnel.In the CO2-Ar plasma,C2Swan bands are predominant and the intensity is too high in the visible region.Background continuum radiation overlaps with the radiation from C2Swan bands.However,the effect of background continuum radiation is smaller in the shock layer than in the freestream.Temperature evaluation of CO2arc plasma flow is conducted by the area intensity method and the temperature distribution is obtained along the stagnation streamline around the disk model.In the free stream,the vibrational temperature is much higher than the rotational temperature due to the vibrational nonequilibrium process.In the shock layer,rotational temperature increases by about 1000 K due to the formation of shock wave while the vibrational temperature decreases by about 1000 K.Energy exchange between translation and vibration modes is activated in the shock layer,showing the decrease of the vibrational temperature.However,the vibrational temperature is still higher than the rotational temperature,indicating that the vibrational relaxation process is not completed.In conclusion,the thermochemical state of the CO2-Ar arc plasma flow is in the vibrational nonequilibrium state along the stagnation streamline around the disk model.
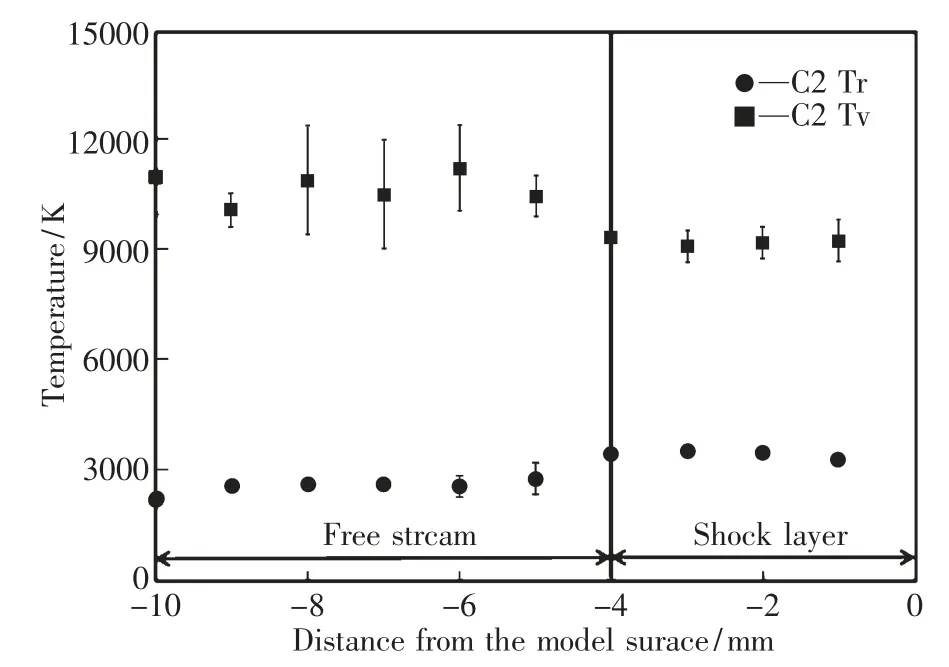
Fig.8 Spatial distribution of temperatures
This work was supported by the Grant- in-Aid for Young Scientists (B)(No.23760770),provided by the Japan Society for the Promotion of Science.
[1]Park C,Howe J T,Jaffe R L.Review of chemical-kinetic problems of future NASA missions,II:Mars Entries[J].Journal of Thermophysics and Heat Transfer,1994,8 (1):January-March.
[2]Yamada G,Otsuta S,Matsuno T,et al.Temperature measurements of CO2and CO2-N2plasma flows around a blunt body in an arc-heated wind tunnel,trans[J].JSASS Aerospace Tech Japan,2013,11 :87-91.
[3]Park C S,Newfield M E,Fletcher D G,et al.Spectroscopic measurements of shock- layer flows in an arcjet facility[J].Journal of Thermophysics and Heat Transfer,1999,13(1):January-March.
[4]Park C S,Newfield M E,Fletcher D G,et al.Spectroscopic emission measurements within the blunt-body shock layer in an arcjet flow[J].Journal of Thermophysics and Heat Transfer,1998,12(2):April-June.
[5]Schönemann A T,Auweter-Kurtz M,Habiger H A,et al.Analysis of the argon additive influence on a nitrogen arcjet flow[J].Journal of Thermophysics and Heat Transfer,1994,8(3):July-Sept.
[6]Pearse R W B ,Gaydon A G.The identification of molecular spectra[J].Chapman and Hall,1976.
[7]Fujita K,Mizuno M,Ishida K,et al.Spectroscopic flow evaluation in inductively coupled plasma wind tunnel[J].Journal of Thermophysics and Heat Transfer,2008,22 (4):685-694.
