
北半球夏季海洋性大陆区域气候与EP型ENSO:直接与间接联系
2016-06-22 02:55方陆俊管兆勇王美夏阳
大气科学学报 2016年3期
方陆俊,管兆勇,王美,夏阳
① 南京信息工程大学 气象灾害教育部重点实验室,江苏 南京 210044;② 南京信息工程大学 气象灾害预报预警与评估协同创新中心,江苏 南京 210044;③ 杭州市气象局,浙江 杭州 310051
北半球夏季海洋性大陆区域气候与EP型ENSO:直接与间接联系
方陆俊①②③,管兆勇①②*,王美①②,夏阳①②
① 南京信息工程大学 气象灾害教育部重点实验室,江苏 南京 210044;② 南京信息工程大学 气象灾害预报预警与评估协同创新中心,江苏 南京 210044;③ 杭州市气象局,浙江 杭州 310051
2013-04-27收稿,2013-06-28接受
国家自然科学基金资助项目(41330425);公益性行业(气象)科研专项(GYHY20140624)
摘要利用1979—2009年的NECP资料、Hadley海温月平均资料和CMAP降水资料,采用Kao and Yu(2009)的方法定义了夏季EP型ENSO指数EPI,用合成分析的方法分析了东部型ENSO与海洋性大陆降水的关系。结果表明:EPI与MC(Maritime Continent,海洋性大陆)区域降水变化间存在非常弱的负相关。造成这一弱相关的原因是EPI与MC区域降水在某些年份存在同号变化。在剔除Ni�o4信号后,海洋性大陆区域降水序列与EPI与存在着同号和反号两种关系。反号关系是通常所认为的,当经典的El Ni�o(La Ni�a)发生时MC区域降水出现显著地减少(增多)。此时,沿赤道的异常Walker环流建立了EP型ENSO与MC区域气候间的直接联系。而在同号关系时,菲律宾以东异常加热和SPCZ区域异常冷却引起的西北—东南走向的垂直环流圈削弱了MC区域与赤道东太平洋之间的异常Walker环流所建立的直接联系,或者说,赤道东太平洋区域SSTA与MC区域降水异常的形成是通过SPCZ区域SST的反号异常而产生间接联系的。这种机制的揭示为深刻认识ENSO影响海洋性大陆区域甚至东亚地区气候变动的联系提供了新的线索。
关键词
海洋性大陆
降水异常
东部型ENSO
事件
SPCZ
北半球夏季
海洋性大陆(MC,Maritime Continent)区域(90~150°E,10°S~20°N)位于热带地区,由若干岛屿和浅海组成,具有独特的气候特征(Ramage,1968)。这一热带海洋性气候区域从海洋环流上阻挡了热带太平洋与印度洋的联系但又从大气环流上将它们联系了起来(吴国雄和孟文,1998;Alexander et al.,2002)。MC区域受到太平洋信号和印度洋信号的影响,是Walker环流上升支所在区域,与亚洲季风和澳洲季风活动均存在着密切关联(Chang et al.,2005;唐卫亚和孙照渤,2005)。同时,此区域天气气候变化还与ITCZ和SPCZ活动包括热带气旋和季风低压活动存在着密切联系(祝从文和何敏,1998)。
海洋性大陆区域气候变动与ENSO有着重要的联系。研究表明,MC区域气候与El Nio和南方涛动(South Oscillation)具有较高的相关(Lau and Chan,1983)。当El Nio(La Nia)发生时,海洋性大陆区域降水偏少(偏多)(Ramage,1968);在北半球夏季和秋季,印度尼西亚降水与赤道东太平洋的海温异常有着很强的负相关(Haylock and McBride,2001;Hendon,2003);当赤道中东太平洋出现ENSO事件时,那里的SST异常升高,其上空有较强的对流活动,而对流区的东移使得西太平洋暖池出现异常的大气下沉运动,形成了异常的Walker环流,导致海洋性大陆、澳大利亚及周边国家出现干旱(Feng et al.,2010)。
20世纪80年代以前,ENSO事件多出现在赤道东太平洋冷舌区,但Yeh et al.(2009)指出在全球变暖背景下ENSO循环发生显著变化。此后,人们发现ENSO事件开始频繁出现于赤道中太平洋海域(Ashork et al.,2007;Kao and Yu,2009;Yeh et al.,2009;Feng and Li,2011;冯娟等,2010),由此带来的气候影响也与传统ENSO事件的影响有着明显的差异。Ashok et al.(2007)根据赤道太平洋SST异常纬向三极型分布,设计了EMI指数来表征中部型SST异常事件。对于绝大多数事件而言,Nio3区具有较好的代表性(李晓燕和翟盘茂,2000),但是对于一些事件中,Nio1+2区升温较强,而Nio3区升温较弱。另外,Nio3指数中还包含了中部型的信号,所以Nio3指数并不能很好地表征东部型ENSO。Trenberth and Stepaniak(2001)提出了TNI指数并结合Nio3.4指数来监测和追踪ENSO。Ren and Jin(2011)将Nio3和Nio4指数进行非线性变换,得到一组新指数CTI和WPI来描述两类ENSO。而Kao and Yu(2009)利用回归分析方法得到热带太平洋海表温度场中与Nio4区海温变化无关的残差部分,进而对残差场进行EOF分析,取其第一主分量和时间系数分别作为东部型ENSO事件的标准EOF模和标准指数,同时还定义了中部型ENSO指数。
然而,因ENSO存在不同的分布型,使MC区域气候与ENSO的关系变得复杂起来。目前研究ENSO与MC区域气候关系时,要么未将东部型和中部型ENSO区分开来,要么选用的方法和指数如Nio3指数并不能很好地将东部型或中部型事件从整个ENSO事件中分离出来。就东部型而言,其与海洋性大陆区域气候变动的关系如何,尚不清楚。
综上所述,尽管ENSO与海洋性大陆区域气候变动的关系已有研究,但是,对于东部型和中部型ENSO与MC区域气候联系的研究并不多见。本文将采用Kao and Yu(2009)提出利用年平均海温异常求取指数的方法,求取夏季的东部型指数并进而探讨北半球同时期夏季东部型ENSO变化规律以及其与夏季海洋性大陆区域气候的联系。
1资料和方法
采用的资料有:1)美国国家环境预报中心/大气研究中心(NCEP/NCAR)的逐月再分析资料(Kalnay et al.,1996),主要包括水平分辨率为2.5°×2.5°的全球范围网格点的风场、湿度场、温度场;2)英国Hadley中心水平分辨率为1°×1°的月平均海温资料;3)CMAP提供的2.5°×2.5°的月平均降水资料。考虑到NECP/NCAR资料自1979年以后更为可靠(Kalnay et al.,1996),所选时段取为1979—2009年。夏季平均指6—8月三个月的平均。
主要采用了合成分析、线性回归、EOF等统计分析方法。为了揭示大气环流变化与MC加热异常变化及其与相应的非绝热加热强迫之间的关系,这里还计算了大气视热源

(1)
Qs+

(2)
而
(3)
其中:L为凝结潜热;Pr为降水量;Qs为地面感热输送;E为气柱中云滴的蒸发量;C为气柱中水汽凝结所致的液态水生成量;Es为地面潜热输送;

图1 东部型(a)和中部型(b)ENSO事件的EOF空间模态及其时间序列(c)(Kao and Yu,2009)Fig.1 Leading EOF patterns obtained from a combined EOF-regression analysis respectively for (a)EP-type ENSO and (b)CP-type ENSO;The normalized time series of coefficients of the leading EOFs are displayed in (c),with open bars for CPI and closed bars for EPI
2东部型ENSO指数与典型年份选取
EPI和CPI指数能够较好地区分东部型和中部型ENSO。采用Kao的做法(Kao and Yu,2009),针对北半球1979—2013年逐年夏季(6—8月)平均的海温距平,给出了东部型(EP)和中部型(CP)ENSO的EOF空间模态,以及EP和CP指数(EPI和CPI)的指数标准化时间序列(图1)。可以看出,东部型ENSO(图1a)事件的偏暖(冷)区位于赤道东太平洋冷舌区,最大偏暖(冷)中心位于赤道140°W以东。对于中部型(图1b)事件,其偏暖(冷)中心位于140°W以西地区,大致位于日界线附近。从两者夏季的指数时间序列(图1c)可看出,某些事件属明显的东部型或中部型,但某些事件则既具有东部型又具有中部型特征,EPI与CPI相关系数为-0.30。
要说明的是,尽管ENSO事件多数在北半球冬季时达到最强,但有部分ENSO事件在夏季仍具有较强的信号,这种赤道太平洋地区较大强度的SSTA可被看成是ENSO循环过程中表现在赤道太平洋地区的强信号。因此,尽管有些年份EPI数值相对较小,但夏季的EPI仍可被当成是用来描写ENSO的指数。
对于EP型ENSO,由于海温异常显著区域与MC区域的距离明显较CP型的远(图1a、b),这使得EP型ENSO与MC区域降水间的关系显得更为复杂。计算表明,MC区域平均降水RMC时间序列与EPI的相关系数为-0.14。这与人们通常认为的当El Nio(La Nia)发生时,MC区域降水显著负(正)异常并不一致。这种不一致的形成原因可能比较复杂。比如,ENSO的发展年和衰减年SSTA对其周围气候的不同影响可能会造成EPI指数与MC地区降水的相关性不高,或者中太平洋或SPCZ区域存在显著的与东太平洋区域相反符号的较强的热力强迫,等等。
注意到,在EPI指数的定义中采用线性回归的方法滤除了Nio4区域平均SSTA的影响(Kao and Yu,2009),故这里在计算夏季海洋性大陆降水时间序列时也需采用类似的方法,即在RMC中滤除Nio4信号的影响,以得到不含有Nio4信号的降水序列MC。图2给出了夏季EPI指数和夏季海洋性大陆降水MC)时间序列。由图2可知,EPI与MC均具有显著的年(代)际变化。尽管EPI与MC的相关系数有所增大,达-0.33,但二者并没有表现出我们通常认为的显著的反位相关系。这一结果再次表明了人们长期认为的当El Nio(La Nia)事件发生时,MC区域会出现干旱(洪涝)的现象并不显著地出现在东部型ENSO事件发生时。然而,我们注意到,根据图2,当剔除那些同号的年份后,MC区域降水与EPI的相关是很高的,达到了-0.77,这说明那些同号年份事件的出现对EP型ENSO与MC区域夏季降水的关系存在显著的干扰。

图2 夏季EPI指数(柱状)与夏季海洋性大陆降水(曲线)时间序列(柱状红色表示同号事件(PP和NN),柱状蓝色表示反号事件(PN和NP);曲线表示的是滤除Nino4信号后的夏季MC区域降水时间序列MC)Fig.2 The normalized time series of EPI(bars) and anomalous precipitation MC over the MC(curve) in boreal MC is obtained by removing the Nio4 signal from the rainfall anomalies [red (blue) bars indicate the same (opposite) signed value events for EPI and MC precipitation anomalies]


EPIRMC同反号年份PEPPRPP1983,1987,2011NEPNRNN1988,2003,2007PEPNRPN1982,1997,1998,2008NEPPRNP1990,1994,1995,2001,2002,2004,2013
3影响机制
为揭示东部型ENSO对海洋性大陆区域气候变动产生影响的机制,可对异常降水、速度势、海温、视热源、非绝热加热等基于表1所列年份进行合成差值分析。如无特别说明,在下文分析中,所有物理量时间序列中的Nio4信号均已先行滤除(采用线性回归的方法)。
3.1降水异常

3.2环流异常
为进一步了解东部型ENSO发生时在海洋性大陆出现两种不同符号的降水异常事件的成因,给出了针对同号事件和反号事件的异常海温场以及异常海表面风场合成差值。从同号年合成差值(图4a)可见,异常的海温主要位于赤道东太平洋地区(100~120°W,10°S~10°N)和南太平洋辐合带(140°E~180°~160°W,10~30°S)这两个区域。当赤道东太平洋海温为暖异常时,南太平洋辐合带地区则存在显著的冷异常。这样的海温配置有利于形成海表面风场在赤道东太平洋的辐合,并在南太平洋辐合带区域(SPCZ)出现反气旋性环流和辐散气流。这种SPCZ地区较冷的SSTA异常与赤道东太平洋地区SSTA暖异常间形成补偿性大气质量输送和垂直环流。同时,在SPCZ与西太平洋暖池及MC之间,由于SPCZ区域SSTA较冷,易于形成西北—东南走向的垂直环流。这种变化将削弱本应在MC区域与赤道东太平洋之间的异常反Walker环流。在反号年,显著异常的海温只出现在赤道东太平洋地区(80~120°W,10°S~10°N)(图4b),在SPCZ区域冷海温异常较弱。赤道东太平洋海温异常偏暖,在海洋性大陆与赤道东太平洋之间可易于形成异常Walker环流。这种Bjerkness机制下的环流异常可解释当这类EP型ENSO事件出现时,MC区域将出现降水的负异常。

图3 EPI高低值年海洋性大陆区域降水异常的合成差值(单位:mm/d;阴影区表示通过了0.1信度的t-检验)a.同号(PP-NN)事件;b.反号(PN-NP)事件Fig.3 Composite differences of precipitation anomalies (units:mm·d-1) in the MC region between high-and low-value events of EPI for (a)same-signed years (PP-NN) and (b)opposite-signed years (PN-NP)(shaded areas are values at and above the 90% confidence level using a t-test)

图4 EPI高低值年SSTA及海表面异常风场的合成差值(单位:m/s;阴影区表示SSTA通过了0.1信度的t-检验;矩形区表示MC区域) a.同号(PP-NN)事件;b.反号(PN-NP)事件Fig.4 Composite differences of SSTA between high-and low-value events of EPI for (a)same-signed years (PP-NN) and (b)opposite-signed years(PN-NP)(shading indicates SSTA at and above the 90% confidence level using a t-test;the rectangular frame denotes the MC region)

图5 同号(PP-NN)事件EPI高低值年速度势、辐散辐合风场、垂直环流的合成差值(图a、b中打点区域表示速度势通过了0.1信度的t-检验;图c中阴影区域表示垂直速度通过了0.1信度的t-检验) a.850 hPa速度势和辐合辐散风场;b.200 hPa速度势和辐合辐散风场;c.垂直环流Fig.5 Composite differences of anomalous velocity potential(shaded contours) and winds at (a)850 hPa and (b)200 hPa between high-and low-value events of EPI for same-signed years(PP-NN)(shading with stipples indicates anomalous velocity potential at and above the 90% confidence level using a t-test);(c)Anomalous vertical circulation,with shading for vertical velocity at and above the 90% level of confidence using a t-test
上列结果亦可从垂直环流的变化中清楚地看到。图5给出了同号年夏季850 hPa和200 hPa速度势和辐合辐散风合成差值场(图5a、b)以及相应的异常纬向环流(图5c)。可见,在日期变更线以西的热带南太平洋存在一个显著的辐散中心(图5a),而明显的辐合则出现在热带西北太平洋和热带中东太平洋。在200 hPa上,则与低层相反,在菲律宾以东出现明显的辐散运动而在SPCZ处存在辐合。这些无旋运动的分布明显不同于经典ENSO发生时热带尤其是赤道上空的大气运动特征。印度尼西亚南部在850 hPa上的向菲律宾以东地区的辐散和在对流层上层在印尼群岛南部的辐合构成了局地垂直环流圈,所以引起了印尼群岛以北降水偏多。与辐散运动一致,沿赤道的垂直环流圈中不能清楚地看到自东太平洋至MC区域完整的异常Walker环流的日界线以东的上升和140°E以西的下沉。
然而,与同号年不同的是,反号型的合成结果显示了经典型ENSO与MC区域间大气运动的联系。由图6可见在赤道东太平洋区域低层存在辐合,高层存在辐散,在MC区域低层辐散而在高层辐合(图6a、b),在赤道上空存在非常完整的反Walker环流异常(图6c)。此时赤道东太平洋地区降水增多,而MC区域则降水明显偏少。
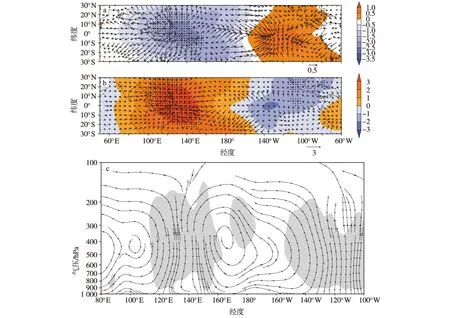
图6 反号(PN-NP)事件EPI高低值年速度势、辐散辐合风场、垂直环流的合成差值(图a、b中打点区域表示速度势通过了0.1信度的t-检验;图c中阴影区域表示垂直速度通过了0.1信度的t-检验) a.850 hPa速度势和辐合辐散风场;b.200 hPa速度势和辐合辐散风场;c.垂直环流Fig.6 Composite differences of anomalous velocity potential(shaded contours) and winds at (a)850 hPa and (b)200 hPa between high-and low-value events of EPI for opposite-signed events years(PN-NP)(shading with stipples indicates anomalous velocity potential at and above the 90% confidence level using a t-test);(c)Anomalous vertical circulation,with shading for vertical velocity at and above the 90% level of confidence using a t-test
3.3加热异常
环流异常的形成与大气所受的热力强迫异常有关。对于同号情况而言,在MC区域的北侧即菲律宾到关岛地区有正的大气视热源异常(图7a),大气受到异常的加热上升,在菲律宾以东区域出现降水的正异常。而印度尼西亚地区出现明显负视热源异常,且在南太平洋SPCZ区域出现狭长的负值区,大气受到冷却而下沉。这有利于在SPCZ区域及其西南侧的对流层低层形成异常反气旋性环流(Gill,1980),在赤道东太平洋表现出弱的正视热源异常。
对于反号情形,赤道东太平洋存在较强的视热源加热(图7b),而在MC区域,负的视热源异常显著,负的中心位于MC区域的东北侧,大气受到冷却并下沉,不利于降水在该地区发生。而在SPCZ区域未见90%信度下显著的视热源负异常,相反,在SPCZ北侧还出现了视热源的正异常,大气受热上升。
前述公式(2)和(3)中包含了潜热释放对气柱加热的影响,若扣除这一影响,可凸显气柱受到下垫面加热异常及气柱对净辐射吸收的程度,亦即
反号时,在MC地区主要为非绝热加热的负异常(图8b),负的异常中心位于MC区域的东北侧。这样的非绝热加热场配置导致对流层底层辐散、高层辐合,不利于降水在MC区域生成。

图7 EPI高低值年视热源(Q1)的合成差值(单位:W/m2;阴影区表示通过了0.1信度的t-检验;矩形区表示MC区域) a.同号(PP-NN);b.反号(PN-NP)Fig.7 Composite differences of anomalous apparent heating Q1(units:W·m-2) between high-and low-value events of EPI for (a)same-signed years(PP-NN) and (b)opposite-signed years(PN-NP)(shading indicates values at and above the 90% confidence level using a t-test;rectangular frame indicates the MC region)
为了进一步了解上述加热异常下SPCZ区域与MC区域的联系,这里给出了SPCZ区域中心(170°E,15°S)到MC区域中心(135°E,5°N)连线上在同号和反号时垂直环流异常的合成差值(图9)。如图9a显示,在同号时,在MC与SPCZ之间存在完整的垂直环流圈。MC区域位于上升区,低层辐合、高层辐散,有利于降水在MC区域发生;而SPCZ区域则位于下沉区,低层辐散、高层辐合,不利于异常降水的发生。而在反号情形下,均出现下沉气流,这与同号情况完全不同。综上,SPCZ区域异常冷却与菲律宾以东异常的加热而导致的垂直环流改变和削弱了EP型EL Nio与MC区域间由Walker环流建立的直接联系。
4结论
基于Kao and Yu(2009)的方法可计算出北半球夏季EPI/CPI指数,其能较好地区分东部型和中部型ENSO,但注意到EPI与CPI在统计上并不完全独立,其相关系数为-0.30。
区域表现为降水的负异常,负值中心位于泰国、柬埔寨、南海地区和菲律宾地区。

图8 EPI高低值年非绝热加热(Q1-Q2)的合成差值(单位:W/m2;深色(浅色)阴影区域表示通过了0.1信度的t-检验;矩形区表示MC区域) a.同号(PP-NN);b.反号(PN-NP)Fig.8 Composite differences of anomalous net apparent heating Q1-Q2(units:W·m-2) between high-and low-value events of EPI for (a)same-signed years(PP-NN) and (b)opposite-signed years (PN-NP)(shading indicates values at and above the 90% confidence level using a t-test;rectangular frame indicates the MC region)

图9 EPI高低值年SPCZ区域到MC区域环流的合成差值(箭矢表示由辐散风向斜向平面投影的分量与异常垂直速度的合成;等值线表示异常的垂直速度,单位:10-3 hPa/s) a.同号(PP-NN);b.反号(PN-NP)Fig.9 Composite differences of the slanted anomalous vertical circulation from the Philippines southeastward to the SPCZ region between high-and low-value events of EPI for (a)same-signed years(PP-NN) and (b)opposite-signed years(PN-NP)[arrows are for winds composed of anomalous vertical velocity and divergent wind components projected onto the slanted plane from the SPCZ northwestward to the Philippines;contours are for vertical velocity anomalies (×10-3 hPa·s-1),which are artificially enlarged before plotting)
致谢:南京信息工程大学地球科学部南京大气资料服务中心提供了资料服务;NCEP/NCAR再分析资料取自NOAA-CIRES Climate Diagnostics Center(http://www.cdc.noaa.gov);文中诸图均用GrADS软件绘制。
参考文献(References)
Alexander M A,Bladé I,Newman M,et al.2002.The Atmospheric Bridge:The influence of ENSO teleconnections on air-sea interaction over the global oceans[J].J Climate,15(16):2205-2231.
Ashok K,Behera S K,Rao S A,et al.2007.El Nio Modoki and its possible teleconnection[J].J Geophys Res,112(C11):C11007.doi:10.1029/2006JC003798.
Chang C P,Wang Z,McBride J,et al.2005.Annual cycle of Southeast Asia—Maritime continent rainfall and the asymmetric monsoon transition[J].J Climate,18(2):287-301.
Feng J L,Li J.2011.Influnce of Elnino Modoki on spring rainfall over south China[J].J Geophys Res,116,D13102.doi:10.1029/2010JD015160.
Feng J L,Wang W,Chen C S,et al.2010.Different impacts of two types of pacific ocean warming on the Southeast Asian rainfall during Boreal Winter[J].J Geophys Res,115,D24122.doi:10.1029/2010JD014761.
冯娟,管兆勇,王黎娟,等.2010.夏季热带中太平洋SST异常型与中国东部夏季气候异常的关系[J].大气科学学报,33(5):547-554.Feng J,Guan Z Y,Wang L J,et al.2010.The summer in the tropical Pacific SST anomaly type relationship with summer climate anomalies in the east of China[J].Trans Atmos Sci,33(5):547-554.(in Chinese).
Gill A.1980.Some simple solutions for heat-induced tropical circulation[J].Quart J Roy Meteor Soc,106(449):447-462.
Haylock M,McBride J.2001.Spatial coherence and predictability of Indonesian wet season rainfall[J].J Climate,14(18):3882-3887.
Hendon H H.2003.Indonesian rainfall variability:Impacts of ENSO and local air-sea interaction[J].J Climate,16(11):1775-1790.
Kalnay E,Kanamitsu M,Kistler R,et al.1996.The NCEP/NCAR 40-year reanalysis project[J].Bull Amer Meteor Soc,77(3):437-471.
Kao H Y,Yu J Y.2009.Contrasting eastern-Pacific and central-Pacific types of ENSO[J].J Climate,22(3):615-632.
Lau K M,Chan P H.1983.Short-term climate variability and atmospheric teleconnections from satellite-observed outgoing longwave radiation.Part II:Lagged correlations[J].J Atmos Sci,40(12):2751-2767.
李晓燕,翟盘茂.2000.ENSO事件指数与指标研究[J].气象学报,58(1):102-109.Li X Y,Zhai P M.2000.On indices and indicators of ENSO episodes[J].Acta Meteorological Sinica,58(1):102-109.(in Chinese).
Luo H,Yanai M.1984.The large-scale circulation and heat sources over the Tibetan Plateau and surrounding areas during the early summer of 1979.Part II:Heat and moisture budgets[J].Mon Wea Rev,112(5):966-989.
Ramage C S.1968.Role of a tropical “maritime continent” in the atmospheric circulation[J].Mon Wea Rev,96(6):365-370.
唐卫亚,孙照渤.2005.印度洋海温偶极振荡对东亚环流及降水影响[J].大气科学学报,28(3):316-322.Tang W Y,Sun Z B.2005.SST in the Indian Ocean dipole oscillation influence on east Asian circulation and precipitation[J].Trans Atmos Sci,28(3):316-322.(in Chinese).
Trenberth K E,Stepaniak D P.2001.Indices of El Nio evolution[J].J Climate,14(8):1697-1701.
吴国雄,孟文.1998.赤道印度洋—太平洋地区海气系统的齿轮式耦合和ENSO事件Ⅰ.资料分析[J].大气科学,22(4):470-480.Wu G X,Meng W.1998.Gearing between the indo-monsoon circulation and the pacific-walker circulation and the ENSO.Part Ⅰ:Data analyses[J].Chin J Atmos Sci,22(4):470-480.(in Chinese).
Yeh S W,Kug J S,Dewitte B,et al.2009:El Nio in a changing climate[J].Nature,461:511-514.doi:10.1038/nature 08316.
祝从文,何敏.1998.热带环流指数与夏季长江中下游旱涝的年限变化[J].大气科学学报,21(1):15-22.Zhu C W He M.1998.Tropical circulation index and the middle and lower reaches of the Yangtze river in summer drought and flood of change[J].Trans Atmos Sci,21(1):15-22.(in Chinese).
ENSO is the strongest interannual variability in our climate system.It has profound impacts on global climate.Since El Nio-Modoki was revealed in 2007,more and more efforts have been made in the climate community to investigate the different types of ENSO events and their influences.Those different ENSO events are known as the EP-type(Eastern Pacific-type) and CP-type(central Pacific-type) ENSO.Following established methodology,we adopt the EP-type ENSO index(EPI) for boreal summer in the present paper.By employing methods including composite analysis,linear regression,and EOF decomposition,we investigate the simultaneous relationships between EP-type ENSO and precipitation anomalies in the Maritime Continent(MC) by using the monthly mean data from the NECP/NCAR reanalysis,global SST data from the Hadley Center,and CAMP monthly mean precipitation data for the period 1979—2013.
The results demonstrate that EPI and CPI in boreal summer are able to describe the main features of EP-type and CP-type ENSO,respectively,although the EPI and CPI are not perfectly independent of each other in a statistical sense because the correlation coefficient of EPI with CPI was found to be 0.30.During some years,EPI is relatively smaller.But,the spatial pattern of anomalous SST still looks like EP-type ENSO.In these years,the anomalous precipitation averaged over the MC region is negative.Usually,we expect a strong negative correlation between canonical ENSO and rainfall anomalies in Indonesia.However,we find that the time series of the regional mean precipitation anomaly over the MC is weakly correlated with the EPI.These results are inconsistent with one another.
By examining the anomalous circulations case by case,we find that this weak correlation is induced by some co-occurrences of the EP-type El Nio(La Nia) with more(less) than normal rainfall in the Indonesian region in some years.After removing the Nio4 signal from SST anomalies,we find that both the SST anomaly(SSTA) and rainfall anomalies are independent of the Nio4 signal.The EPI independent of Nio4 is calculated.Then,the co-occurrences of positive EPI with positive anomalous rainfall in the MC can still be observed in some years.By performing composite analyses,we found that there are two mechanisms that link the SSTAs in the eastern equatorial Pacific to precipitation anomalies in the MC region.One is canonical,which is characterized by the anomalous Walker circulation with its ascending(descending) branch over the east equatorial Pacific and the descending(ascending) branch over the MC region in years when EP-type El Nio(La Nia) events occur.We refer to this as the direct connection mechanism.The other is quite different from the direct connection mechanism.When an EP-type El Nio event occurs in certain years,significant anomalous heating is observed in both the MC and the region east of the Philippines,and significant anomalous cooling in the South Pacific Convergence Zone(SPCZ),respectively.These two anomalous diabatic forcing centers force the atmosphere to respond,inducing a northwest—southeast vertical circulation bridging these two centers,which anomalously weakens the descent of the atmosphere in the MC and intensifies the descending motion in the SPCZ,resulting in the anomalous Walker circulation along the equator being stopped in the SPCZ east of 160°E.In this way,positive anomalous rainfall events occur in the MC when the EPI is positive.This anomalous northwest-southeast vertical circulation,with its upward motion branches over the MC and the region east of the Philippines,and a downward motion branch over the SPCZ,connects the EP-type ENSO-induced Walker circulation,with its downward motion over the SPCZ and upward motion over the east equatorial Pacific.The anomalous adiabatic forcing in the SPCZ is crucial in interfering with the influences of EP-type ENSO on rainfall variations in the MC region.This linkage of EP-type ENSO with rainfall anomalies in the MC via anomalous forcing in the SPCZ is referred to as the indirect connection mechanism,in relation to EP-type ENSO with rainfall variations in the MC.
The results in the present paper are highly meaningful in terms of improving our understanding of the mechanisms behind the relationships of ENSO with climate variations in the MC region,and even in East Asia.
Maritime Continent;EP-type ENSO;precipitation anomalies;SPCZ;boreal summer
(责任编辑:张福颖)
Influences of Eastern Pacific-type ENSO on climate variations over the Maritime Continent region:Direct and indirect connections
FANG Lujun1,2,3,GUAN Zhaoyong1,2,WANG Mei1,2,XIA Yang1,2
1KeyLaboratoryofMeteorologicalDisaster,MinistryofEducation(KLME),NanjingUniversityofInformationScience&Technology,Nanjing210044,China;2CollaborativeInnovationCenteronForecastandEvaluationofMeteorologicalDisasters,NanjingUniversityofInformationScience&Technology,Nanjing210044,China;3HangzhouMeteorologicalBureau,Hangzhou310051,China
doi:10.13878/j.cnki.dqkxxb.20130427001
引用格式:方陆俊,管兆勇,王美,等.2016.北半球夏季海洋性大陆区域气候与EP型ENSO:直接与间接联系[J].大气科学学报,39(3):289-299.
FangLJ,GuanZY,WangM,etal.2016.InfluencesofEasternPacific-typeENSOonclimatevariationsovertheMaritimeCon-tinentregion:Directandindirectconnections[J].TransAtmosSci,39(3):289-299.doi:10.13878/j.cnki.dqkxxb.20130427001.(inChinese).
*联系人,E-mail:guanzy@nuist.edu.cn
猜你喜欢
海洋通报(2021年3期)2021-08-14
海洋通报(2021年1期)2021-07-23
应用气象学报(2020年6期)2020-10-28
高原山地气象研究(2020年3期)2020-07-16
青少年科技博览(中学版)(2020年1期)2020-04-21
文萃报·周二版(2019年33期)2019-09-10
奥秘(创新大赛)(2019年4期)2019-04-15
中国医学伦理学(2019年8期)2019-01-16
中学数学研究(广东)(2017年15期)2017-09-03
奥秘(2015年3期)2015-09-10
