
龙岩市降水时空分布及趋势研究
2016-06-22 02:52邓丽萍陈红菊张燕珊张红梅陈洋麟
大气科学学报 2016年3期
邓丽萍,陈红菊,张燕珊,张红梅,陈洋麟
① 漳平市气象局,福建 龙岩 364400;② 龙岩市永定区气象局,福建 龙岩 364100;③ 龙岩市气象局,福建 龙岩 364000
龙岩市降水时空分布及趋势研究
邓丽萍①*,陈红菊①,张燕珊②,张红梅③,陈洋麟①
① 漳平市气象局,福建 龙岩 364400;② 龙岩市永定区气象局,福建 龙岩 364100;③ 龙岩市气象局,福建 龙岩 364000
2013-08-18收稿,2013-12-23接受
国家自然科学基金资助项目(41375137);高原大气与环境四川省重点实验室开放课题(PAEKL-2014-C4);江苏省气象科学研究所北极阁基金(BJG201304);气象灾害省部共建教育部重点实验室(南京信息工程大学)开放课题(KLME1205);2014年江苏省高等学校大学生创新创业训练计划项目(201410300001Z)
摘要利用龙岩市1960—2013年7个国家级气象站的逐日降水资料,采用 Mann-Kendall 趋势和突变检验法及Morlet 小波功率谱分析方法,分析龙岩市降水的时空分布规律。结果表明,龙岩市年降水量呈微弱增加趋势,年际波动振幅较大。年降水量多年平均值为1 641 mm,最小值出现在1991年(1 139.9 mm),最大值则出现在1975年(2 286.9 mm),年降水时间序列存在显著的2~8 a的周期。降水主要集中在春季,春季降水量占全年降水量的38.2%左右,其次是夏季和秋季,冬季降水量最少,仅占全年降水量的11.5%。1—6月月平降水量呈现增长趋势,8—12月呈现递减趋势。北部和南部年降水量整体变化趋势基本一致,南部地区总体小于北部地区,只有极个别年份南部地区降水量大于北部地区。
关键词
降水量
时空分布
M-K检验
大量研究表明,全球气候系统正在变暖,其中降水的时空分布也发生变化,降水量在高纬度大部分地区增加,中纬度大部分地区减少(施能等,2003)。降水变化的研究主要集中于降水的时空变化特征。国外学者相继研究日降水量、降水日数、日极端降水等的变化趋势(Moberg and Jones,2005)及不同时间尺度下降水的空间变化分布规律(Baigorria et al.,2007)。De Jongh et al.(2006)利用比利时Uccle站点105 a(1898—2002年)的降水资料,采用小波分析方法,分别对该地区年、月和季节降水变化进行了研究。Narisma et al.(2007)应用小波分析方法分析了全球20世纪降水的区域突变。潘敖大等(2011)分析了长江三角洲1961—2006年降水的时空变化趋势,发现46 a间年降水量没有明显的变化趋势,但降水的季节分配有所变化,冬、夏季降水量呈现显著上升趋势,秋季降水量明显下降,春季没有明显变化。李明刚等(2012)分析了近50 a来华东地区各类极端降水事件的强度和发生频次的年代际变化。结果表明:华东地区极端降水事件年代际变化特征明显。近20 a来,不论是极端降水事件的平均强度还是发生次数都要明显高于前30 a。陈海山等(2009)利用中国419个测站1958—2007年逐日降水资料集,分析了近50 a中国不同区域年和季节极端降水事件的基本变化特征。
龙岩市位于福建省西南部(115°51′~117°45′E,24°23′~26°02′N),总面积19 052 km2,其中山地1 496 km2,丘陵3 101 km2,平原985 km2。境内武夷山脉南段、玳瑁山、博平岭等山脉沿东北—西南走向,大体呈平行分布,地势东高西低、北高南低。研究龙岩市降水时空分布规律,对防灾减灾,提高抵抗自然的能力具有积极的意义。
1资料和方法
1.1资料选取与区域划分
选取龙岩市7个观测站1960—2013年均一性较好的逐日降水观测资料,个别缺测时段运用回归分析方法进行订正。根据研究需要,将龙岩市分为两个部分,分别为:龙岩北部、龙岩南部。龙岩北部地区由长汀、上杭、连城和武平四个站作为代表站,龙岩南部由新罗、永定和漳平三个站作为代表站。分别从龙岩北部、龙岩南部两个不同区域分析降水的空间分布规律。
1.2研究方法
采用Mann-Kendall非参数检验(陈亚宁等,2009;刘亚龙等,2010;于文金等,2012)分析方法,包括突变检验和长期趋势检验,用于降水量在时间序列上突变检测和长期趋势分析。依据小波变换和小波功率谱的理论(崔锦泰,1997;Torrence and Compo,1998)对龙岩市54 a来的年降水量、各个季节降水量以及龙岩北部、南部地区年降水变化在时间序列上进行多尺度特征分析。为减小误差,获得更加准确的结果,建立相应的影响锥去除边界效应对于降水周期特征的影响,并对得到的降水周期特性进行了0.05信度的高斯白噪声检验(江静和钱永甫,2000;孙卫国等,2005)。
2结果分析
2.1时间分布及变化
2.1.1年际降水量变化
由图1可见,1960—2013年龙岩市降水量呈微弱增加趋势,年际波动振幅比较大。年降水量多年平均值为1 641 mm,最小值出现在1991年(1 139.9 mm),最大值则出现在1975年(2 286.9 mm),其他年份年降水都在1 600 mm上下浮动。从年降水量的5 a滑动平均来看,龙岩市年降水量从20世纪60年代初到70年代初呈减少趋势,70年代初期到中期呈现增长趋势,70年代中期到80年代初期呈现下降趋势,其他时段的变化趋势比较平缓。年降水趋势线系数为1.7,表明龙岩市年降水总体变化趋势为平均每10 a增加17 mm左右,增长趋势不是很明显,没有通过0.05显著水平的M-K趋势检验。

图1 1960—2013龙岩市年降水量变化(单位:mm)Fig.1 Annual precipitation(mm) in Longyan,1960—2013

图2 1960—2010 年龙岩市年降水量小波功率谱分析(粗实线区域通过0.05信度的显著性检验)Fig.2 Morlet wavelet analysis of annual precipitation in Longyan,1960—2013 (regions with a phase difference exceeding the 0.05 significance level are encircled by bold lines)
由1960—2010 年龙岩市降水量小波功率谱分析(图2)可见,龙岩市年降水时间序列存在显著的2~8 a的周期,其次是显著的准3 a和准4~6 a的周期,并通过0.05信度的显著性检验。准3 a周期的谱值在70年末期到90年代初期及1995较强,而准4~6 a周期的谱值在2000—2010年较强,其他年份较弱。
2.1.2季节降水量变化
本文以每年3—5月为春季,6—8月为夏季,9—11月为秋季,12月至次年2月为冬季来划分四季。从降水的季节变化来看(表1),降水主要集中在春季,春季降水量最大,占全年降水量的38.2%左右,其次是夏季和秋季,冬季降水量最少,仅占全年降水量的11.5%。由四季平均降水量年代际变化(图3)可以看出,1960—2013年龙岩市秋季降水呈下降趋势,但是从Mann-Kendall长期趋势检验看,春季和秋季降水都是呈现下降趋势,但都没有通过0.05信度的显著性检验;夏季和冬季降水量呈增长趋势,也都没有通过0.05信度的显著性检验,表明变化趋势不并明显。
表1龙岩市季节降水及变化趋势
Table 1Seasonal precipitation in Longyan

季节平均降水量/mm占全年百分比/%春627.938.2夏610.337.2秋215.113.1冬188.511.5

图3 1960—2013年龙岩市四季平均降水量年代际变化曲线(单位:mm)Fig.3 Seasonal precipitation(mm) and its interdecadal variation in Longyan

图4 1960—2013年龙岩市春(a)夏(b)秋(c)冬(d)季节降水量小波功率谱分析(粗实线区域通过0.05信度的显著性检验)Fig.4 Morlet wavelet analysis of seasonal precipitation in Longyan,1960—2013(regions with a phase difference exceeding the 0.05 significance level are encircled by bold lines) a.spring;b.summer;c.autumn;d.winter
由各季节降水量小波分析(图4)可见,春季降水量时间序列存在显著的准2~5 a和准4 a尺度周期,准2~5 a周期在20世纪60年代和80年代中期以及1995—2000年较强,其他年份较弱;准4 a周期在60年代中期和70年代中期至80年代中期较强,其他年份较弱。夏季降水量时间序列存在显著的准2~5 a、准3 a和准4~8 a尺度周期,且这些周期的强度随着时间变化,准2~5 a周期在1965年至1975年较强,其他年份较弱;准3 a谱在1990年代初至2010年代初期都很强;准4~8 a谱在1990年代中期及2010年代初期比较强,其他年份较弱。与此同时小波功率谱分析还检测出降水量在年际尺度上存在准8 a周期和准16 a以上的年际尺度周期,但是没有通过0.05显著水平检验。从秋季降水量小波功率谱可以看出,秋季降水量时间序列存在显著的准3 a和准4 a尺度周期,准3 a周期在1980—2010年较强,其他年份较弱;准4 a谱在70年代较强。与此同时小波功率谱分析还检测出降水量在年际尺度上存在准16 a以上的年际尺度周期,但是没有通过0.05显著水平检验。从冬季降水量小波功率谱可以看出,冬季降水量时间序列存在显著的准2~4 a、准5 a尺度周期,准2~4 a谱在1960—1965年、1975—2000年和2010年左右较强,其他年份较弱;准5 a谱在1960—1970年较强。

图5 龙岩市各月平均降水量分布(单位:mm)Fig.5 Distribution of monthly mean precipitation(mm) in Longyan
2.1.3月降水量变化
从月平降水量分布来看(图5),1—6月降水呈现增长趋势,8—12月呈现递减趋势。龙岩市降水主要集中在3—6月,即春季及夏季前期。降水量最多的是6月,降水量达284.6 mm,占全年总降水量的17.3%。降水量较少的在10、11、12月,分别占全年总降水量的3.2%、2.7%、2.4%。12月是月降水量最少的。

图6 龙岩市北部(a)和南部(b)地区年降水量(单位:mm)变化Fig.6 Annual precipitation(mm) in the (a)northern and (b)southern parts of Longyan
2.2空间分布及变化
为了更好地研究龙岩市降水空间分布规律,将龙岩市分为北部、南部两个地区,从两个地区年平均降水量分布(图6)来看,龙岩北部降水量波动比较大,平均降水量1 667.86 mm,降水量最大值出现在1975年(2 355.9 mm),最小值出现在1967年(1 163.1 mm)。由5 a滑动平均线可知,20世纪60年代到70年代初期、90年代中期到21世纪初期年降水量呈比较明显下降趋势,20世纪70年代初期到中期呈现上升趋势。根据M-K趋势检验,北部地区年降水量呈上升趋势,但没有通过95%的置信水平检验,说明趋势并不明显。南部地区在1961、1968、1975、1983、1991、2006年突变较大外,其他年份波动相对比较平缓。南部地区在1968年出现最小值(868.1 mm),1983年出现最大值(2 302.8 mm),两者都相差1 434.7 mm。从南部年降水的5 a滑动平均可以看出20世纪60年代、70年代中后期及20世纪90年代中后期至21世纪初期呈下降趋势,上升趋势比较明显的主要是1970—1975年、1985—1995年及2004—2008年。龙岩北部和南部整体变化趋势基本一致,南部地区年降水量总体小于北部地区,只有极个别年份南部地区降水量大于北部地区。
从龙岩北部和南部年降水量的小波功率谱(图7)可见,北部年降水量时间序列存在显著的准2~5 a、准3 a和准4~6 a周期,且这些周期的强度随着时间而变化,准2~5 a谱在1960—1975年、1990—2000年较强,其他年份较弱;准3 a在1965—1970年、1995年左右和2010年左右较强,其他年份较弱;准4~6 a在1995—2010年较强,其他年份较弱。与此同时小波功率谱分析还检测出降水量在年际尺度上存在准8 a周期和准16 a以上的年际尺度周期,但是没有通过0.05信度的显著性检验。南部年降水量时间序列存在显著的准2~4 a和准4~6 a周期,且这些周期的强度随着时间而变化,准2~4 a谱在1960—2000年较强,其他年份较弱;准4~6 a在2000—2010年较强,其他年份较弱。
由图8可见,春季北部降水量多于南部;夏季北部和南部降水量相当,没有明显地域差异;秋季北部和南部降水量都呈现下降趋势,但是北部降水量下降更明显;冬季北部降水量略大于南部。
通过对龙岩北部和南部的逐月降水量(图9)对比可见,1—6月和10—12月北部地区月降水量都多于南部地区,7、8、9月北部月降水量少于南部。北部和南部月降水最大值均发生在6月,分别为294.2 mm、271.8 mm;最小值均发生在12月,分别为42.9 mm、38.2 mm。
3结论
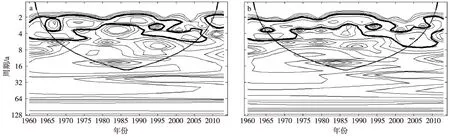
图7 龙岩北部(a)和南部(b)地区年降水量小波功率谱分析(粗实线区域通过0.05信度的显著性检验)Fig.7 Morlet wavelet analysis of annual precipitation in the (a)northern and (b)southern parts of Longyan (regions with a phase difference exceeding the 0.05 significance level are encircled by bold lines)

图8 龙岩北部、南部和全市各季节平均降水量(单位:mm)Fig.8 Seasonal average precipitation(mm) in northern and southern Longyan,and that of the whole city
受地理位置和季风气候不同的影响,龙岩市降水分布存在时空差异。根据龙岩市1960—2013年7个国家级气象站的逐日降水资料,在统计处理分

图9 龙岩北部、南部及全市各月降水量分布(单位:mm)Fig.9 Monthly precipitation(mm) in northern and southern Longyan,and that of the whole city
析的基础上,运用Mann-Kendall趋势和突变检验法及Morlet小波功率谱分析方法,分析全市及北部和南部时空分布规律及变化趋势,得到以下结论:
1)1960—2013年龙岩市年降水量呈微弱增加趋势,年际波动振幅比较大。年降水量多年平均值为1 641 mm,最小值出现在1991年(1 139.9 mm),最大值则出现在1975年(2 286.9 mm)。龙岩市年降水时间序列存在显著的2~8 a的周期,其次是显著的准3 a和准4~6 a的周期,并通过0.05信度的显著性水平检验。
2)龙岩市降水主要集中在春季,春季降水量最大,占全年降水量的38.2%左右,其次是夏季和秋季,冬季降水量最少,仅占全年降水量的11.5%。春季降水量时间序列存在显著的准2~5 a和准4 a尺度周期,夏季降水量时间序列存在显著的准2~5 a,准3 a和准4~8 a尺度周期,秋季降水量时间序列存在显著的准3 a和准4 a尺度周期,冬季降水量时间序列存在显著的准2~4 a、准5 a尺度周期。
3)龙岩市1—6月月平降水量呈现增长趋势,8—12月呈现递减趋势。
4)龙岩北部和南部年降水量整体变化趋势基本一致,南部地区总体小于北部地区,只有极个别年份南部地区降水量大于北部地区。1—6月和10—12月北部地区月降水量都多于南部地区,7、8、9月北部月降水量少于南部。
参考文献(References)
Baigorria G A,Jones J W,Obrien J J.2007.Understanding rainfall spatial variability in southeast USA at different time scales[J].Int J Climatol,27(6):749-760.
陈海山,范苏丹,张新华.2009.中国近50 a极端降水事件变化特征的季节性差异[J].大气科学学报,32(6):744-751.Chen H S,Fan S D,Zhang X H.2009.Seasonal differences of variation characteristics of extreme precipitation events over China in the last 50 years[J].Trans Atmos Sci,32 (6):744-751.(in Chinese).
陈亚宁,徐长春,杨余辉,等.2009.新疆水文水资源变化及对区域气候变化的响应[J].地理学报,64(11):1331-1341.Chen Y N,Xu C C,Yang Y H,et al.2009.Hydrology and water resources variation and its responses to regional climate change in Xinjiang[J].Acta Geographica Sinica,64(11):1331-1341.(in Chinese).
崔锦泰.1997.小波功率谱分析导论[M].西安:西安交通大学出版社:161-333.Cui J T.1997.An introduction to wavelets[M].Xi’An:Xi’An Jiaotong University Press:161-333.(in Chinese).
De Jongh I L M,Verhoest N E C,De Troch F P.2006.Analysis of a 105-year time series of precipitation observed at Uccle,Belgium[J].Int J Climatol,26(14):2023-2039.
江静,钱永甫.2000.南海地区降水的时空特征[J].气象学报,58(1):60-69.Jiang J,Qian Y F.2000.The geneal character of precipitation over the south China Sea[J].Acta Meteor Sinica,58(1):60-69.(in Chinese).
李明刚,管兆勇,韩洁,等.2012.近50 a华东地区夏季极端降水事件的年代际变化[J].大气科学学报,35 (5):591-602.Li M G,Guan Z Y,Han J,et a1.2012.Interdecadal changes of summer time precipitation extremes in East China in recent five decadal[J].Trans Atmos Sci,35 (5):591-602.(in Chinese).
刘亚龙,王庆,毕景芝,等.2010.基于Mann-Kendall 方法的胶东半岛海岸带归一化植被指数趋势分析[J].海洋学报,32(3):79-87.Liu Y L,Wang Q,Bi J Z,et al.2010.The analysis of NDVI trends in the coastal zone based on Mann-Kendall test:Acase in the Jiaodong Peninsula[J].Acta Oceanologica Sinica,32(3):79-87.(in Chinese).
Moberg A,Jones P D.2005.Trends in indices for extremes in daily temperature and precipitation in central and Europe,1901—99[J].Int J Climatol,25(9):1149-1171.
Narisma G T,Foley J A,Licker R,et al.2007.Abrupt changes in rainfall during the twentieth century[J].Geophys Res Lett,34(6),L06710.doi:10.1029/2006GL028628.
潘敖大,王珂清,曾燕,等.2011.长江三角洲近46 a气温和降水的变化趋势[J].大气科学学报,34(2):180-188.Pan A D,Wang K Q,Zeng Y,et al.2011.Trends of temperature and precipitation variation in the Yangtze River Delta from 1961 to 2006[J].Trans Atmos Sci,34 (2):180-188.(in Chinese).
施能,黄先香,杨扬.2003.1948—2000年全球陆地年降水量场趋势变化时、空特征[J].大气科学,27(6):972-982.Shi N,Huang X X,Yang Y.2003.Spatial characteristics of global land annual precipitation field trends during 1948—2000[J].Chinese J Atmos Sci,27(6):972-982.(in Chinese).
孙卫国,黄海仁,程炳岩.2005.NINO 海区冷暖事件的小波功率谱分析[J].热带气象学报,21(4):435-440.Sun W G,Huang H R,Cheng B Y.2005.Analysis on wavelet power spectrum of warm and cold events in the NIO regions[J].J Trop Meteor,21(4):435-440.(in Chinese).
Torrence C,Compo G P.1998.A practical guide to wavelet analysis[J].Bull Amer Meteor Soc,79(1):61-78.
于文金,阎永刚,邹欣庆.2012.太湖流域暴雨时空特征研究[J].自然资源学报,27(5):766-777.Yu W J,Yan Y G,Zou X Q.2012.Study on spatial and temporal characteristics of rainstorm in Taihu Lake Basin[J].Tournal of Natural Resources,27(5):766-777.(in Chinese).
Rainstorms are a major category of meteorological disaster,and thus research on their spatiotemporal distributions and trends is important in reducing or even preventing their adverse impacts.In this study,precipitation data gathered from meteorological observation stations over seven counties in Longyan during a 54-year period from 1960 to 2013 were used to study the spatial distribution characteristics of rainstorms.Further analysis was made by dividing the seven counties of Longyan into southern and northern counties.The main analytical methods used were the Mann-Kendall (M-K) method and Morlet wavelet power spectrum analysis [for the change or long-term trends of precipitation,and multi-scale analysis of the temporal (annual,seasonal,monthly) distribution of precipitation,respectively].
The results showed that the annual precipitation duration at seven meteorological observation stations had an increasing tendency during the 54-year time period,but this tendency was not statistically significant.An obvious change-point occurred around 1975,after which the annual precipitation increased by 101.2 mm.Moreover,based on the Morlet wavelet power spectrum analysis,the southern and northern counties had different significant time-scale cycles,as well as variation in the strength of cycle over time.The precipitation amount at the seven observation stations was greatest in spring,accounting for around 38.2% of the annual precipitation,followed by summer and autumn.However,each of the four seasons demonstrated distinct changes,and change ranges,in different years.For example,spring precipitation changed significantly around 1999,according to analysis using the M-K test,decreasing by 7.1% after that year.
Combined with the spatial distribution of rainfall duration,the precipitation over the northern counties was greater than that in the southern counties in spring and winter,less than that over southern counties in autumn,and nearly the same in summer.At the same time,however,neither the northern counties or southern counties showed a significant change in seasonal precipitation under the 95% confidence level.
Through further data analysis,it was found that the monthly precipitation over the seven meteorological observation stations had an increasing trend in the time period from January to June,and a decreasing trend in the time period from August to December.Monthly precipitation was concentrated from March to June (being greatest in June),amounting to 17.3% of the total precipitation in a year.Comparing the monthly precipitation between the northern and southern counties,it was clear that—except for the period from July to September—monthly precipitation in the northern counties was greater than that in the southern counties.
precipitation;spatiotemporal distribution;M-K test
(责任编辑:刘菲)
Study on the development of the spatiotemporal distributions and trends of rainstorms
DENG liping1,CHEN Hongju1,ZHANG Yanshan2,ZHANG Hongmei3,CHEN Yanglin1
1ZhangpingMeteorologicalBureau,Zhangping364400,China;2YongdingMeteorologicalBureauofLongyan,Longyan364100,China;3LongyanMeteorologicalBureau,Longyan364000,China
doi:10.13878/j.cnki.dqkxxb.20130818002
引用格式:邓丽萍,陈红菊,张燕珊,等.2016.龙岩市降水时空分布及趋势研究[J].大气科学学报,39(3):426-432.
DengLP,ChenHJ,ZhangYS,etal.2016.Studyonthedevelopmentofthespatiotemporaldistributionsandtrendsofrain-storms[J].TransAtmosSci,39(3):426-432.doi:10.13878/j.cnki.dqkxxb.20130818002.(inChinese).
*联系人,E-mail:470514055@qq.com
猜你喜欢
建材发展导向(2022年24期)2022-12-22
色谱(2022年5期)2022-04-28
海峡姐妹(2020年12期)2021-01-18
中国交通信息化(2018年7期)2018-09-14
商情(2017年12期)2017-05-19
中南大学学报(自然科学版)(2016年2期)2017-01-19
中国老区建设(2016年3期)2017-01-15
中成药(2016年8期)2016-05-17
红土地(2016年9期)2016-05-17
质量技术监督研究(2015年1期)2015-04-09
