
A parameter analysis of a two-phase flow model for supersaturated total dissolved gas downstream spillways*
2016-10-18 01:45HuixiaYANG杨慧霞RanLI李然RuifengLIANG梁瑞峰JuanWEI魏娟QinZHANG张沁
水动力学研究与进展 B辑 2016年4期
关键词:李然
Hui-xia YANG (杨慧霞), Ran LI (李然), Rui-feng LIANG (梁瑞峰), Juan WEI (魏娟),Qin ZHANG (张沁)
1. State Key Laboratory of Hydraulics and Mountain River Engineering, Sichuan University, Chengdu 610065,China, E-mail: bt-yanghuixia@163.com
2. Sichuan Port and Channel Development Co. Ltd, Chengdu 610072, China
3. Laboratory of Hydraulics, Chongqing Jiaotong University, Chongqing 400074, China
A parameter analysis of a two-phase flow model for supersaturated total dissolved gas downstream spillways*
Hui-xia YANG (杨慧霞)1, Ran LI (李然)1, Rui-feng LIANG (梁瑞峰)1, Juan WEI (魏娟)2,Qin ZHANG (张沁)3
1. State Key Laboratory of Hydraulics and Mountain River Engineering, Sichuan University, Chengdu 610065,China, E-mail: bt-yanghuixia@163.com
2. Sichuan Port and Channel Development Co. Ltd, Chengdu 610072, China
3. Laboratory of Hydraulics, Chongqing Jiaotong University, Chongqing 400074, China
A high concentration of the total dissolved gas (TDG) in a flow downstream high dams may cause the gas bubble disease in fishes. To better understand the spatial distribution of a supersaturated TDG, a numerical simulation approach for determining the TDG concentration is shown to be effective and convenient; however, the determination of the model parameters relies to a great extent on the observed field data, which are scarce but are very sensitive to the accuracy of the simulation. In this regard, determining the source parameter in the TDG transport equation is the primary concern of this paper. Observed field data from six different spillways in China are used to calibrate the source parameter. A relationship between the source parameter and the hydrodynamic characteristics is established. The inclusion of this relationship in the predictive relationship will enable an accurate and rapid estimation of the source parameter and may help in developing mitigation measures for the TDG supersaturation downstream the spillways.
bubble, supersaturated total dissolved gas, dissolved gas production, source parameter
Introduction
The total dissolved gas (TDG) supersaturation observed in a spillway that flows downstream various hydraulic structures has long been recognized as having a negative environmental effect on fish and aquatic organisms. Because of the gas contained in the supersaturated water column, a great number of bubbles can appear on a fish's skin, blood vessels, etc. Thus, the arterial embolism is experienced at a high frequency, leading to the gas bubble disease[1]. In natural rivers, the range of the TDG supersaturation is related to the compensation depth and the ecological characteristics for the fish. The species, the life stage, the size and the genetic characteristics are the key factors in determining the tolerance threshold level. Johnson et al.[2]reported that the adult Chinook sal- mon changed their migration depths to avoid the situa- tion of the TDG concentrations being equal to or less than 120%. To mitigate the effects and protect the fish from the gas bubble disease, the TDG level resulting from the spill discharge and the affected range of the supersaturated TDG must be predicted. Thus, the numerical model and the parameter determination are desirable.
The original source of the high TDG events is the dissolution of the entrained air under the high pressure of a plunge pool/stilling basin, which involves air entrainment in the form of bubbles, that is, the mass transfer of air between bubbles and water. Orlins and Gulliver[3]conducted several experiments to predict the TDG in the downstream flows of spillways, which was an effective albeit expensive undertaking. DeMoyer et al.[4]discussed the complex process of the air entrainment, the mass transfer between the bubble/water interface and the degasification on the free surface through a standard testing methodology for the gas transfer in aerated systems, however, these investigators oversimplified the dissipation process. Politano et al.[5]developed a two-phase flow model and with a modified bubble-induced turbulence term to calculate the distribution of the dissolved gas concentration. In the numerical simulation, the source parameter strongly influences the mass transfer across the bubble/water interfaces and must be calibrated through a series of numerical experiments. The application of the numerical model and the accuracy of the numerical simulation are clearly affected by the source parameter. This process is especially time consuming in large-scale simulations. The major goal of this study is to derive a predictive formula for the source parameter, which involves the averaged turbulence viscosity for the water phase in the plunge pool/ stilling basin, the forebay water head, and the tailwater depth. The flow field is simulated using the renormalization group (RNG) model. The turbulence model provides an isotropic closure for the two-phase Reynolds-averaged Navier-Stokes (RANS) equations. The TDG concentration is predicted through the convection diffusion equation with a TDG source term. In addition, the field data for various types of dams under several operational conditions are used as the basis for the numerical simulation. A sensitivity analysis is performed because of the lack of relevant data for this model.
The aeration of the flood discharge is a typical turbulence mixing process including the convection diffusion of the multiphase flow and the generationdissipation of the TDG. There are three basic forms of flows over spillways: the surface jump, the hydraulic jump and the ski-jump. A fundamental energy dissipation is generally realized by an enhancement of the turbulent process in the plunge pool/stilling basin downstream the hydraulic structures. The highly turbulent flow moving away from the spillways can be primarily divided into two stages: the major generation stage of the TDG saturation in the plunge pool/ stilling basin and the major dissipation stage of the TDG saturation in the downstream river. In the plunge pool/stilling basin, the entrained air generates a large amount of bubbles, produced by the rolling and the collision of the water, which are highly varied in size and distribution. The bubbles created by the turbulence then move downstream to certain depths, and are dissolved into the water column, to create a sudden increase in the TDG concentration. Thus, the plunge pool/stilling basin is of critical importance to the generation of the TDG saturation. The downstream river undergoes the TDG dissipation process primarily because of the surface mass transfer between the air/ water interfaces.
The most common methods of analyzing the distribution of the TDG concentration in a downstream flow during the spill time are based on the prototype observations and the reduced-scale models. Monitoring equipment used in academic research is costly and requires professional operations. Therefore, more effective and accurate numerical models were developed for the practical prediction of the TDG concentration.
Chanson et al.[6]studied the scale effects on the air entrainment of vertical plunging jets of the same inflow Froude numbers. The results of recent experimental investigations show that the selection of the criteria used to assess the scale effects, such as the bubble sizes and the turbulence scales, is critical and is likely to be affected by scale effects, even in relatively large-scale laboratory models[7]. However, the bubble size data were not scaled properly because the Reynolds and the Weber numbers were ignored. The TDG effective saturation concentration in the plunge pool was determined on the basis of the effective penetration depth[8]. Geldert et al.[9]proposed an ordinary differential equation including the transfer rate of the coefficient across the bubble interface and the free surface. Takemura and Yabe[10]established an equation for the Sherwood number(Sh)of the gas bubble dissolution using the velocity distribution at the bubble surface. Based on these findings, Weber et al.[11]proposed a monodisperse flow (single-sized bubbles)model with exponential decay for the vertical bubbles as suggested by Orlins and Gulliver[3]. This model is a valuable tool for predicting the spatial distribution of a high TDG concentration and the evolution of the TDG plume but the variation of the bubble size in the turbulent flow is neglected. Politano et al.[12]developed a polydisperse (bubbles of different sizes) flow model using the Boltzmann transport equation to obtain the bubble size distribution while neglecting the bubble breakup and coalescence process. In this model, the air concentration, the flow rate, the turbulence intensity, the tailwater depth and other influential factors are used to analyze the mass transfer coefficients of the bubble/water interface. The bubble radius distribution, which is assumed to follow a normal distribution, is divided into several intervals. The density function in these intervals is then discretized to obtain the percentage of specific bubbles, which is related to the calculation of the TDG field.
The production of the supersaturated TDG and its influential factors were analyzed by the U.S. Army Corps of Engineers and they were summarized into the following three types of empirical expressions: a linear equation, an exponential equation and a hyperbolic function. With the development of computer technology, the numerical simulations of the supersaturated TDG were widely carried out. Qin et al.[13]derived an equation for calculating the bubble/waterinterface transfer coefficient, which will be the primary concern of this study. The undetermined source parameterβof the equation is determined using the numerical solution because no analytical solution can be usefully employed. Li et al.[14]used the above model of the hydraulic jump energy dissipation to calculate the TDG spatial distribution. The traditional calculation of the dissolved gas source term was improved by introducing the equilibrium concentration as a source term in the TDG transport equation. The parameter was calibrated to be 2.0. Thus, the parameter analysis of the two-phase numerical model of the supersaturated TDG could become the theoretical basis for future work.
1. Two-phase model descriptions
A two-dimensional (2-D), two-phase vertical averaged model is adopted for the flow field simulation to facilitate the subsequent TDG modeling. Diao et al.[15]validated the method via physical experimentation through the hydrodynamic simulation of a twophase jet flow. This model can predict the TDG generation and dissipation processes downstream the turbulent spillway discharge. In the following simulation,the TDG concentrations simulated by the model are compared with the observed results. In the model, the TDG source term is defined by the user defined function (UDF), which is implemented in the ANSYS Fluent. The details of the numerical model and the source term treatment are discussed as follows.
1.1 Hydrodynamic governing equations
The governing equation is laterally averaged after decomposing all velocities and pressures into a lateral averages. The hydrodynamic flow field is determined through the numerical simulation by a RANS model with k-εturbulence closure. The major equations in the model are as follows:
The continuity equation

The momentum equation
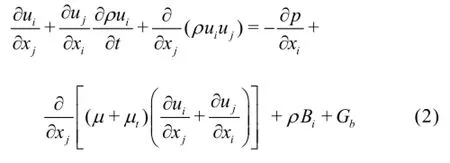
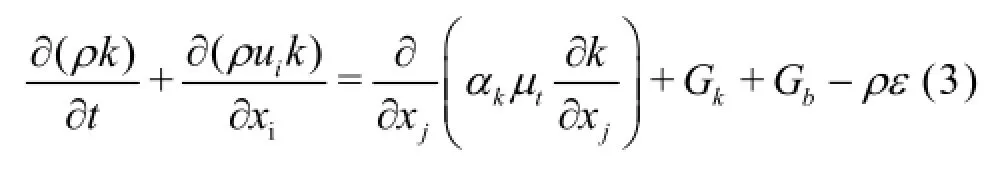
The turbulent kinetic energy equation
The turbulent dissipation equation

whereρis the density of the mixture,µtis the turbulent viscosity,pis the modified pressure,Biis the body force per unit volume,Gkis the generation of the turbulence kinetic energy due to the mean velocity,Gbis the generation of the turbulence kinetic energy due to the buoyancy, and αkand αεare the inverse effective Prandtl numbers fork andε,respectively.
1.2 Volume fraction equations
The phase of the fluid volume fraction in the cell is defined asα, and the ratio of the gas to the mixture, is

where Vais the volume fraction of the gas, and Vmis the total volume fraction of the mixture.
The aeration process is considered in the singlefluid model, and thus, the air concentration is adopted to distinguish the two-phase flow. The volume fractions of the air and the water in the mixture are considered to be independent variables, which means that the sum of the volume fractions for the air and the water is maintained at a value of 1 in each cell. In the flow field, the characteristic parameters are expressed by the weighted average results for the volume fraction of the mixture. The governing equation of the secondary phase αwcan be written as

The densityρand the molecular viscosity coefficientµare transformed into a function of the volume fraction instead of a constant, and the expressions are
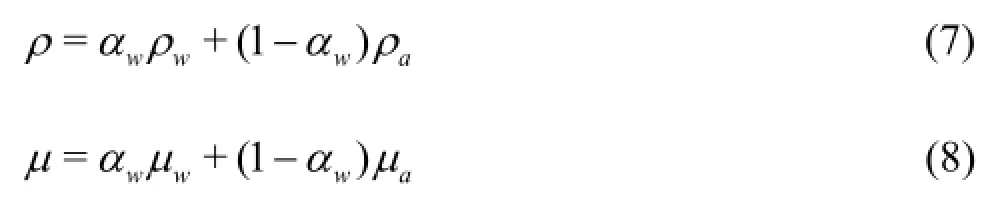
where ρwand ρaare the densities of the water and the air, respectively, and µwand µaare molecular viscosities of the water and the air, respectively.
1.3 TDG transportation equation and source term treatment
1.3.1 TDG transportation equation
The TDG flow field is simulated with a two-phase transport equation[11]as
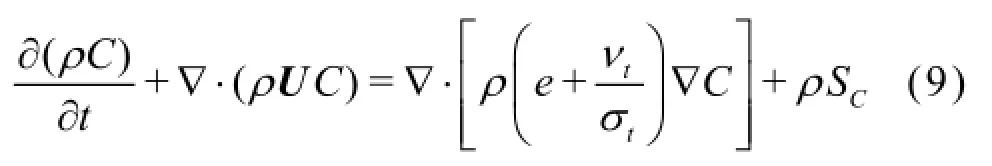
whereC denotes the TDG concentration,SCis the TDG production source term,eis the molecular diffusion coefficient of the TDG, and νtis the turbulent kinematic viscosity of the mixture. The variable νis generally several orders of magnitude smaller than νtand can be neglected in the turbulent flows. The variable σtis the turbulent Schmidt number, and it is assumed to be in a range of 0.5-2.0 because of the dependency of the mixture density on the spatial and temporal scales[16]. To determine the distribution of the TDG concentrations, a user-defined scalarC is implemented in the program.
1.3.2 Source term treatment
(1) Source term expression
The source term SCin the TDG transport equation represents the mass transfer across the bubble/ water interface and the free surface, and it can be written as
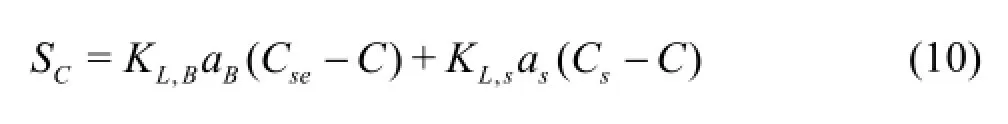
where KL,Bis the mass transfer coefficient across the bubble interface,aBis the specific area as the ratio of the total area of the entrained bubbles to the total volume of the mixture,KL,sis the mass transfer coefficient across the water interface,asis the specific free water surface area as the ratio of the total area of the free surface to the total volume of the mixture,Cs(=100%) is the equilibrium saturation concentration,and Cseis the effective saturation concentration. Here,Cseis expressed as follows[12]
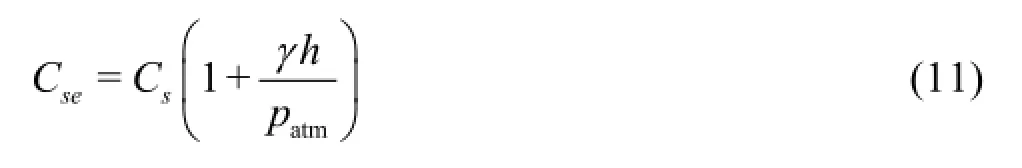
whereγis the specific gravity of the water,his the actual depth of the bubble penetration,patmis the atmospheric pressure.
(2) Mass transfer across the bubble interface
Qin et al.[13]proposed a model to separately calculate KL,Band aBbased on the work of Takemura et al.[10]as follows
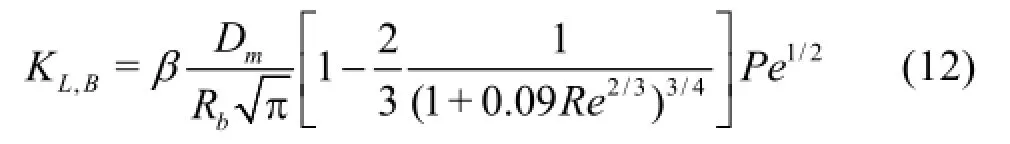
where Rbis the bubble radius,Peis the Peclet number,Re is the Reynolds number. Here,βis a dimensionless calibration coefficient, as the primary concern of this study.
Xiao et al.[16]suggested that the bubble sizes fall mostly between 0.0015 m and 0.0040 m, and the probability distribution approximately follows a normal distribution. Based on the previous prototype observations and the general theory of statistics, the assumption of a normal distribution of bubble sizes is adopted in this study. The distribution and the discretization of the density function follow a hypothesis of r(m)-N(2.5× 10-3,0.52× 10-3)and a confidence interval of 95% with a bubble radius ranging between 0.00045 m and 0.00445 m. The bubble radius range of variation is divided into 40 intervals of 0.0001 m. The function f( r)is discretized so that the radius distribution is in thei -thsection. The function f( ri)between (ri-1,ri)is defined as f( ri)=[f( ri-1)+f( ri)]/2. The average bubble radius is equal tori=(ri-1+ri)/2.
The equation for the specific area aBis generated using the following normal distribution
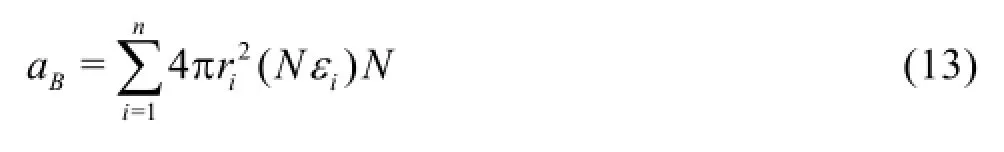
whereN is the bubble number per mixture volume,n is the interval number of the bubble radius,riis the averaged bubble radius of the intervali, andεiis the bubble number density of the intervali .
(3) Mass transfer across a free surface Politano et al.[5]used the mass transfer coefficie nt across the free surface based on the unsaturated dissolved oxygen (DO) reaeration coefficient obtainedin a bubble plume study by DeMoyer et al.[4]. Li et al.[14]noted that the supersaturated DO is not a reasonable approximation for the supersaturated TDG. A series of observations were made in the Sichuan University to study the mass transfer across the free surface in many river studies. Because there were few bubbles in the river, the mass transfer primarily occurred across the free surface. In this application, the dissipation coefficients KL,sain Table 1 are adopted to represent the mass transfer across the air-water interfaces.
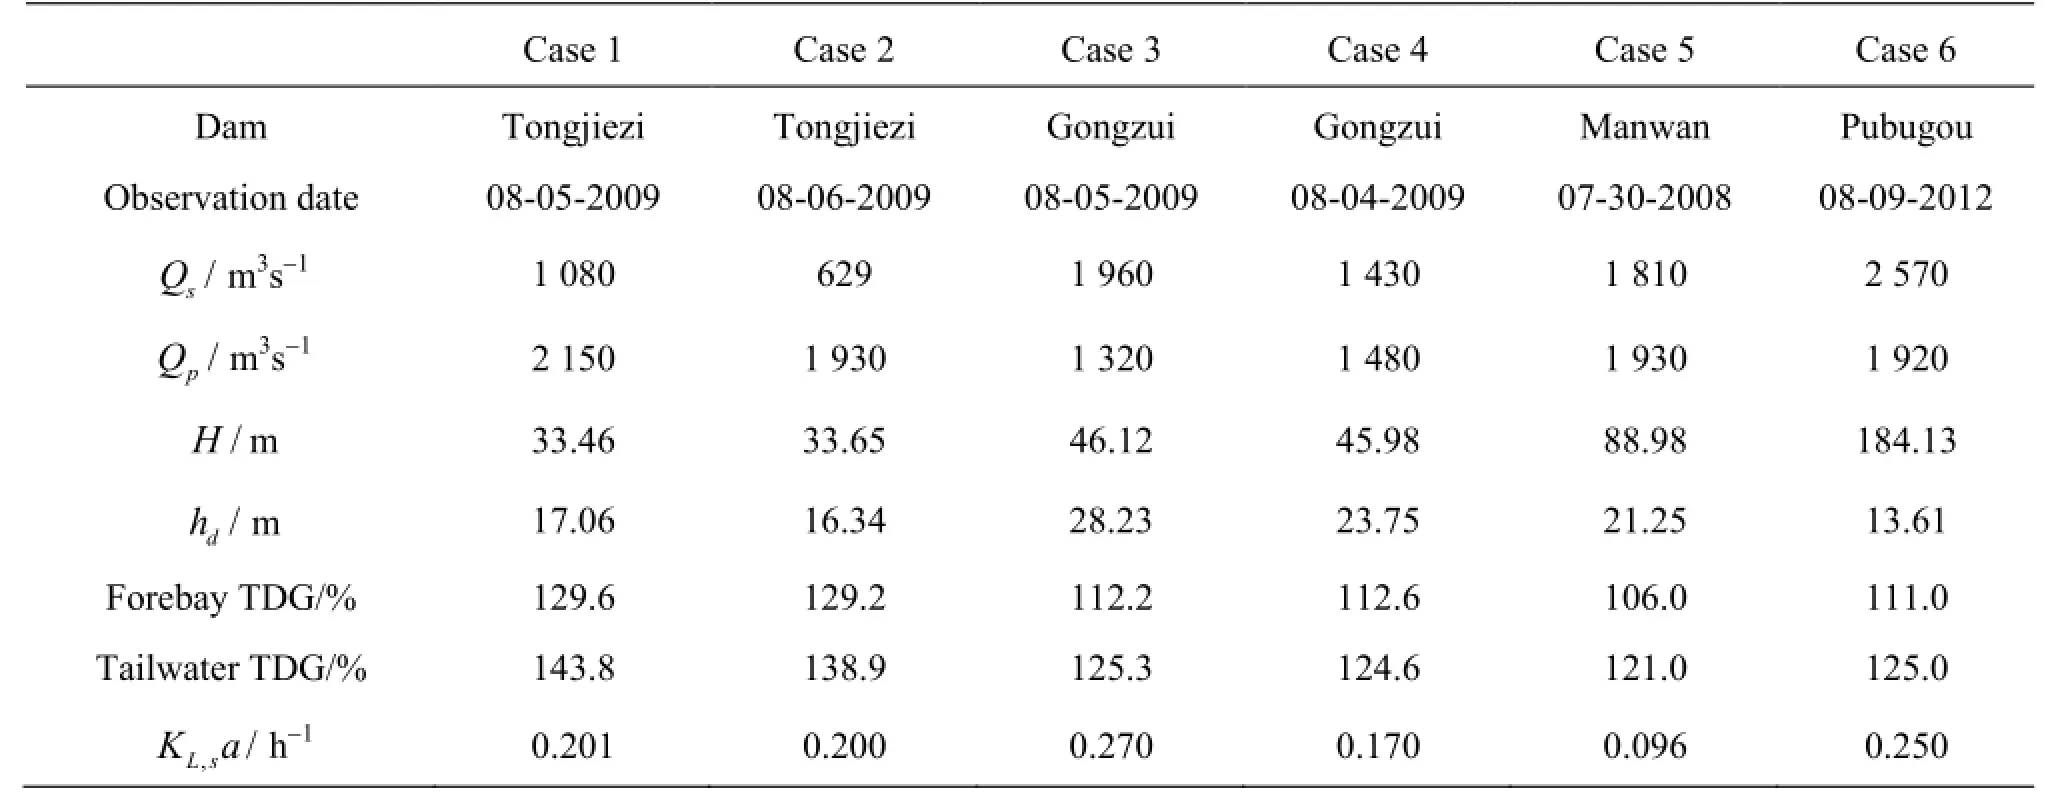
Table 1 Basic conditions of different simulated dam cases

Fig.1 Comparison of TDG results with different values ofβ downstream the Tongjiezi Dam (Case 1)
1.4 A discretization scheme and solution method
The VOF model equations are solved using the finite volume method. The continuity equation is solved using the coupling method of a pressure-velocity SIMPLE-Consistent algorithm. The pressure on the cell faces is simulated by a body-force-weighted scheme. The gas volume fraction is calculated using the Geo-Reconstruct scheme. The user-defined scalar(UDS) for the TDG concentration is used to calculate the TDG transport. The UDF is implemented in the ANSYS Fluent to solve for the source term and the bubble number density. A differential flow-in and flow-out of less than 5% is chosen as a convergence variable. The evolution over time of the area-weighted average TDG concentrations at the outflow is chosen as a reference to determine if the solution reaches a steady state. According to the VOF model, the airwater interface is defined as the surface where the volume fraction of the air corresponds to 50% at the atmospheric pressure. Beneath the air/water interface,the bubble density is calculated, and the mass transfer term (Eq.(12)) is applied to the entire bubble/water interface.
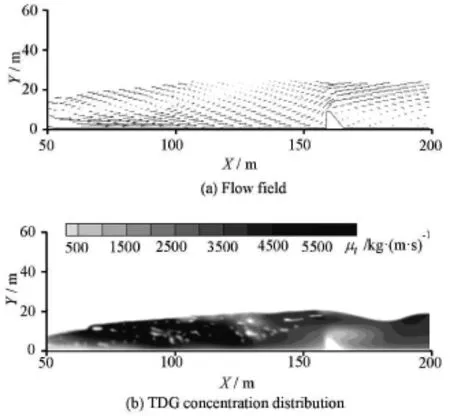
Fig.2 Sensitivity analysis results downstream the Tongjiezi Dam with Q=1080 m3/s(Case 1)s
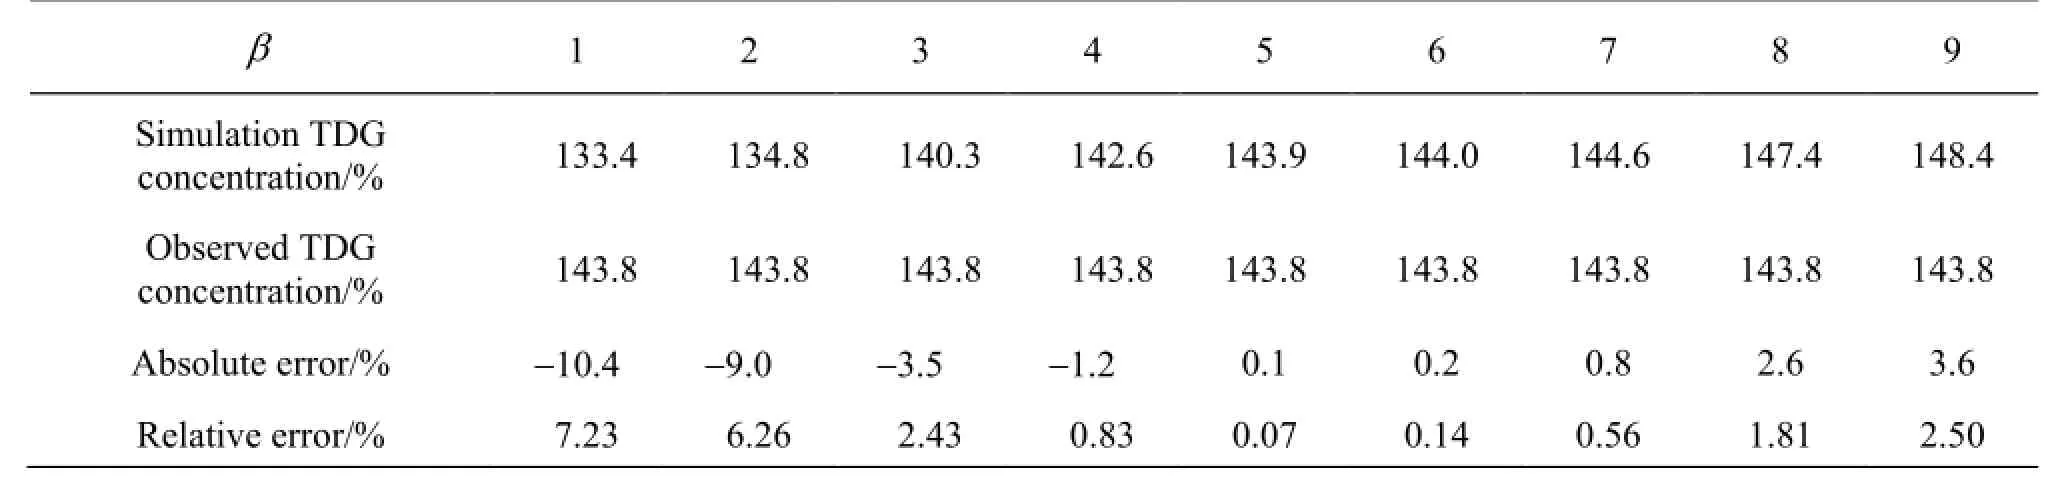
Table 2 Calibration results for the TDG concentration based on different source parameterβvalues for the Tongjiezi Dam(Case 1)
2. A sensitivity analysis of the parameterβ
To determine the parameterβ, the influence of βon the TDG generation and the dissipation downstream the spillway should be estimated first. The most promising way to do so is the sensitivity analysis of βat the downstream TDG level. The discharge from the Tongjiezi Dam is employed as an example of a sensitivity analysis ofβ(Case 1 in Table 1). The calibration is performed during the sensitivity analysis process.
The Tongjiezi Dam is a concrete gravity dam with a maximum height of 79 m. The spillway consists of five overflowing orifices of the same size. There is a stilling basin with an end sill downstream the spillway, and the dissipation energy type is a hydraulic jump. The simulation domain extends from 100 m upstream the dam to 500 m downstream the spillway. An unstructured mesh is generated using the Gambit and contains 56 582 nodes.
2.1 Boundary and initial conditions
2.1.1 Boundary conditions
The boundary conditions are defined as follows:
(1) Velocity Inlet: The inflow of the liquid phase is defined as the velocity inlet. The velocity is set to be the ratio of the flow rate Qsto the cross section area A, expressed as Vin=Qs/A . For Case 1,Qsis equal to 1 080 m3/s. The TDG concentration of the inlet is set at an observed value of 129.6% in the forebay (Table 1). The turbulent kinetic energykmis estimated as, and the energy dissipation rateεinis εin=kin/(0.4hin)according to the previous research[17,18].
(2) Wall: A non-slip boundary condition is implemented.
(3) Outflow: An outflow boundary is imposed on the downstream air-water mixture exit. The TDG concentration is set at the zero flux.
(4) The pressure inlet: The pressure inlet includes three parts in the computational domain. One part is at the air exit on the downstream cross section to avoid the air pressurization. The second part is applied to the top boundary of the domain to enable the free air flow. The third part is applied to the air inflow at the upstream boundary of the domain for the same reason[19].
2.1.2 Initial conditions
The computational zone of the flow field is initialized based on the velocity inlet. The TDG concentration is initialized to be 129.6%.
2.2 Simulation results with different values ofβ
The parameterβvaries between a series of integers from 1 to 9. For eachβ, the numerical model is solved, and the TDG distribution is obtained. Fig.1 presents the vertically averaged TDG concentration and the maximum vertical TDG concentration along the longitudinal direction. The spatial evolutions of the TDG concentration for different values ofβare similar. The maximum value appears at the upstream area of the end sill and the TDG concentration gradually decreases toward the downstream area. Both the vertically averaged and the maximum vertical TDG concentrations increase with the increase ofβ(Fig.1). Figure 2(a) shows the 2-D velocity vectors with the flow rate Q=1080 m3/s. Figure 2(b) shows the
s turbulent viscosity contours based on the simulation results. There is a strong back flow in the stilling basin. In the recirculation zone, the turbulent viscosity is very high where the main region of the TDG is generated. There is a small back flow downstream the end sill where the flow field displays the main feature.
The field observation was conducted at the Sichuan University in 2009. The powerhouse flow and the spillway discharge are mixed well, and therefore,the mass-weighted averaged method has to be used to eliminate the tailwater influence and derive the TDG concentration level of the spillway discharge. The TDG concentration of the powerhouse flow is estimated to be 129.6%. Thus, the TDG concentration of the tailwater is found to be 143.8% (Table 1) using the mass-weighted averaged method. In the hydraulicjump flow, the Froude number is 4.61 and the Reynolds number is 6.5×10⁷[17]as calculated based on the flow field dynamics. A comparison between the simulation results for different values ofβand the field observation values are listed in Table 2. This comparison shows thatβmarkedly affects the TDG concentration level. The error in the simulated results is minimized when β=5and increases whenβis apart from 5 on both sides. Thus, the calibrated value of parameterβis recorded as 5.
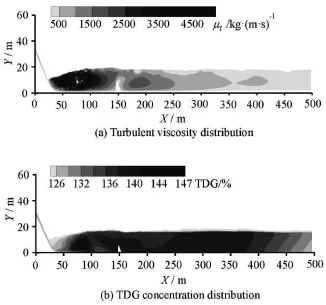
Fig.3 Validation results downstream the Tongjiezi Dam with Q=629 m3/s, Case 2s
3. Parameter calibration for different dam cases
As indicated by the previous sensitivity analysis,the distribution of the TDG concentration is closely related to the value ofβ, and this paper is to determine the proper value ofβin different discharge cases. In this section, several dam discharges (Case 2-Case 6 in Table 1) are simulated using the VOF model. The parameterβis calibrated by comparing the simulated TDG concentration with the observed data. All three types of energy dissipation, including the ski-jump, the hydraulic jump and the surface jump,are included in the simulation study.
The simulation results of the Tongjiezi Dam discharge (Case 2) are shown in Fig.3 as a validation of the TDG simulation model. The maximum TDG concentration appears in the stilling basin because of the large quantity of bubbles entrained into the basin, leading to an increase of the gas volume fraction during spills. The dissolved gas concentration gradually increases because of the mass transfer across the bubble/ water interface from 90 m to 120 m downstream the dam. The TDG concentration reaches 147% in the strong collision area 100 m away from the sluice gate, with a higher gas volume fraction and dissolved gas concentration being observed at the pool. The vertically averaged values increase and eventually become homogeneous downstream the end sill.
It is assumed that the air entrainment within the turbine flow seldom occurs, and the residence time in the spillway is shorter that the measured forebay TDG concentration can be used as an inlet condition. Freesurface computations are performed using the VOF model with a pressure inlet boundary condition. All cases are calibrated.

Fig.4 Simulated results downstream the Gongzui Dam spillway with Q=1960 m3/s, Case 3s

Fig.5 Simulated results downstream the Gongzui Dam spillway with Q=1430 m3/s, Case 4s
Two operating conditions of the Gongzui Dam(Case 3 and Case 4) are simulated. This project involves the construction of an 85.6 m high concrete dam,the spillway and the powerhouse. There are four damsections and four surface holes in the dam body. The spillway orifice is 12 m wide. The form of energy dissipation is a surface jump. Figure 4 and Fig.5 indicate that the turbulent viscosity of the surface water is greater than that of the bottom water because of the severe turbulence at the top region, which is approximately 300 m away from the place where the energy is maximized when the aerated jet is drawn into the rolling region and causes the turbulent diffusion. The turbulent viscosity becomes uniform at a cross section as the flow moves downstream. Compared with Case 3, the high turbulence area is much longer because of the large spill in Case 4. The vertically averaged TDG concentration decreases longitudinally after degassing of the bubbles at the end of the rolling area.
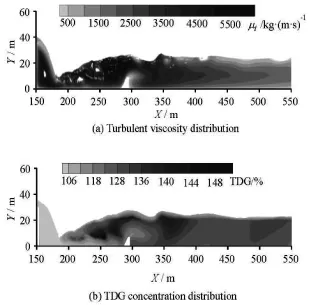
Fig.6 Simulated results downstream the Manwan Dam spillway withs Q=1810 m3/s, Case 5s
One operating condition of the Manwan Dam(Case 5) is simulated (Fig.6). Manwan is located on the Lancang River. The maximum height of the dam is 132 m, and the dam includes 5 surface orifices and one tunnel for flood discharge. The outlet of each surface orifice is 13 m wide and 20 m high. The power house is next to the right side of the spillway. The spillway energy dissipation in the form of a skijump creates a violent turbulence in the plunge pool. The entrained bubbles in the water jet dissolve into the spills in the plunge pool, and the TDG concentration rapidly increases. On the other side, the TDG concentration is relatively low due to fewer bubbles and less hydraulic pressure. The water depth increases before the second dam, resulting in a high total pressure, and the TDG concentration gradually increases. The vertically averaged TDG concentration reaches a plateau downstream the second dam.
One operating condition of the Pubugou Dam(Case 6) is simulated (Fig.7). A spillway tunnel from Pubugou is designed for flood discharges. The 578 m long spillway tunnel is subject to the ski-jump energy dissipation. The dam height is 186 m. In the plunge pool, the turbulent kinetic energy of the upside tunnel is on the left shoulder of the dam and it is evidently higher than that of the downstream zone because of the impact of the bubble coalescence and breakup. Thus, the longitudinal curve of the TDG concentration appears in an “M” shape.
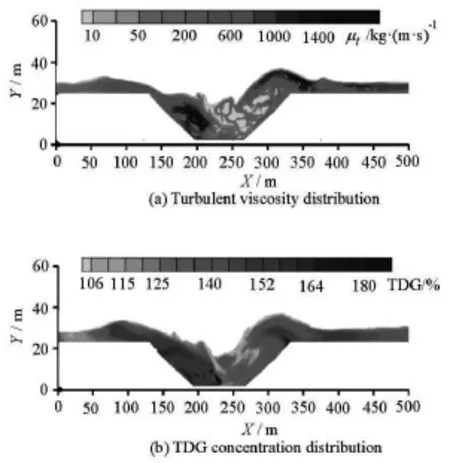
Fig.7 Simulated results downstream the Pubugou Dam spillway tunnel with Q=2570 m3/s, Case 6s
A summary of the simulation results is presented in Table 3, including the average turbulent viscosity for the water phase in the plunge pool/stilling basin.
4. Parameter analysis
For various temperatures and salinity levels in the plunge pool, the water depth and the turbulence intensity are shown to be the direct and significant factors in the TDG concentration. Based on the previous study, a quantitative relationship betweenβ and the spillway discharge (Table 4) is established. The formula includes the mean turbulent viscosity µtfor the water phase in the plunge pool/stilling basin,the tailwater depth hdin the downstream riverbed and the forebay water headH . Two dimensionless variables,(H-hd)/Hand µt/νare introduced to represent the discharge characteristics. There is no clear relationship betweenβ~(H-hd)/Handβ~µt/ν in a separate sense. Next, the source parameter together with the two dimensionless variables are analyzed using a fitting curve (Fig.8). The error between the calibrated and calculated values ofβis acceptable(Table 3). Through the analysis of the dimensionless variables, the following relationship is formulated

Table 3 Analysis of simulated results for different cases
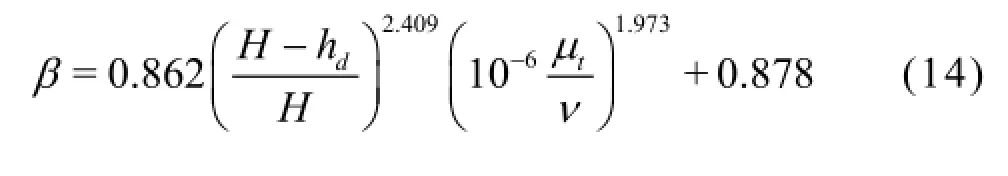
whereνis the kinematic viscosity. Here the forebay water headH is assumed to be greater than the tailwater depth hd.
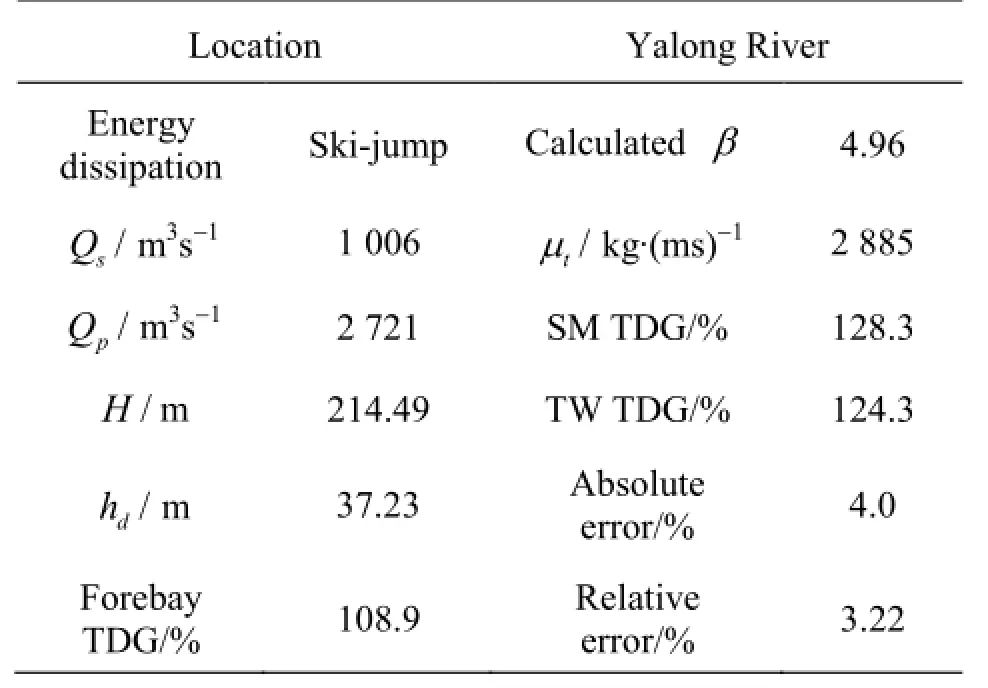
Table 4 Boundary conditions and simulated results for the Ertan Dam of Yalong River

Fig.8 The relationship betweenβand the dimensionless variables (H -hd )/Hand µt/η
The parameter formula is validated by using the field data collected from the Ertan Dam, located in the Yalongjiang River of China. The maximum height of the double-curvature arch dam is 240 m. Each of the 6 middle orifices for spillway discharges is 6 m wide and 5 m high. The ski-jump energy dissipation is adopted with a plunge pool downstream the dam extending to 300 m away from the spillway. According to the field observation data collected by researchers from the Sichuan University in 2007[20], the operating and boundary conditions for the validation are established and listed in Table 4. The observed point is located 2 000 m downstream the dam.

Fig.9 Simulated results downstream the Ertan Dam spillway with Q=1006 m3/ss
The flow field is obtained through the numerical simulation. The mean turbulent viscosity µt(Fig.9(a))in the pool for the water phase is computed to be 2 885 kg/(m·s). The parameterβis calculated to be 4.96 using the fitting formula (Eq.(14)). The calculated value ofβis adopted in the TDG numerical simulation. The distribution of the TDG concentrations obtained by the simulation is shown in Fig.9(b). The simulated TDG concentration in the observation section without the confluence of the power flow is 144.8%. In reality, the power flow is converged with the power discharge at the observed section, and thedilution effect of the power flow should be considered by the flow-weighted method. Therefore, the calculated TDG concentration at the observation point is 128.3%. In comparison with the observed TDG value of 124.3%, the absolute error between the simulation results and the observation data is 4%, with an equivalent relative error of 3.22%. The validation results from the Ertan Dam are shown in Table 4. The validation results by usingβobtained from the parameter formula are reasonable, and the error is acceptable.
5. Conclusions
The value of a two-phase unsteady-state model parameterβis the focus of this intensive study. The model integrates the relations proposed in the literature that describe the mass transfer across the bubble/ water interface and the air/water surface and those of the turbulence decay and bubble distribution. This model is calibrated with the field data measured by researchers from the Sichuan University in different river reaches. The results of a sensitivity analysis are presented to support the importance ofβin the numerical model for predicting the TDG concentrations. The primary conclusions are as follows:
(1) The assumption of a bubble normal distribution can properly reflect the bubble transfer process and the declassification at the free surface.
(2) Projects with different geometries, forebay water heads, tailwater depths, discharges and upstream TDG levels are necessary to determine the parameter relationship.
(3) The derived model parameter relationship reduces the complexity of the model calibration and improves the efficiency of the numerical simulation.
Currently, with the limited available field data, a wider calibration can not be made for formulating the parameter relationship over a series of spillway discharges. Therefore, additional field data should be prepared to improve the previous work.
References
[1] ROBERTS R. J. Fish pathology[M]. Third Edition,Oxford, UK: Harcourt Publishers Ltd, 2001.
[2] JOHNSON E. L., CLABOUGH T. S. and BENNETT D. H. et al. Migration depths of adult spring and summer Chinook salmon in the lower Columbia and Snake Rivers in relation to dissolved gas supersaturation[J]. Transactions of the American Fisheries Society, 2005, 134(5): 1213-1227.
[3] ORLINS J. J., GULLIVER J. S. Dissolved gas supersaturation downstream of a spillway II: Computational model[J]. Journal of Hydraulic Research, 2000, 38(2): 151-159.
[4] DEMOYER C. D., SCHIERHOLZ E. L. and GULLIVER J. S. et al. Impact of bubble and free surface oxygen transfer on diffused aeration systems[J]. Journal of Water Research, 2003, 37(8): 1890-1904.
[5] POLITANO M., CARRICA P. M. and WEBER L. A multiphase model for the hydrodynamics and total dissolved gas in tailraces[J]. International Journal of Multiphase Flow, 2009, 35(11): 1036-1050.
[6] CHANSON H., AOKI S. and HOQUE A. Physical modelling and similitude of air bubble entrainment at vertical circular plunging jets[J]. Chemical Engineering Science,2004, 59(4): 747-758.
[7] PFISTER Michael, CHANSON Hubert. Two-phase airwater flows: Scale effects in physical modeling[J]. Journal of Hydrodynamics, 2014, 26(2): 291-298.
[8] HIBBS D. E., GULLIVER J. S. Prediction of effective saturation concentration at spillway plunge pools[J].Journal of Hydraulic Engineering, ASCE, 1997, 123(11): 940-949.
[9] GELDERT D. A., GULLIVER J. S. and WIHELMS S. C. Modeling dissolved gas supersaturation below spillway plunge pools[J].Journal of Hydraulic Engineering,ASCE, 1998, 124(5): 513-521.
[10] TAKEMURA F., YABE A. Gas dissolution process of spherical rising gas bubbles[J]. Chemical Engineering Science, 1998, 53(15): 2691-2699.
[11] WEBER L. J., HUANG H. Q. and LAI Y. et al. Modeling total dissolved gas production and transport downstream of spillways: Three-dimensional development and applications[J]. International Journal of River Basin Management, 2004, 2(3): 157-167.
[12] POLITANO M. S., CARRICA P. M. and CAGRI T. et al. A multidimensional two-phase flow model for the total dissolved gas downstream of spillways[J]. Journal of Hydraulic Research, 2007, 45(2): 165-177.
[13] QIN Chun-li, LI Ling. Numerical model of dissolved gas supersaturation flow over spillway of Gezhou Dam project[J]. Scicence and Technology Review, 2008, 26(18): 45-48(in Chinese).
[14] LI R., HODGES B. R. and FENG J. et al. Comparison of supersaturated total dissolved gas dissipation with dissolved oxygen dissipation and reaeration[J]. Journal of Environmental Engineering, 2013, 139(3): 385-390.
[15] DIAO Ming-jun, YANG Yong-quan and WANG Yu-rong et al. Numerical simulation of water-air two-phase flow from flip bucket to plunge pool[J]. Journal of Hydraulic Engineering, 2003, 34(9): 77-82(in Chinese).
[16] XIAO Bai-qing. Study on hydraulics and oxygen transfer of bubble plume in aeration tanks[D]. Doctoral Thesis, Chengdu, China: Sichuan University, 2011(in Chinese).
[17] GUALTIERI C., CHANSON H. Experimental analysis of Froude number effect on air entrainment in hydraulic jumps[J]. Environmental Fluid Mechanics, 2007, 7(3): 217-238.
[18] GUALTIERI C., CHANSON H. Effect of Froude number on bubble clustering in a hydraulic jump[J]. Journal of Hydraulic Research, 2010, 48(4): 504-508.
[19] FENG Jing-jie, LI Ran and YANG Hui-xia et al. A laterally averaged two-dimensional simulation of unsteady supersaturated total dissolved gas in deep reservoir[J]. Journal of Hydrodynamics, 2013, 25(3): 396-403.
[20] QU Lu, LI Ran and LI Jia et al. Field observation of total dissolved gas supersaturation of high-dams[J]. Science China Technological Sciences, 2011, 54(1): 156-162.
10.1016/S1001-6058(16)60669-8
March 8, 2015, Revised June 3, 2015)
* Project supported by the National Natural Science Foundation of China (Grant Nos. 51279115, 51179111).
Biography: Hui-xia YANG (1982-), Female, Ph. D.
Rui-feng LIANG,
E-mail:liangruifeng@scu.edu.cn
2016,28(4):648-657
猜你喜欢
Chinese Physics B(2022年11期)2022-11-21
考试与评价·七年级版(2021年2期)2021-08-14
考试与评价·七年级版(2020年4期)2020-10-23
娃娃乐园·绘本(2020年9期)2020-09-28
中华建设(2019年10期)2019-11-12
中学生博览(2019年2期)2019-01-23
娃娃乐园·综合智能(2017年16期)2017-02-24
初中生之友·中旬刊(2016年1期)2016-09-10
家人(2016年7期)2016-08-25

- 水动力学研究与进展 B辑的其它文章
- Effect of some parameters on the performance of anchor impellers for stirring shear-thinning fluids in a cylindrical vessel*
- A study of hybrid prediction method for ship parametric rolling*
- Numerical simulation of flow characteristics for a labyrinth passage in a pressure valve*
- Effect of head swing motion on hydrodynamic performance of fishlike robot propulsion*
- Prediction of oil-water flow patterns, radial distribution of volume fraction,pressure and velocity during separated flows in horizontal pipe*
- Motion and deformation of immiscible droplet in plane Poiseuille flow at low Reynolds number*