
Design and development of guide vane cascade for a low speed number Francis turbine*
2016-10-18 01:45BirajSinghTHAPAChiragTRIVEDIOleGunnarDAHLHAUG
水动力学研究与进展 B辑 2016年4期
Biraj Singh THAPA, Chirag TRIVEDI, Ole Gunnar DAHLHAUG
Department of Energy and Process Engineering, Norwegian University of Science and Technology, Trondheim,Norway, E-mail: biraj.s.thapa@ntnu.no
Design and development of guide vane cascade for a low speed number Francis turbine*
Biraj Singh THAPA, Chirag TRIVEDI, Ole Gunnar DAHLHAUG
Department of Energy and Process Engineering, Norwegian University of Science and Technology, Trondheim,Norway, E-mail: biraj.s.thapa@ntnu.no
Guide vane cascade of a low speed number Francis turbine is developed for the experimental investigations. The test setup is able to produce similar velocity distributions at the runner inlet as that of a reference prototype turbine. Standard analytical methods are used to design the reference turbine. Periodic walls of flow channel between guide vanes are identified as the starting profile for the boundary of the cascade. Two alternative designs with three guide vanes and two guide vanes, without runner, are studied. A new approach, for the hydraulic design and optimization of the cascade test setup layout, is proposed and investigated in details. CFD based optimization methods are used to define the final layout of the test setup. The optimum design is developed as a test setup and experimental validation is done with PIV methods. The optimized design of cascade with one guide vane between two flow channels is found to produce similar flow conditions to that in the runner inlet of a low speed number Francis turbine.
guide vanes, Francis turbine, cascade, optimization, CFD, PIV
Introduction
Increase in demand of clean energy is promoting further explorations of renewable energy sources. Hydropower is one of the oldest and most reliable sources of clean energy to meet electricity demand. It contributes more than 20% of the global electricity generation. However, more than 80% of feasible hydropower resources are still untapped[1]. In recent years large scale of new hydropower plants are under construction, particularly in Asia and South America. Thus, hydropower sector will receive more attention and investments in future. It also demands research and development activities to address several technical and operational challenges brought by environmental issues and market prices[2].
Hydraulic turbine is an important component of a hydropower plant. The turbine converts available hydraulic energy into mechanical energy, which is then converted to electrical energy by the generators. Francis type of hydraulic turbines are widely used for this energy conversion, as it can meet the real time demand with its ability to maintain high efficiency even under fluctuating load. Single unit of these turbines are capable of generating power up to 1 000 MW[3]. During the operation of Francis turbines, the guide vanes control the discharge to the runner according to power requirement. Water usually accelerates when it passes through the guide vanes and is directed to the runner at an appropriate inlet angle. In a conventional Francis turbine, about 50% of pressure head is converted to velocity head as the flow accelerates through the guide vanes[4]. For the high head Francis turbines, this accelerated flow causes unstable flow conditions contributing to vortex shedding, high amplitude pressure pulsation, flow separation and sometimes cavitation[5]. Non-uniform pressure and velocity distribution significantly affects the turbine operation and induce dynamic load on runner affecting the operating life of the turbine[6]. Operating conditions with sediment laden flows add additional challenges and escalates the problems with the eroded surfaces due to material removal[7].
Minimizing the rotor stator interaction and achieving uniform velocity distribution at the runner inlet is one of the challenging tasks for a turbine designer. Toaddress this issue, some of the researchers have attempted to investigate and improve the flow conditions in the flow passages of the guide vanes and runner blades. Ruchonnet[8]has developed a mathematical model and studied the rotor stator interaction in a Francis pump turbine. He has studied the role of Eigen frequencies on hydraulic systems experiencing high amplitude pressure fluctuations. Larsson[9]has conducted experimental and theoretical analysis of inlet flow of a Francis turbine runner. He has used LDA methods to measure the characteristics of velocity distribution in vane less space and found that the velocity fluctuations in a guide vane passage can be up to 15% of theoretical value due to the rotor stator interaction. Qian[10]has used PIV methods to measure the pressure and velocity distribution around the pressure side and suction side of the two neighboring guide vanes in a model Francis turbine. It was found that both radial and tangential components of velocity between the guide vanes fluctuate significantly. Kobro[11]has measured the effects of such velocity fluctuations on the dynamic load in runner blades in a model Francis turbines. He found that fluctuations of stresses inside the runner blades were highest for 50-70% of nominal discharge. Xiao[12]has conducted CFD predictions of pressure pulsations in a Francis pump turbine with misaligned guide vanes. It was found that the misaligned guide vanes significantly reduce the pulse amplitudes in the stationary parts of the turbine but increases the pulse amplitudes within the rotating runner blade passages. These works show that the unsteady flow is inherent from the guide vanes and cause to several undesirable effects on turbine parts. Comprehensive study of unsteady flow around the guide vanes of Francis turbines to identify its correlation with secondary flow fields and with the design of guide vane profile would contribute to further research in this field of study.
For a more detailed and specific investigation of flow field inside a turbine, a stationary cascade system can also produce reliable results. Cascade setup considers only a section of turbine and hence reduces flow requirements inside the test rig. Furthermore, the components in the cascade can be designed to have a better excess to measuring instruments and physical observations. Such method however, does not include the effects of runner in the flow field, and also assumes the periodic symmetry in flow over the cascade boundary. Despite of these limitations, researchers have obtained reliable and useful results using the cascade setup. Bario[13]has used a single guide vane cascade to measure the boundary layer on the pressure and suction sides of a turbine inlet guide vane. Schabowski[14]has developed a test set up with cascaded vanes to test alternative geometries to reduce tip losses in unshrouded axial gas turbines. He also used the results to verify CFD codes for such cases of flow. Zobeiri[15]has also used single guide vane cascade setup to investigate the effects of hydrofoil trailing edge shape on the wake dynamics and flow induced vibration. He identified the vortex redistribution phenomenon as the cause of vibration reduction in oblique shaped trailing edge. Finstad[16]has further investigated this vortex redistributing phenomenon behind the trailing edge of airfoils for reducing rotor stator interaction in hydraulic machineries. He has also used single guide vane cascade setup for the measurements and has tested effects of different shapes of vortex generators mounted on the rear section of suction side of guide vanes. Most of these measurements have been supported by CFD analysis for predicting the flow behavior under applicable boundary conditions. However, none of these measurements were conducted with the same magnitude of velocity and pressure as that is observed in a prototype turbine. It is challenging to develop laboratory setup which can reproduce similar pressure and velocity distribution as that observed in prototypes.
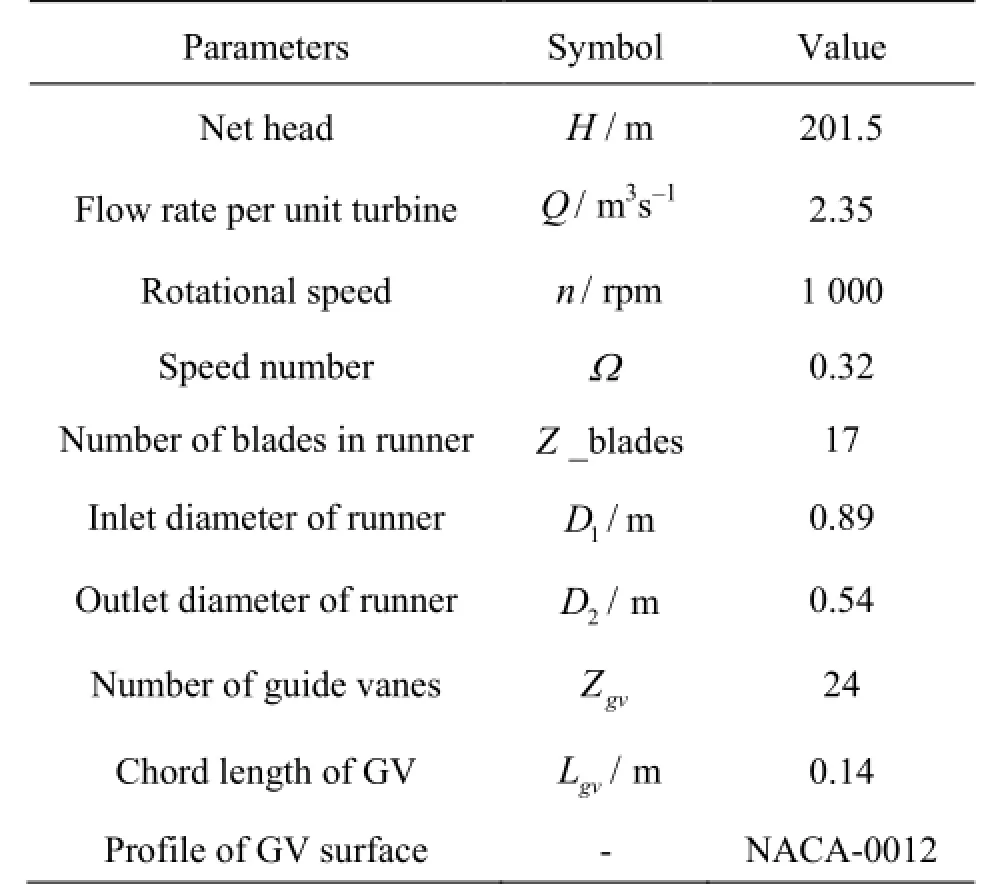
Table 1 Reference turbine analytical design values
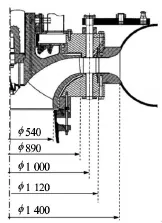
Fig.1 Dimensions of prototype turbine[18]
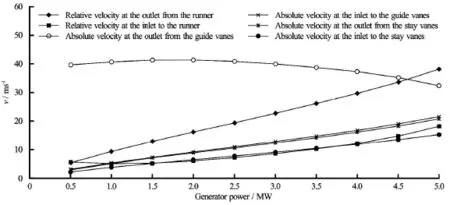
Fig.2 Velocities in prototype turbine[18]
Main objective of the presented work is to develop a cascade of guide vane passages, which will be able to produce steady state flow conditions from the stay vane outlet to the runner inlet of a low speed number Francis turbine. The design goal is to acquire quite similar flow conditions as that observed in a prototype turbine. The purpose of this setup is to examine the effects of leakage flow around guide vanes on the velocity and pressure distribution at the runner inlet. The setup isolates the effects of runner on the flow field and hence allows precise study of effects of leakage flow. The paper discusses the analytical and numerical techniques applied to develop the guide vane cascade starting from the preliminary design to the final optimization and its experimental validation.
1. Analytical design and optimization
1.1 Reference turbine
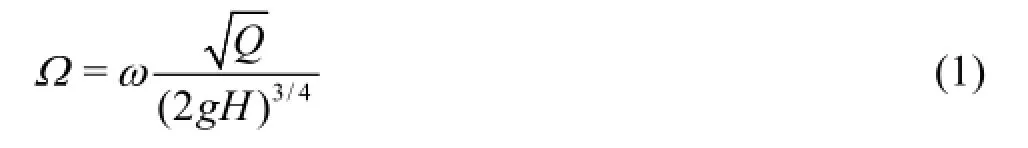
Jhimruk Hydroelectric Center (JHC) in Nepal is considered as the reference case for this study. The power plant has three units of Francis turbine and each produces 4.2 MW at the best efficiency point (BEP). These are low speed number splitter bladed Francis turbines defined by Eq.(1)[17].
The power plant represents a typical case of projects operating under large sediment load in Himalayan basin[18]. Several academic studies[19-21]have been conducted to improve hydraulic design of this turbine to handle large sediment load. Design and drawings of the installed prototype are not available therefore an in-house tool named as “Khoj”, was developed to design a reference turbine with the aim to replace the existing one[20]. Extensive investigations were carried out on this reference turbine for optimizing hydraulic design to minimize sediment erosion without compromise in efficiency[22-26]. Understanding the consequences of erosion on guide vanes and investigating its effects on velocity distribution at runner inlet was identified as the further works.
The “Khoj” has been updated to estimate velocity component at different sections of the reference turbine. These sections include center of spiral casing, inlet and outlet of stay vanes, inlet and outlet guide vanes and inlet of runner. Separate codes are developed to compute the free vortex flow lines at the required sections of flow passages, starting from the center of spiral casing to the middle of runner blade. Table 1 presents the relevant analytical values for the reference turbine at BEP. With head exceeding 200 m and speed number 0.32 these turbine can be considered as a case of high head Francis units. Figure 1 shows the major dimensions of the actual turbine. It can be observed that the main dimensions from the analytical design are similar to that of actual turbine. Figure 2 shows the flow velocities at different sections of the actual turbine. It can be observed that the highest velocity inside the turbines is at the outlet of guide vanes, which exceeds 40 m/s at part load conditions. Relative velocity at the runner outlet also reaches close to 40 m/s at the full load condition. Such high velocities causes flow instability and also severe erosion of respective components under high sediment load.
1.2 Design of flow cascade
A symmetric section of reference turbine forms the flow cascade. Some of the researchers have considered a straight channel with guide vane, while others have considered a section of prototype or model turbine to investigate the passage flow conditions. Choiceof channel profile depends upon objectives and requirements of the measurements. For the present study,five guide vanes (GV) with four flow passages out of 24 passages of the GV is considered as a reference case. Two outer GV form as walls of cascade and three inner GV guide flow in the channel as in the case of prototype turbine. Similar design of test setup has also been developed by the past researchers to investigate the unsteady flow in the stator part of Francis turbine[9,27]. It is expected that such configuration with multiple GV would avoid the effects of walls on the flow field around the central GV. In the present study an alternative design of test setup with a single guide vane is also done, and its performance is compared with that of the case of three GV cascade.
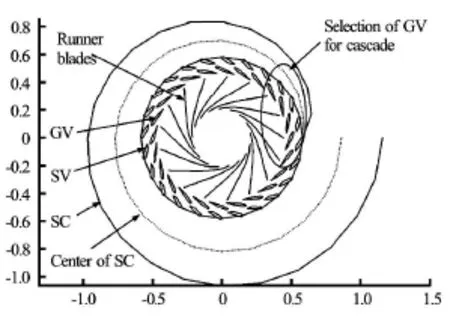
Fig.3 Analytical design and section for cascade
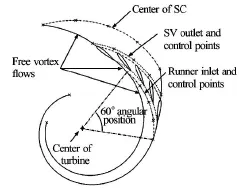
Fig.4 Wall profile for cascade flow
Figure 3 shows the layout of reference turbine and the section considered for the reference (3 GV)cascade. Five GV located at the end section of spiral casing (SC) are considered for this design. The choice of GV at the end section of SC will minimize the overall size of test setup. Figure 4 shows the profile of walls within the cascade with the selected five GV. For the reference case, walls defined by the profile of free vortex flow is considered from the center of spiral casing to the inlet of guide vane, from the outlet of guide vane to the inlet of runner and from the inlet of runner to the middle of runner blade. Profile of wall upstream of center of spiral casing up to the inlet ofcascade is designed to give same distribution of tangential and radial component of velocity at the center of spiral casing from the completely axial flow at the inlet of cascade (Fig.6). Stay vanes are not included as the part of cascade, as they are mainly for strengthening spiral casing and do not play significant role for hydraulic design[28]. Circular portion of spiral casing is replaced with flat plates with the same height as that of the span of guide vane. Thus, section from inlet to outlet of cascade is embedded between twoflat plates. This makes the design relatively simple and easy for manufacturing. However, such simplification would affect the flow conditions and hence the optimization of walls' profile is necessary. Optimization techniques are applied to redesign the profile from the inlet of cascade to the center of spiral casing,and from the inlet of runner to the outlet of cascade until the satisfactory flow conditions are obtained.
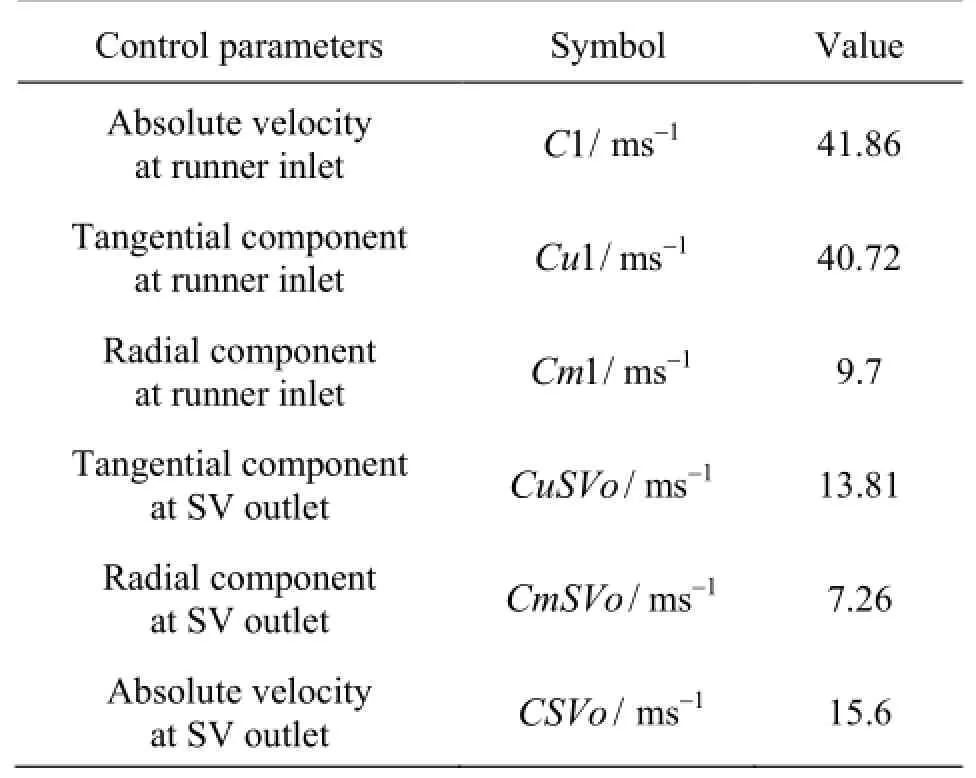
Table 2 Control parameters for design optimization
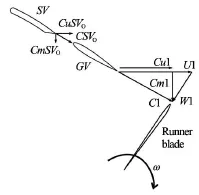
Fig.5 Velocity components in turbine
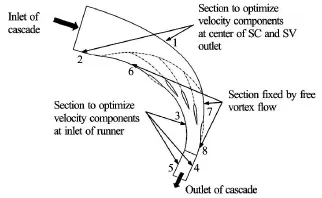
Fig.6 Reference design and sections for optimization
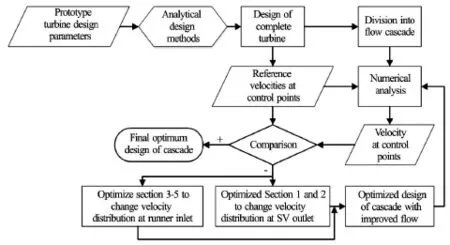
Fig.7 Design optimization flow chart
Table 2 lists the parameters and the target velocity, which are used to govern the optimization process. Tangential and radial components of velocity obtained from the analytical design of reference turbine are used as the control parameters. The difference in tangential component of velocity at the inlet and outlet of runner is proportionate to the hydraulic efficiency of the runner (Eq.(2)). Hence, this velocity component is identified as the most important parameter to govern the optimization process. Figure 5 shows the respective velocity components inside the turbine for the parameters listed in Table 2. Details of design techniques and calculation methods adopted for the analytical design of the complete turbine and estimation of the respective velocity components has been presented in Refs.[22,28].

Subscript 1 and 2 represents the parameters at the inlet and the outlet of runner respectively.
CFD analysis is conducted to validate the respective control parameters for the optimized designs. Equally spaced control points along the circumferential direction along the outlet of stay vane and along the inlet of runner are used for plotting the velocity profiles (Fig.4 and Fig.19). 3 GV cascade has 50 control points within its 60oof angular position between the flow channel walls as shown in Fig.4. Similarly, 1 GV cascade has 22 control points within its 30oof angular positions between the flow channel walls. Figure 6 shows the reference layout of 3 GV cascade and different sections identified for the design optimization process. The geometries of sections upstream of center of spiral casing (1, 2) and downstream of runner inlet (3-5), as shown in Fig.6, are optimized to get the optimum velocity distributions along the control points. Geometry of sections defined by free vortex flow (6-8)is not changed throughout the optimization process.
The overall optimization process is summarized with the flow chart in Fig.7. Same procedure is applied for the optimization of both 3 GV and 1 GV cascade. Different cases of optimized design of cascade are developed and CFD studies of each alternative design are conducted to evaluate the properties of the control parameters along the control points. The sections upstream of center of the spiral casing (1, 2)are adjusted to control velocity components at the outlet of stay vanes. The sections downstream of the runner inlet (3-5) are adjusted to control velocity components at the inlet of runner. Particularly it is observed that among others, Section 1 and Section 3(Fig.6) are very sensitive to velocity distribution at the outlet of stay vanes and at the inlet of runner respectively. Both of these sections being a longer curvature impart higher angular momentum to flow. This would lead to change in distribution of total velocity into its components as the flow progresses inside the channel.
Comparison of tangential velocity, obtained from the analytical design of turbine with that for alternative design of cascades, is the basis to accept or reject the alternative designs. Results of each successive optimization process are used to form hypothesis to develop the next optimized design. The final optimum design of the cascade test setup is identifed as the one,which yeilded the minimum differnece in tangential velocity component at the runner inlet position.
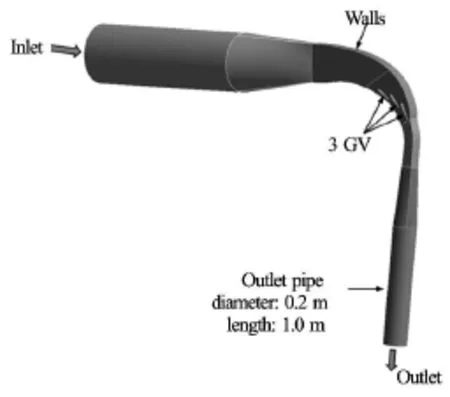
Fig.8 Flow domain for 3 GV cascade
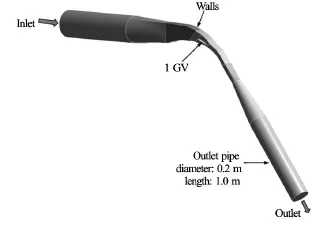
Fig.9 Flow domain for 1 GV cascade
2. Numerical model
Academic version of Ansys 15.0 is used for the numerical modelling, meshing, and simulation. Primary objective of the numerical study is to evaluate the flow field inside the guide vane cascade. For the mesh validation, velocity profiles at the stay vane outlet and runner inlet sections are compared with the velocity profiles available by analytical solution. Geometry and shape of the test section are optimized with coarse mesh (nodes<3× 10⁶). Then, more detailed validation of the optimum design of cascade is conducted with fine mesh(nodes>10× 106), and with different turbulence models. The geometry of cascade is prepared in Creo Parametric, refined with Ansys CAD model and then exported to meshing module. Figure 8 and Fig.9 and show the CAD model of the guide vane cascade created for 3 GV and 1 GV case respectively. Around the guide vanes, geometrical shape is similar to the existing turbine. To obtain uniform flow distribution, inlet section is extended by 5 times of inlet pipe diameter. Similarly, to avoid the influence of downstream boundary condition, outlet section is also extended by 5 times of outlet pipe diameter.
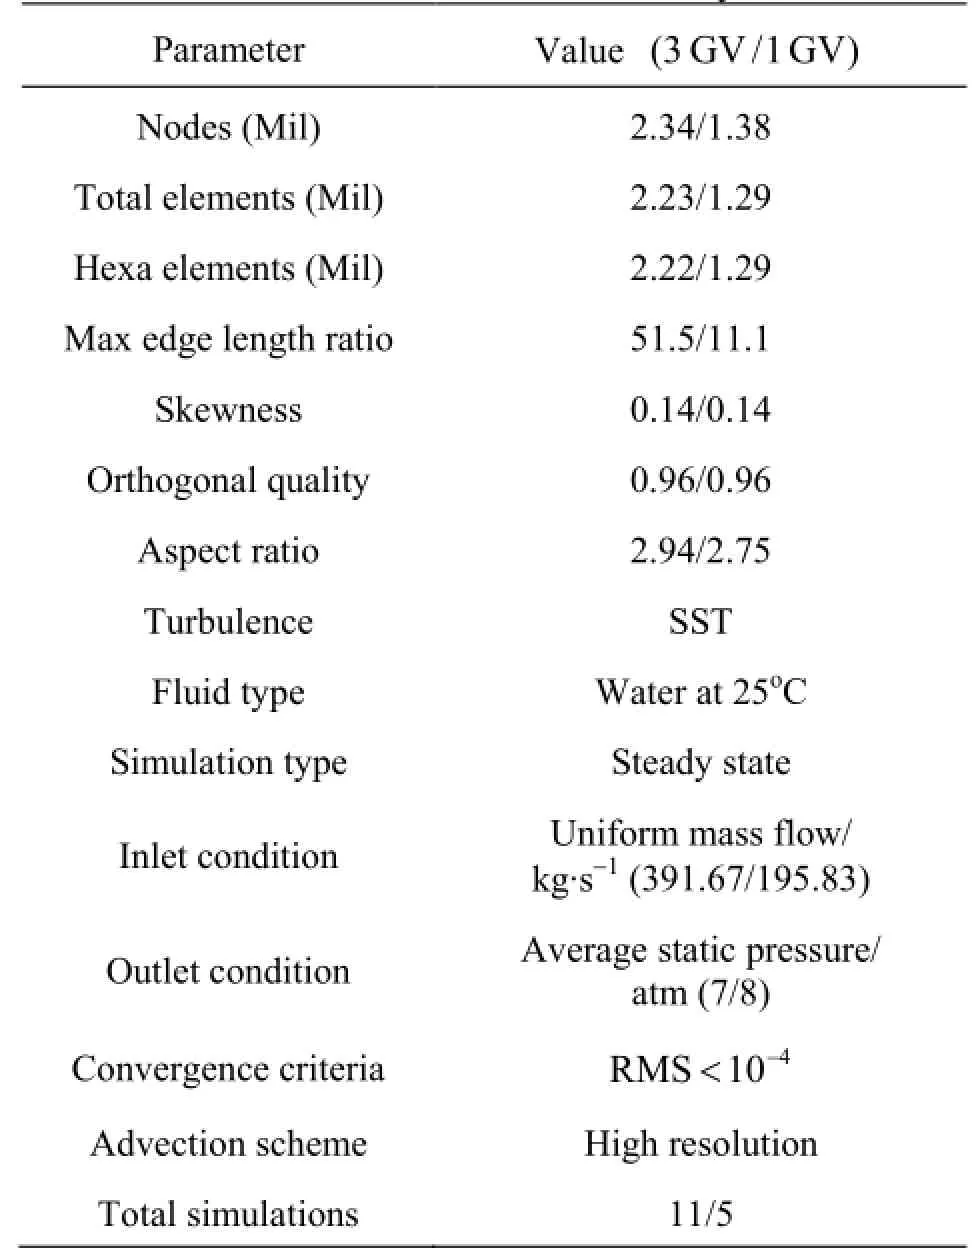
Table 3 Mesh statistics for coarse mesh study

Fig.10 Coarse mesh for 3 GV cascade
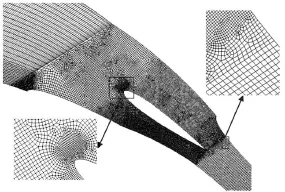
Fig.11 Coarse mesh for 1 GV cascade
The coarse mesh is generated with Ansys Meshing module. Created mesh density, quality, and selected flow physics, are shown in Table 3. Total 2.34×10⁶and 1.38×10⁶nodes are created in the computational domain of 3 GV and 1 GV, respectively. The computational domains include both hexahedral and quad elements. This combination allowed one to create relatively fine mesh around the guide vanes,where the expected flow velocity is high and boundary layer is thin. Smooth transition of 5 layers of inflation with growth rate of 1.2 is prescribed for capturing the effects of walls on the boundary layer flow. Features as “proximity and curvature”, “patch conformal”and “topology checking” are also applied. Patch conformal hybrid mesh with high grid density in the region of control points is obtained for the coarse mesh CFD studies. Quality of mesh obtained thus satisfies the necessities of the numerical simulation in Ansys CFX[29]. Mass flow inlet and pressure outlet boundary conditions are prescribed during the simulations. Total 11 simulations are performed for 3 GV cascade and 5 simulations are performed for 1 GV cascade. Figure 10 and Fig.11 show the parts of coarse mesh around the control points for 1 GV and 3 GV cascade respectively. In both cases high density mesh is generated around the guide vanes. It can also be observed that the transition of hexahedral mesh between different densities is patch conformed by creating prism and pyramids mesh elements.

Fig.12 Fine mesh for 1 GV cascade
Fine mesh in 1 GV cascade is created after the optimization of the cascade using coarse mesh. The cascade of fine mesh includes complete hexahedral mesh of 10×106nodes. Figure 12 shows the part of mesh generated for this study. The mesh quality is better than the quality obtained with coarse mesh. Dimensionless node position (y+)from the boundaries is varying from less than one to 300. The node position is adjusted according to the Reynolds number in the corresponding subdomains of the cascade. Since the flow is accelerating around the guide vanes, the maximum fine mesh is required around the guide vane. Similar methods of mesh generation is discussed in detailed in previous works by the authors[30].
To investigate the flow field in detail, six turbulence models and two discretization schemes are tested. Geometry of optimized design of 1 GV cascade is used for this study and also for the grid independency tests. The turbulence models namely, RNG k-ε,standardk-ε,k-ω, SST k-ω, eddy viscosity transport, and Reynolds stress model are used. High resolution and second order advection schemes are used for the discretization. Mathematical expressions of the turbulence models and discretization schemes are extensively discussed in the literatures[31], therefore it is not discussed in this paper. Figure 13 shows tangential component of velocity at the control points of runner inlet (C u1)and stay vane outlet (CuSVo)respectively for different cases of turbulence mode. The numerical values of tangential velocity(C u), at the stay vane outlet and runner inlet sections are compared with the ideal analytical values. Ideal velocity profile assumes tangential velocity of 14 m/s and 40.8 m/s at the stay vane outlet and the runner inlet,respectively. Trend of the numerical velocity distribution is found to be similar for all turbulence models. Velocity profile at the runner inlet shows sudden drop of velocity at the guide vane trailing edge from the maximum velocity of 43 m/s. This could be attributed to the wake flow leaving the guide vane. The standard k-εmodel showed velocity drop of 3 m/s whereas the Reynolds stress model showed drop less than 1 m/s. By comparing the results of high resolution and second order discretization schemes, both schemes showed almost similar variation across the width of the cascade. Velocity distribution at the stay vane outlet is almost the same for all selected turbulence models. No major difference among the turbulence models is observed except velocity profiles near the boundary (wall). RNGk-εmodel showed lower velocity than the SST andk-ωmodels.

Fig.13 Turbulence model tests at runner inlet
After comparing the different turbulence models,it is found that the simulation conducted with eddy viscosity transport equation and high resolution adve-ction scheme showed quite better results, for this flow conditions. The basis of comparison is the flow field along the position of stay vanes outlet and along the position of runner inlet. Velocity profile along the runner inlet with the wake from trailing edge of the guide vane is found to be the most sensitive case to compare between different turbulence models. Some of the models have over predicted the trailing edge wake and some of them under predicted the wake effect. Eddy viscosity model showed better resolution of the flow field and wake, therefore this turbulence model is considered for further validation of the numerical model.
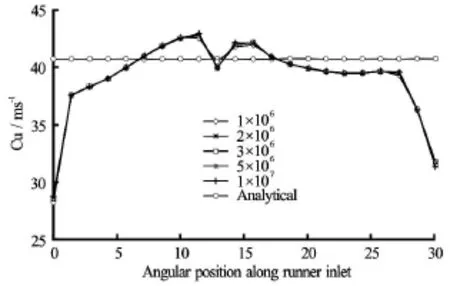
Fig.14 Mesh density test at runner inlet
To perform mesh independency tests, a hexahedral mesh with five densities is created starting from 106to 10×106nodes. Quality of the mesh is maintained uniform for all densities as stated in Table 3. Initially mesh is created with one million nodes, then 2×10⁶by increasing the scale factor of 2 and so on for successive mesh densities. Figure 14 shows the velocity profiles at the runner inlet position for different cased of mesh densities. All the gird density, except for the case of 106nodes, predicts the similar velocity profile. It is evident that 106node density is not sufficient enough to capture the wake phenomenon. Velocity profile at the stay vane outlet is almost same for all densities of the mesh indicating that there is minimum effect of spatial discretization on the upstream flow field. It is concluded that mesh with 2×10⁶node is found suitable for this study.
3. Results and discussions
Result of numerical simulations of the flow inside the alternative designs of cascade at the control points defined in Fig.4, is compared with that of the analytical values. For cross verification of final design, the numerical results from current study are compared with that from other experimental and CFD studies of similar nature. Results from the experimental study of the flow inside the optimum design of cascade is also presented as the validation of this study.
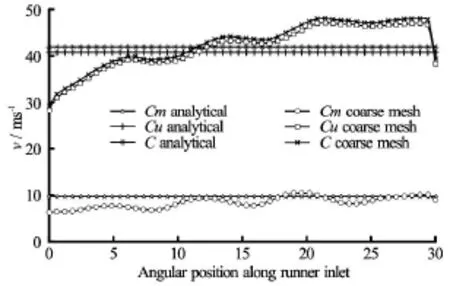
Fig.15 Runner inlet velocities for 3 GV reference design
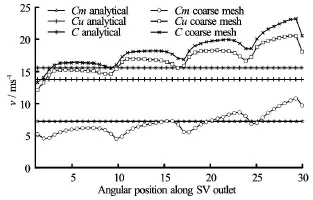
Fig.16 Stay vane outlet velocities for 3 GV reference design
3.1 Optimization for 3 GV cascade
The numerical study of the alternative designs of 3 GV cascade is done with the coarse mesh as discussed in Section 2. Only the results for the reference and the final optimized designs are discussed in this paper. Most of the results for intermediate designs fall in-between that of reference and optimized design. Figure 15 shows the velocity distributions along the inlet of runner for reference design of 3GV cascade. It can be observed that total velocity(C1)is lower than the analytical value towards the inner wall from the mid span of flow channel and higher than the analytical value towards outer wall from the mid span of flow. It can also be noticed that tangential component of velocity (C u1)is major contributor to this skewed velocity distribution. Figure 16 shows the velocity distributions along the outlet of stay vane. Similar pattern of skewed velocity distribution along the inlet of runner can also be observed at the outlet of stay vanes. Simplification in design of spiral casing and the channel downstream of runner inlet are the probable causes for this deviation. It is hypothesized that increasing the curvature of inner walls and reducing the same for outer walls can counter effect this skewed velocity distribution. Different curvatures for the walls and their combinations are introduced for changing the geometry of the inner and outer walls to come up with the final optimized design.

Fig.17 Runner inlet velocities for 3 GV optimized design
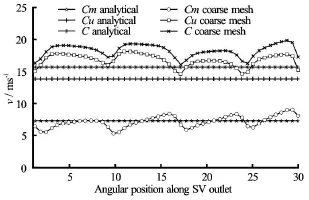
Fig.18 Stay vane outlet velocities for 3 GV optimized design
Figure 17 and Fig.18 show the velocity distributions along the inlet of runner and along the outlet of stay vanes respectively for the optimized design. It can be observed that skewed velocity distribution for both runner inlet and stay vane outlet position is normalized. The velocity components for the runner inlet position are lower than the analytical values and that are higher than the analytical values for stay vane outlet position. It is likely that viscous effects and frictional losses in the walls might have caused lower velocities at runner inlet compared to that of analytical values, which is for the ideal flow conditions. Alteration of geometries at the inlet section of cascade for desired velocity profile at the position of runner inlet,have effected flow area and hence the velocities at the stay vane outlet. Variation in the velocity at the control points 16, 28, and 41 correspond to the effect of guide vanes' leading and trailing edge. Velocity and pressure contours have shown large pressure gradient on the leading and trailing edge.
Figure 19 shows the contours for the velocity distribution along the section of reference design of 3 GV cascade. Regions of velocity higher than 45 m/s covers area downstream of runner inlet and the velocity upstream of stay vane outlet is below 20 m/s. Such velocity distribution requires high accelerated flow and hence demands the consecutive pressure distribution as shown in Fig.20. It is observed that pressure in the region upstream of stay vane is greater than 10 Pa, which is the limiting capacity of the laboratory. The pressure in the region downstream of runner inlet is lower than the atmospheric pressure,which induces the chances of cavitation in the region where the measurements are to be taken. These results further justify the need of design optimization of the cascade.
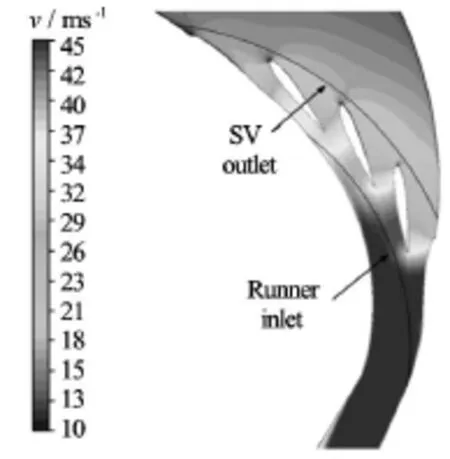
Fig.19 Velocity profile for reference 3 GV design
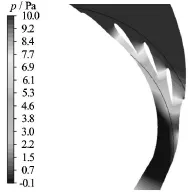
Fig.20 Pressure profile for reference 3 GV design
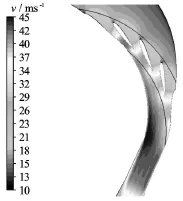
Fig.21 Velocity profile for optimized 3 GV design
Figure 21 and Fig.22 show the contours for the velocity distribution and the contours of pressure distribution along the section of optimized design of 3 GV cascade respectively. It can be observed that both velocity and pressure distributions have improved significantly. It satisfies the laboratory constraints while avoiding the cavitation in the regions wheremeasurements have to be conducted. Flow field around the middle guide vane may be considered as actual flow field in the turbine because flow around this guide vane is not largely affected by the boundaries.
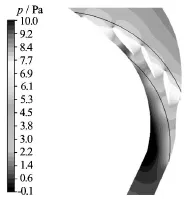
Fig.22 Pressure profile for optimized 3 GV design
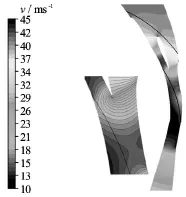
Fig.23 Velocity profile for optimum design of 1 GV cascade
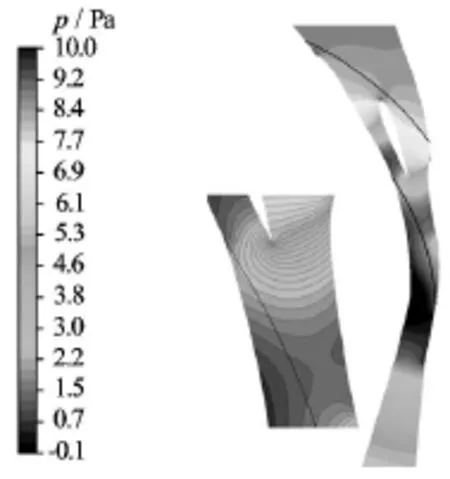
Fig.24 Pressure profile for optimum design of 1 GV cascade
3.2 Optimum design of 1 GV cascade
Similar design methods as for 3 GV cascade are used to develop the reference design of 1 GV cascade. Similar methods as for 3 GV are also used to optimize its geometry for desired velocity distributions along the control points. Coarse mesh is used to analyze alternative design options. The final optimized design is analyzed by fine mesh for cross verifications of the results. Only the results of final (optimum) design for 1 GV cascade is discussed in this paper. Figure 23 and Fig.24 show the velocity and pressure fields of the final design of 1 GV cascade. It can be seen that both velocity and pressure distribution has the matching pro-file with the theoretical distributions. Figure 25 compares tangential velocity(C u)distribution for the optimum design of 1 GV cascade obtained by both coarse and fine mesh with that of analytical values. It can be observed that both coarse mesh and fine mesh study show that velocity distribution along the control points are close to that of analytical values. As expected, fine mesh study predicts boundary wall effects and wake flow more precisely than that of coarse mesh. Accuracy in such effects as wakes and boundary layer flow etc. may not be necessary for the study of the effects of change in cascade geometry on the velocity distribution. This study shows that the results from coarse mesh study can be accepted for the analysis of design optimization of test setup as intended for this study.
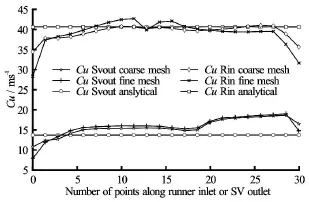
Fig.25 Velocity components for 1 GV optimum design from different methods
Difference between the original design of cascade(3 GV setup) without any optimization, and the optimum design of cascade (1 GV setup) can be made by comparing Fig.15 and Fig.25. It can be observed in Fig.15 that the original 3 GV design has higher difference in tangential component of velocity between the adjacent guide vanes at runner inlet. However, optimum 1 GV design (Fig.25) gives the almost constant tangential component of velocity at runner inlet from the adjacent guide vanes.
This analysis supports the argument that 1 GV cascade is able to produce the velocity profile at the position of inlet of runner comparable to that of an actual Francis turbine, excluding the rotor-stator interaction. However, with 1 GV cascade the correct flow conditions can be achieved only for a single operating point. Thus, all the measurements have to be done only at one operating point. For this study, best efficiency point (BEP) is considered for the design of cascade and for the consequent measurements.
3.3 Experimental validation
Development of the experimental test setup isbased on the layout of optimum design of 1 GV cascade. The main aim of the test setup is to measure the change in velocity and pressure distribution at the inlet of runner due to increasing leakage flow around guide vane. PIV methods is applied for capturing velocity field, from the position of stay vane outlet to the position of runner inlet. For the convenience of manufacturing, assembly and testing, the setup is divided into several parts as shown in Fig.26. The test section contains the test guide vane inside a plexiglass flow channel. The cover plates of test section have openings for excess to the laser sheet and camera exposure for PIV images as shown in Fig.27.
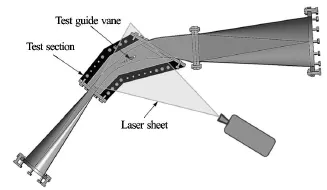
Fig.26 Cross section view of 1 GV test setup
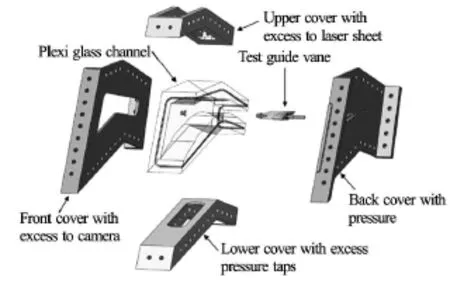
Fig.27 Exploded view of the test section
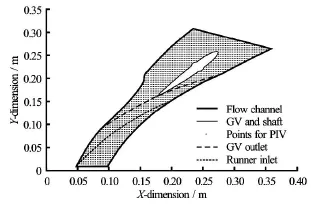
Fig.28 Test section and measurement points for PIV
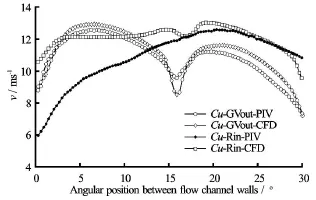
Fig.29 Comparison between PIV and CFD results
Experimental validation of the test setup is conducted at the facilities of the Waterpower laboratory in NTNU. The test setup is mounted in a closed loop system consisting of pump, flow meter, and a pressure tank. The reference test condition for this measurement is the total velocity(C)at the runner inlet being 12.45 m/s. Flow rate of 58.2 liter per second is necessary to build this velocity. Results from the PIV measurement of velocity distribution at position of outlet of guide vanes and at the inlet of runner is compared to that from the fine mesh CFD results for the same operating conditions. The PIV measurements is performed with a Dantec system. The pulsed light sheet with a thickness of 0.002 m, is generated by two double-cavity Nd-YAG lasers providing 120 mJ by pulse. The lighted field is visualized by a HiSense 2M CCD PIV cameras, with a series of paired images acquired at 150 µs and 4 Hz. Alignment of laser and camera with respect to the measurement plane is achieved with separate laser pointers. Fluorescent seeding particles, with a density of 1.016 kg/m3, refractive index of 1.52 and mean diameter of 55 µm are used during the measurements. The camera resolution is 1 280×1 024 pixels for a 0.35 m×0.40 m spatial domain. The camera exposition and its synchronization with laser and the image processing is done with a Dantec DynamicStudio 3.40 PIV specific processor. The image processing is carried out with 32-pixel resolution cross-correlation technique with 50% overlap. Figure 28 shows the field of view of the test section and circular position of turbine components. Velocity vectors are obtained along the mid span of the test setup from the PIV measurements, with the time-averaged value for 100 image pairs. Figure 29 shows the comparison between results from PIV measurements with that of CFD simulations for similar flow conditions. Tangential velocity distribution along the circular section of guide vane outlet and runner inlet, as shown in Fig.28, is used as basis for this comparison. It can be observed that CFD results at GV outlet position is very close to that of PIV results. However, as expected, CFD over predicts the wake with respect to PIV measurements. At the runner inletposition as well, CFD results is close to that of PIV measurements. Effects of wall due to 1 GV cascade,and also measurements being conducted at lower velocities, could be the reasons for the velocity form PIV measurements, at the runner inlet, being less uniform with respect to the analytical velocity profile as shown in Fig.29. With these PIV results, it can be inferred that 1 GV test setup can produce the velocity conditions comparable with the prototype turbine.
3.4 Comparison with similar studies
There are some past studies for the flow analysis with the use of cascade guide vane setup. Comparison with the methods adopted for the design of such setup could not be done as the available literatures does not discuss the design methods in detail. Most of studies are focused on the measurements of wake behind the guide vane and on the prediction of rotor-stator interaction. Antonsen[32]has conducted measurements of wake flow in a 5 GV cascade setup for a high head Francis turbine. He has also compared the results with the CFD study. Figure 30 shows comparison of LDA measurements and CFD studies of wake behind the guide vane of a Francis turbine from his study. The measurements were done along the direction normal to the wake and not along the runner inlet as for this study. The profile of wake from his study can be compared with that estimated by CFD simulations for optimized design of 1 GV cascade. The constant velocity contours in zoomed section (Fig.23) show the formation and dissipation of wake behind the guide vanes that also matches to the results from Antonsen(Fig.30).
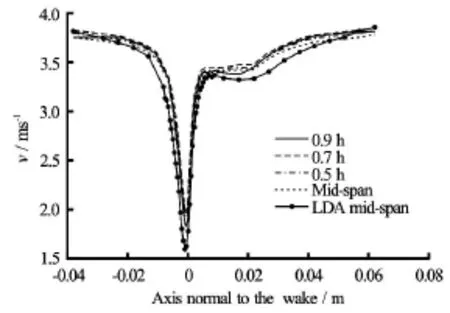
Fig.30 LDV and CFD study of wake behind guide vane[32]
Larsson[9]has conducted the measurement of velocity components along the circular section in the vane less gap between the outlet of guide vanes and the inlet of runner. He has also compared the experimental results with different numerical simulations. Figure 31 shows the distribution of tangential velocity along the vane less gap for one guide vane pitch in circumferential direction. He has verified this result with the actual measurements of velocity in vane less space in a model turbine. His CFD simulations, both with coarse mesh and fine mesh, were not able to predict the wake flow accurately. It can be observed that the profile of tangential velocity at GV outlet measured by Larsson is similar to that predicted for 1 GV cascade with the PIV measurements and CFD study shown in Fig.29. Simulations with the coarse mesh for pressure distribution in the vane less space done by Larsson is presented in Fig.32. Profile of pressure distribution obtained from his result is comparable with that for the optimum design of 1 GV cascade for this study, as presented in Fig.24. Due to difference in pressure along the pressure side and suction side of GV, runner experiences marginal increase in pressure as it passes from suction side of one GV to the point of wake interactions, and again experiences marginal reduction in pressure as it reaches to the suction side of adjacent GV. This pressure fluctuation also has its effects on velocity profile along the inlet of runner from the suction side of one GV to another. Hence,runner passes through the contours of different velocity magnitudes as it crosses one GV to another. This phenomenon can be observed in Fig.23, Fig.13 and Fig.14. Thus it can be accepted that the velocity profiles created by 1 GV cascade at the runner inlet is much closer to the prototype Francis turbine operating at BEP.
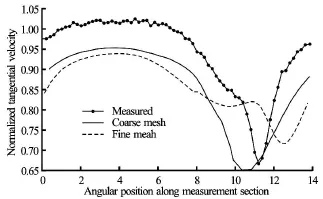
Fig.31 LDA and CFD measurements of velocity component behind GV[9]
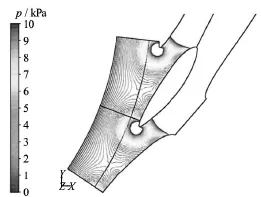
Fig.32 CFD study of pressure distribution behind GV[9]
4. Conclusions
This paper suggests an approach to design a cascade setup for investigating the flow in stator part of low speed number Francis turbines. Several researchers have conducted theoretical, numerical and experimental studies to investigate flow phenomenon inside Francis turbine with different objectives. Stationary cascade with single or multiple guide vanes is often used to study flow in the stator part of Francis turbine. Details of design methods adopted for development of such test setups are not found to be published in available literatures. It is also perceived that none of the measurements in laboratory setup has been done for the prototype operating conditions.
This paper discussed the details of the methods used to design and optimize a cascade test setup for studying the effects of leakage flow between guide vanes and its walls in a low specific speed Francis turbine. Analytical methods are used to design a complete reference turbine. Flow cascade with three guide vanes and one guide vane at the end section of spiral casing are selected as alternative design options. Computed velocity profiles through analytical method are compared with the CFD results to identify the best design option. The design optimization is carried out using coarse mesh and total 11 and 5 simulations are conducted for 3 GV and 1 GV cascade respectively. Furthermore, to investigate effects of spatial discretization and turbulence models, detailed mesh independency study are also conducted. It is found that the mesh with 2×10⁶nodes and eddy viscosity transport equation and high resolution discretization scheme provide good results. Final simulation of the optimum design of test setup is conducted using the verified numerical model. The optimum design is fabricated and experimental validation of flow conditions with respect to CFD and analytical calculations are made.
With this study it is concluded that optimized design of both 3 GV and 1 GV cascade can create the similar flow conditions at the position of inlet of runner as that in the case of actual turbine. Due to manufacturing and testing easiness, 1 GV cascade is selected for the development of test setup. Results of measurements from this setup can be compared directly to the case of prototype turbine at BEP conditions. It is also concluded that, for flow analysis and design optimization of problems, CFD studies with relatively coarse mesh can give reliable results.
Acknowledgments
Authors would like to thank Mr. Frode Kjøsnes for his supports in CFD study with fine mesh, and Ms. Linda Haugvaldstad for her support in stress analysis in the test section of the setup.
References
[1] DARMAWI, SIPAHUTAR R. and BERNAS S. M. et al. Renewable energy and hydropower utilization tendency worldwide[J]. Renewable and Sustainable Energy Reviews, 2013, 17: 213-215.
[2] STERNBERG R. Hydropower's future, the environment,and global electricity systems[J]. Renewable and Sustainable Energy Reviews, 2010, 14(2): 713-723.
[3] FLORES E., BORNARD L. and TOMAS L. et al. Design of large Francis turbine using optimal methods[J]. IOP Conference Series: Earth and Environmental Science,2012, 15(2): 022023.
[4] BREKKE H. Hydraulic design strategy for Francis turbines[J]. International Journal on Hydropower and Dams,1996, 3(3): 38-42.
[5] XIAO Y., WANG Z. and YAN Z. et al. Experimental and numerical analysis of pressure pulses characteristics in a Francis turbine with partial load[J]. IOP Conference Series: Earth and Environmental Science, 2010, 12(1): 012023.
[6] MAGNOLI M. V., SCHILLING R. Numerical simulation of pressure pulsationsin Francis turbines(GOURBESVILLE P., CUNGE J. and CAIGNAERT G. Advances in hydroihformations)[M]. Singapore: Springer, 2014, 389-403.
[7] THAPA B. S., DAHLHAUG O. G. and THAPA B. Sediment erosion in hydro turbines and its effect on the flow around guide vanes of Francis turbine[J]. Renewable and Sustainable Energy Reviews, 2015, 49: 1100-1113,
[8] RUCHONNET N., NICOLET C. and AVELLAN F. Onedimensional modeling of rotor stator interaction in Francis pump-turbine[C]. Proceedings of the 23rd IAHR Symposium on Hydraulic Machinery and Systems. Yokohama, Japan, 2006.
[9] LARSSON C. Experimental and theoretical analysis of inlet flow of a Francis turbine runner[D]. Doctoral Thesis, Trondheim, Norway: Norwegian University of Science and Technology, 2003.
[10] QIAN R. Flow field measurements in a stator of a hydraulic turbine[D]. Doctoral Thesis, Quebec, Canada: Laval University, 2008.
[11] KOBRO E. GAMBOA A. and BLOCH R. et al. Onboard pressure measurement in high head Francis prototype runners[C]. 3rd IAHR International Meeting of the Work Group on Cavitation and Dynamic Problems in Hydraulic Machinery and Systems. Brno, Czech Republic, 2009, 14-16.
[12] XIAO Ye-xiang, WANG Zhong-wei and ZHANG Jin et al. Numerical predictions of pressure pulses in a Francis pump turbine with misaligned guide vanes[J]. Journal of Hydrodynamics, 2014, 26(2): 250-256.
[13] BARIO F., BERAL C. Boundary layer measurements on the pressure and suction sides of a turbine inlet guide vane[J]. Experimental Thermal and Fluid Science, 1998,17(1-2): 1-9.
[14] SCHABOWSKI Z., HODSON H. The Reduction of over tip leakage loss in unshrouded axial turbines using winglets and squealers[J]. Journal of Turbomachinery, 2007,136(4): 663-675.
[15] ZOBEIRI A., AUSONI P. and AVELLAN F. et al. How oblique trailing edge of a hydrofoil reduces the vortexinduced vibration[J]. Journal of Fluids and Structures,2012, 32(3): 78-89.
[16] FINSTAD P. H. E., KJELDSEN M. and ARNDT R. E. Characterizing Rotor-Stator interaction-RSI in hydrofoil wake using CFD and experimentally obtained wake flow fields[C]. 14th International Symposium on Transport Phenomena and Dynamics of Rotating. Trondheim,Norway, 2012.
[17] BREKKE H. Hydraulic turbines: Design, erection and operation[M]. Trondheim, Norway: Norwegian University of Science and Technology (NTNU) publications,2001.
[18] PRADHAN P. M. S., DAHLHAUG O. G. and JOSHI P. N. et al. Sediment and efficiency measurements at Jhimruk Hydropower Plant-Monsoon 2003[R]. Report from Hydro Lab, Nepal, 2004.
[19] GJOSATER K. Hydraulic design of Francis turbine exposed to sediment erosion[D]. Master Thesis,Trondheim, Norway: Norwegian University of Science and Technology, 2011.
[20] THAPA B. S. Hydraulic design of Francis turbine to minimize sediment erosion[D]. Master Thesis, Dhulikhel,Nepal: Kathmandu University, 2012.
[21] ELTVIK M. Sediment erosion in Francis turbines[D]. Doctoral Thesis, Trondheim, Norway: Norwegian University of Science and Technology, 2013.
[22] THAPA B. S., ELTVIK M. and GJØSÆTER K. et al. Design optimization of Francis runners for sediment handling[C]. Fourth International Conference on Water Resources and Renewable Energy Development in Asia. Chiang Mai, Thailand, 2012.
[23] THAPA B. S., GJOSATER K. and ELTVIK M. et al. Effects of turbine design parameters on sediment erosion of Francis runner[C]. 2nd International Conference on Developments in Renewable Energy Technology. Dhaka,Bangladesh, 2012, 167-171.
[24] THAPA B. S., THAPA B. and ELTVIK M. et al. Optimizing runner blade profile of Francis turbine to minimize sediment erosion[J]. IOP Conference Series: Earth and Environmental Science, 2012, 15(3): 032052.
[25] CHITRAKAR S., CERVANTES M. and THAPA B. S. Fully coupled FSI analysis of Francis turbines exposed to sediment erosion[J]. International Journal of Fluid Machinery and Systems, 2014, 7(3): 101-109.
[26] RAJKARNIKAR B., NEOPANE H. P. and THAPA B. S. Development of rotating disc apparatus for test of sediment-induced erosion in francis runner blades[J]. Wear,2013, 306(1-2): 119-125.
[27] CHEN X. Theoretical and experimental study of flow through the double cascade of a Francis turbine[D]. Doctoral Thesis, Trondheim, Norway: Norwegian University of Science and Technology, 1992.
[28] WEI Z., FINSTAD P. H. and OLIMSTAD G. E. et al. High pressure hydraulic machinery[R]. Trondheim,Norway: Norwegian Institute of Science and Technology,2009.
[29] ANSYS, Ansys 16.0 release documentation. Theory and modelling guide[M]. Canonsburg, PA, USA: ANSYS Inc.,Southpointe, 2600 ANSYS Drive, 2015.
[30] TRIVEDI C., CERVANTES M. J. and DAHLHAUG O. G. et al. Experimental investigation of a high head Francis turbine during spin-no-load operation[J]. Journal of Fluids Engineering, 2015, 137(6): 061106.
[31] FERZIGER J. H., PERIĆ M. Computational methods for fluid dynamics[M]. Berlin, Germany: Springer, 2002.
[32] ANTONSEN Ø. Unsteady flow in wicket gate and runner with focus on static and dynamic load on runner[D]. Doctoral Thesis, Trondheim, Norway: Norwegian University of Science and Technology, 2007.
10.1016/S1001-6058(16)60648-0
June 22, 2015, Revised November 27, 2015)
* Biography: Biraj Singh THAPA (1979-), Male,Ph. D. Candidate
2016,28(4):676-689
- 水动力学研究与进展 B辑的其它文章
- Prediction of oil-water flow patterns, radial distribution of volume fraction,pressure and velocity during separated flows in horizontal pipe*
- A study of hybrid prediction method for ship parametric rolling*
- Numerical simulation of flow characteristics for a labyrinth passage in a pressure valve*
- Effect of head swing motion on hydrodynamic performance of fishlike robot propulsion*
- A parameter analysis of a two-phase flow model for supersaturated total dissolved gas downstream spillways*
- Motion and deformation of immiscible droplet in plane Poiseuille flow at low Reynolds number*