
High-precision RCS measurement of aircraft's weak scattering source
2016-11-23 06:12HuChufengLiNanjingChenWeijunZhangLinxi
CHINESE JOURNAL OF AERONAUTICS 2016年3期
Hu Chufeng,Li Nanjing,Chen Weijun,Zhang Linxi
Science and Technology on UAV Laboratory,Northwestern Polytechnical University,Xi'an 710072,China
High-precision RCS measurement of aircraft's weak scattering source
Hu Chufeng*,Li Nanjing,Chen Weijun,Zhang Linxi
Science and Technology on UAV Laboratory,Northwestern Polytechnical University,Xi'an 710072,China
The radar cross section(RCS)of weak scattering source on the surface of an aircraft is usually less than-40 dBsm.How to accurately measure the RCS characteristics of weak scattering source is a technical challenge for the aircraft's RCS measurement.This paper proposes separating and extracting the two-dimensional(2D)reflectivity distribution of the weak scattering source with the microwave imaging algorithm and spectral transform so as to enhance its measurement precision.Firstly,we performed the 2D microwave imaging of the target and then used the 2D gating function to separate and extract the reflectivity distribution of the weak scattering source.Secondly,we carried out the spectral transform of the reflectivity distribution and eventually obtained the RCS of the weak scattering source through calibration.The prototype experimental results and their analysis show that the measurement method is effective.The experiments on an aircraft's low-scattering conformal antenna verify that the measurement method can eliminate the clutter on the surface of aircraft.The precision of measuring a-40 dBsm target is 3–5 dB better than the existing RCS measurement methods.The measurement method can more accurately obtain the weak scattering source's RCS characteristics.
1.Introduction
Both theoretical calculations and experimental measurements show that the aircraft's different positions consist of many local scattering sources in the high-frequency range.1,2The echoes of the local scattering sources form the total scatteredfield of a target.The scattered field produced by a weak scattering source is several orders of magnitude lower than that produced by a strong scattering source,and therefore can be well ignored in the normal design of an aircraft.However,the overall radar cross section(RCS)of a stealth aircraft is rather small.At this point,the contribution of the weak scattering source to the overall RCS increases greatly;in particular,its effect is very obvious under certain polarizations or attitude angles.For these reasons,the study of the RCS characteristics of weak scattering sources and their scattering mechanisms is of far-reaching importance for the design of a stealth aircraft.
The RCS measurement is one of the methods for obtaining the scattering characteristics of a target.3The measurement of a target can not only help us understand the basic scattering mechanism but also obtain massive characteristic data of the target.Its RCS value is ultimately determined by measurement results.When the order of magnitude of its RCS value is rather big,the requirements for measurement system and measurement method are rather low,and the rather accurate results can be obtained with the normal RCS measurement method.4But when the order of magnitude of the RCS value of the target to be measured is rather low,for example,measuring the target whose RCS value is-40 dBsm requires that the error is2 dB and that the background noise level reaches-60 dBsm5,the measurement environment in an anechoic chamber cannot satisfy such requirements.Thus,the precise measurement of a weak scattering source has higher requirements for measurement system and measurement method.To improve the measurement environment,Ref.6designed a low-scattering foam column,enabling the measurement background environment ranging from 1.5 to 40 GHz to reach-50 dBsm and providing support for weak scattering source measurement.Refs.7,8proposed two RCS measurement methods to separate background environment from target signals,being favorable for the precise measurement of a weak scattering source.But they are difficult to apply these methods to an aircraft's weak scattering source measurement.Because the background for weak scattering source study is rather sensitive,there are few papers in the open literature on the topic related to an aircraft.Refs.9,10explained the importance of this type of measurement data for an aircraft's electromagnetic characteristic control and prediction.Refs.11,12gave the measurement results on edge diffraction source and slit diffraction source,demonstrated that this type of target is installed on the low-detectable diamond components and emphasized that the pertinent measurement data are scarce.Refs.13,14designed different measurement models for slit target and step target and performed experimental studies.Refs.15,16proposed the methods of image editing reconstruction,which are used for removing the clutter of background.The image of background is subtracted from the image of target with background.However,it is difficult to eliminate the effect of background when the scattering of target is very low.
Because the weak scattering source mostly exists on the surface of an aircraft,the scattering from the airframe envelope is the major cause for measurement errors.However,the normal RCS measurement method cannot distinguish the RCS characteristics contributions made by the airframe envelope and weak scattering source.This paper proposes a method for extracting the weak scattering source reflectivity distribution on the surface of an aircraft through microwave imaging and reversely developing its RCS contributions.The method uses a turntable's 2D microwave imaging algorithm to separate and extract the weak scattering source reflectivity distribution on the airframe envelope and then uses the wave spectrum theory to transform the spatial distribution spectra,thus obtaining the weak scattering source's own RCS contributions after prototype comparison.The experiments verify that in a normal anechoic chamber,the error of measuring a standard sphere of-40 dBsm with the method is only 1 dB.After imaging several metal spheres,the image of one of the metal spheres is extracted and then its RCS is reversely developed and compared with that of the sphere directly measured,with the measurement error being less than 0.5 dB.Finally,a low-scattering conformal antenna is used to verify the measurement;the verification results indicate that the measurement accuracy is 3–5 dB better.
2.Measurement system construction and measurement method
2.1.Stepped-frequency wideband RCS measurement system
To obtain longitudinal high range resolution,we use the stepped-frequency wideband signal.17The signal is a continuous wave signal with changes in equal-interval frequency and usually transmitted and received with the vector network analyzer in an anechoic chamber.The measurement of a target is carried out by transmitting stepped-frequency signals,thus obtaining its frequency response,whose inverse fast Fourier transform(IFFT)produces the high resolution time domain response of the target.The measurement system construction is shown in Fig.1.
The target to be measured is placed in the quiet zone of an anechoic chamber.The vector network analyzer transmits the stepped-frequency signal,which is amplified by a power amplifier and then transmitted and received by the wideband horn antenna.The measurement is carried out with the quasimonostation mode.There are coupling signals between reception antenna and transmission antenna(about-20 dBsm at the X band).To minimize the influence of the coupling signals on measurement accuracy,we placed some wave-absorption materials between the two antennas during the measurement.The computer controls the rotational speed and sampling interval of the turntable through the network wire.While rotating,the turntable transmits a trigger signal to the vector network analyzer,which then starts to respectively measure the frequency domain data of the background environment,the target to be measured and the calibration body at the same initial angle.The intermediate frequency bandwidth of a vector network analyzer is set to be 1 kHz,and its dynamic range is around 100 dB.
2.2.Microwave imaging algorithm
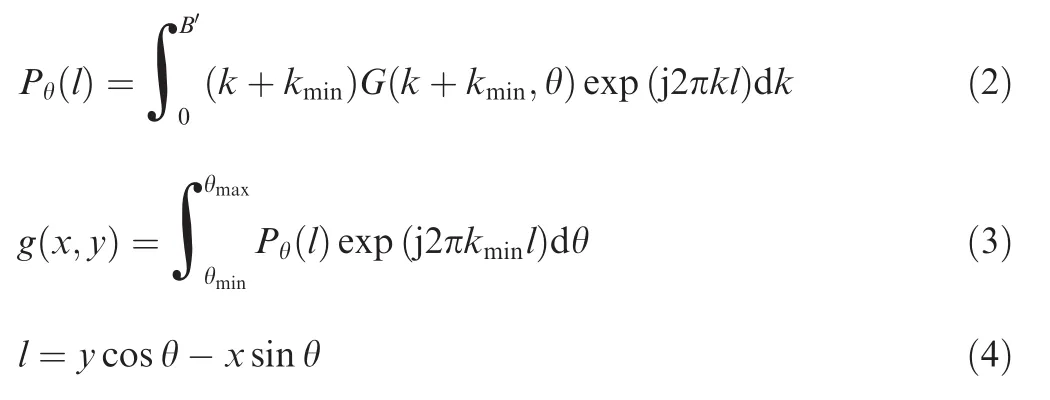
The high resolution imaging in an anechoic chamber often uses a turntable mode.18The wideband signal transmission produces range resolution,while the cross range resolution is achieved by the turntable rotation.The microwave imaging algorithm is similar to the chroma to graph imaging in medicine.19The data obtained with the measurement at a certain angle are used to reconstruct the projection of a target's reflectivity distributed on a plane.The relationship between field and image obtained with measurement is given in Eq.(1)20:

where the x-y coordinate system is a set of coordinates fixed in a target,and its origin is at the centre of turntable and changes with the change in the target;g(x,y)is the image of the target to be measured;k is the spatial frequency and θ is the azimuth angle.
Because the integral limit in Eq.(1)does not satisfy the IFFT conditions,the algorithm implementation needs to shift the k frequency to kmin.If B′=kmax-kminand B′is the band-width of the spatial frequency k,then the following20is obtained:

Fig.1 Diagram of measurement system.
Because the measurement system transmits stepped frequency signal,their frequency points are discrete.According to the Nnumber of sampling frequency points, we discretize k.If k=nB′/N,n=0,1,...,N-1,then Eq.(2)is rewritten as

The projection linelis equidistantly discretized according to range resolution lm=m.c/2B=m/B′,m=0,1,...N-1.If Gθ(n)=(B′.n/N+kmin)G(n,θ),then Eq.(5)is expressed as

Pθ(lm)is the projection value obtained from different lmpoints.The projection linelin the process of integration changes with the θ angle.For g(x,y)at any space point,each θ corresponds to a different l.Therefore,Pθ(l)is the projection value obtained from the discrete l,and Pθ(l)needs to be obtained by interpolating Pθ(lm).The interpolation formulas are as follows:

After the interpolation,the angle is integrated;the integration formula is given as follows:

The three steps of IFFT,interpolation and angle integration constitute the microwave imaging algorithm.We then obtained the 2D image of the target to be measured.We used the Hamming window to process the images;as a result,their resolution decreases,around one half smaller than the theoretical resolution.
2.3.Weak scattering source image extraction and RCS calibration
To obtain the RCS of a weak scattering source,first and foremost,its reflectivity distribution is extracted from the 2D image of the target to be measured.Depending on the geometrical region where the weak scattering source is located,we use a 2D circular gating function21whose radius r is a to extract the reflectivity distribution within the geometrical region,and set the reflectivity distribution outside the region as zero,thus forming the following new 2D image:

We perform the 2D Fourier transform of the new 2D image,thus obtaining the spectral domain data of the weak scattering source.

where Kxand Kyare the horizontal axis and longitudinal axis of the spectral domain respectively;x1,x2,y1and y2correspond to the upper and lower limits of the x-y plane where g1(x,y)is located.
The interpolation of G1(Kx,Ky)produces the spectral domain data G1(f,θ)that change with frequency and angle.The interpolation formulas are given in the following:
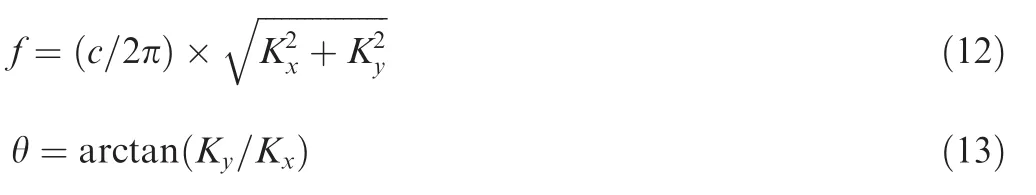
where c is the velocity of light.Similarly,we measure a metal sphere whose RCS is already known to obtain its 2D image g0(x,y).We perform the 2D Fourier transform of the 2D reflectivity distribution,obtaining the spectral domain data G0(f,θ)of the metal sphere that change with frequency and angle;the comparison of the spectral domain data of the weak scattering source with those of the metal sphere eventually produces the RCS of the weak scattering source:

where σsis the RCS of metal sphere.
3.Simulation results


Fig.2 Enhancement effectiveness of image extraction method.
The RCS measurement error level is mainly determined by the echo power ratio between target and background,and the resulted maximal error is expressed as follows:where ε denotes the echo power ratio between target and background environment.The formula indicates that when the echo power of the target is 10 dB higher than that of the background,the resulted error is 6 dB.
To verify the enhancement effectiveness of the image extraction method,we simulated a metal sphere whose diameter is 150 mm and used a metal sphere whose diameter is 50 mm to simulate the interference of the background environment.When the metal sphere whose diameter is 50 mm is present,the synthetic RCS of the two balls produce a rather big oscillation,whose magnitude reaches 6 dB,satisfying the formula for measuring errors.The image extraction method was used to form the images of the two metal spheres and then extract the 2D image of the metal sphere whose diameter is 150 mm.Then the spectral transformation and calibration of the images were performed,thus obtaining the RCS curves as shown by the dotted lines in Fig.2.The figure shows that the RCS oscillation of the metal sphere is already less than 1 dB.The simulation results thus show that the image extraction method can eliminate the interference of the background environment,with the measurement accuracy being 5 dB better than before.
4.Experimental verification
4.1.Verifying RCS measurement precision with microwave imaging
In an anechoic chamber,we constructed the measurement system as shown in Fig.1.We first measured a metal sphere whose diameter is 11 mm,as shown in Fig.3(a);its theoretical RCS is-40 dBsm.The frequency range for measurement is 8 to 12 GHz;the frequency interval is 5 MHz.The range of rotational angle is 360°the angle interval is 0.2°.The microwave imaging algorithm in Section 2 is used to process the echoes of the metal sphere,obtaining the 2D image of the target as shown in Fig.3(b).
The 2D image is used to retrieve the RCS of the metal sphere,and then the RCS whose measurement frequency is 10 GHz is selected,as shown in Fig.4.The figure shows that the precision of the RCS measurement with the microwave imaging is less than 1 dB,indicating that the method for retrieving RCS with the microwave imaging is feasible.

Fig.3 Metal sphere and its 2D image.

Fig.4 RCS at 360°retrieved by microwave imaging.
4.2.Experimental results of RCS retrieved by image extraction
The objects to be measured include five metal spheres whose diameter is 53 mm(see Fig.5(a))and one metal sphere whose diameter is also 53 mm(see Fig.5(b));the measurement frequency range and frequency interval are the same as above.The rotational angle is-25°to 25°;the angle interval does not change.In one case,first,the five metal spheres are imaged;next,the 2D reflectivity distribution of the metal sphere in the same position as Fig.5(b)is extracted and finally its RCS is retrieved.In another case,the metal sphere in Fig.5(b)is tested by the normal RCS measurement.After calibrating them with the metal sphere whose diameter is 150 mm,we compared the differences in the RCS of the single metal sphere between the two cases.
As shown in Fig.6(a),first,the 2D images of the five metal spheres are obtained,and then the reflectivity distribution of the metal sphere located at the upper-right corner is extracted,as shown in Fig.6(b).
The spectral transform and calibration of the extracted reflectivity distribution of one metal sphere produce its RCS,as shown by the solid line in Fig.7.Similarly,the result of the metal sphere in Fig.5(b)with normal RCS measurement is given by the dotted line in Fig.7.The figure shows that in an angular domain for measurement,the retrieved RCS with image extraction and the normal RCS measurement have a difference of only less than 0.5 dB,indicating that the method for extracting a local scattering source through imaging and then retrieving its RCS is feasible.
4.3.Experimental verification of low-scattering conformal antenna of an aircraft
The typical weak scattering sources of an airplane and their scattering mechanisms are shown in Table 1.To enhance the stealth performance of an aircraft,conformal antenna is designed.

Fig.5 Five metal spheres and one metal sphere.
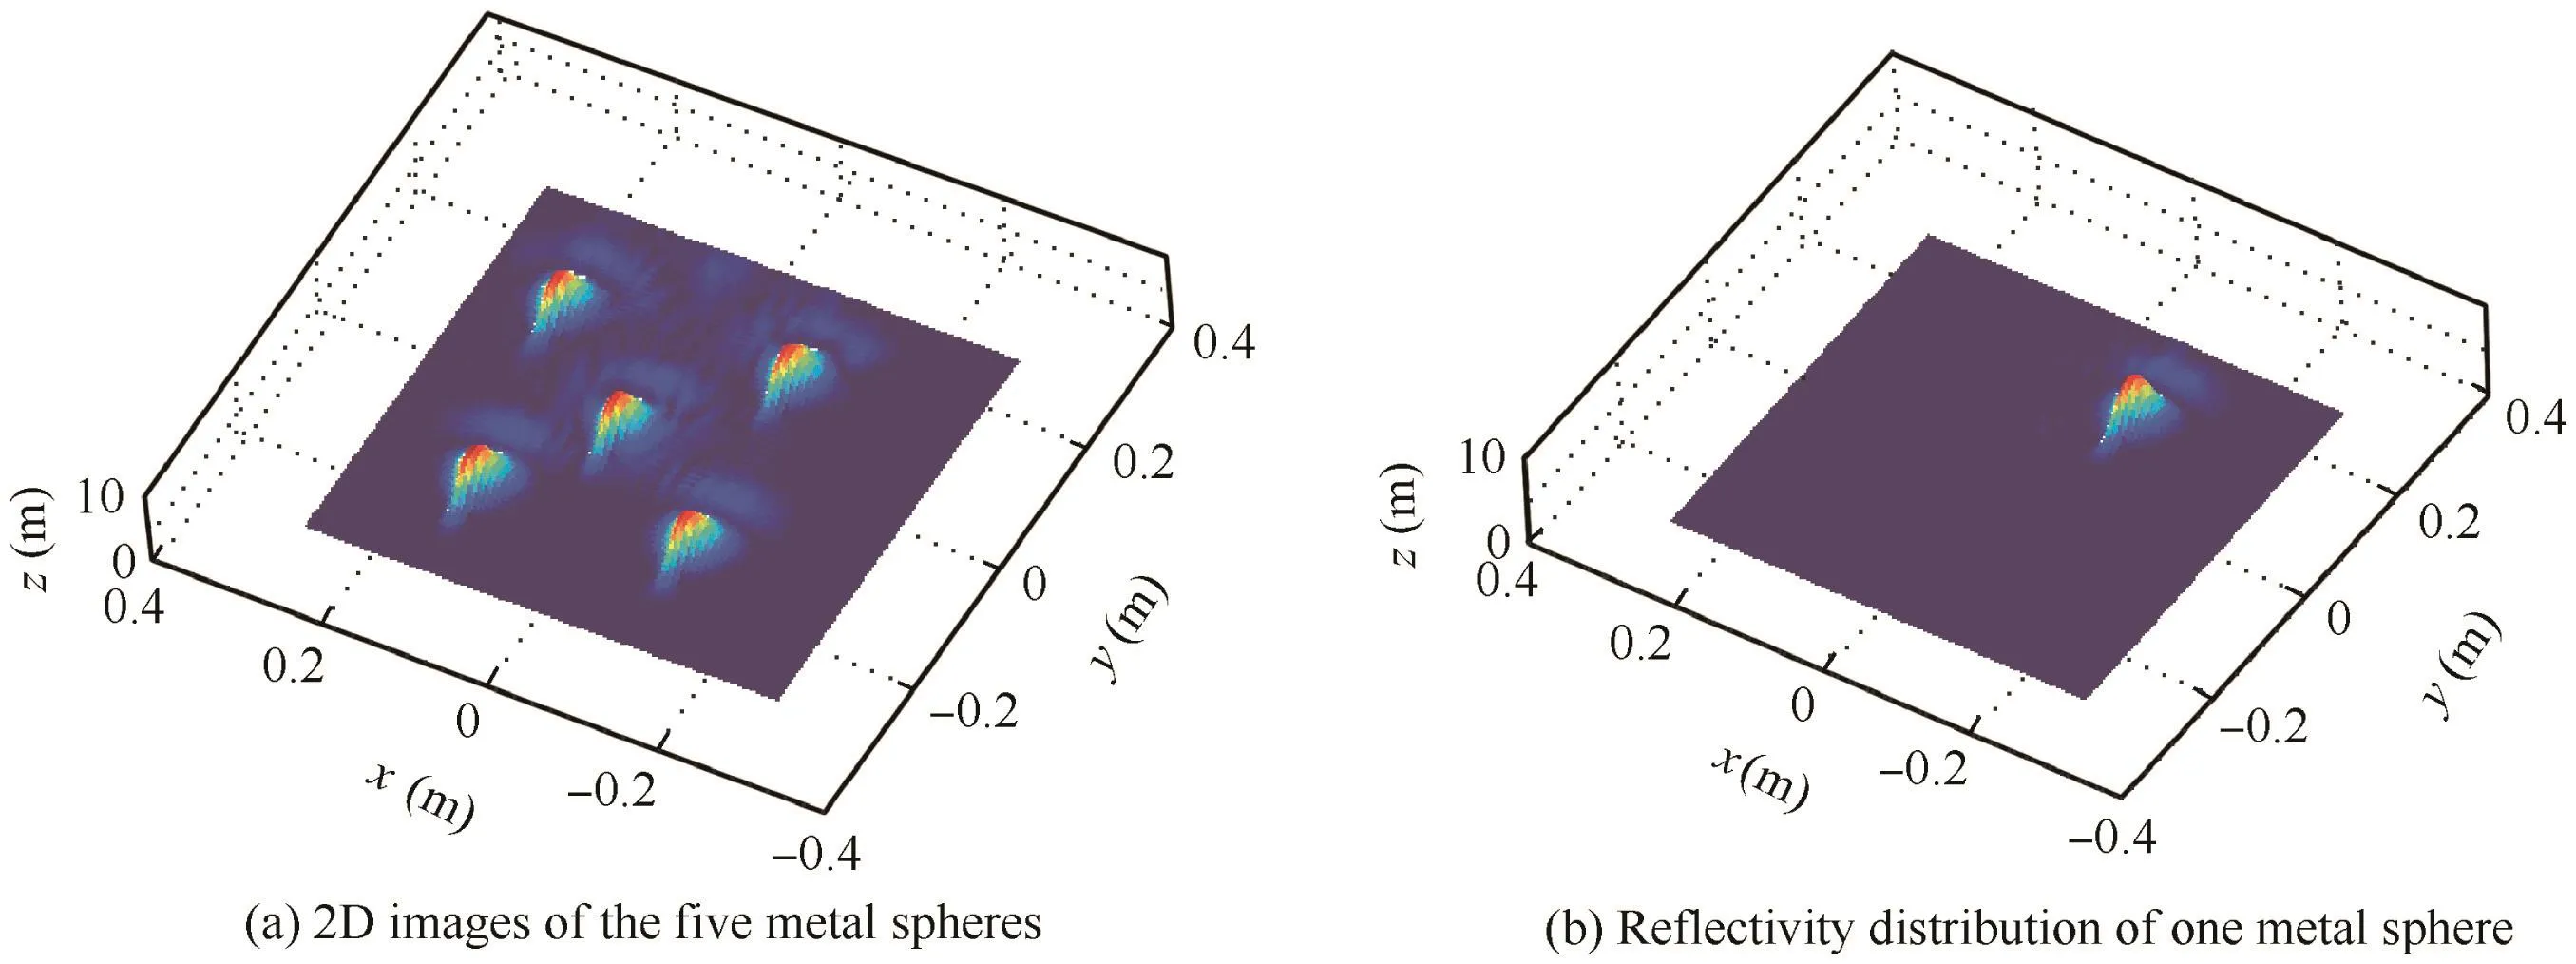
Fig.6 2D images of five metal spheres and reflectivity distribution of one metal sphere.
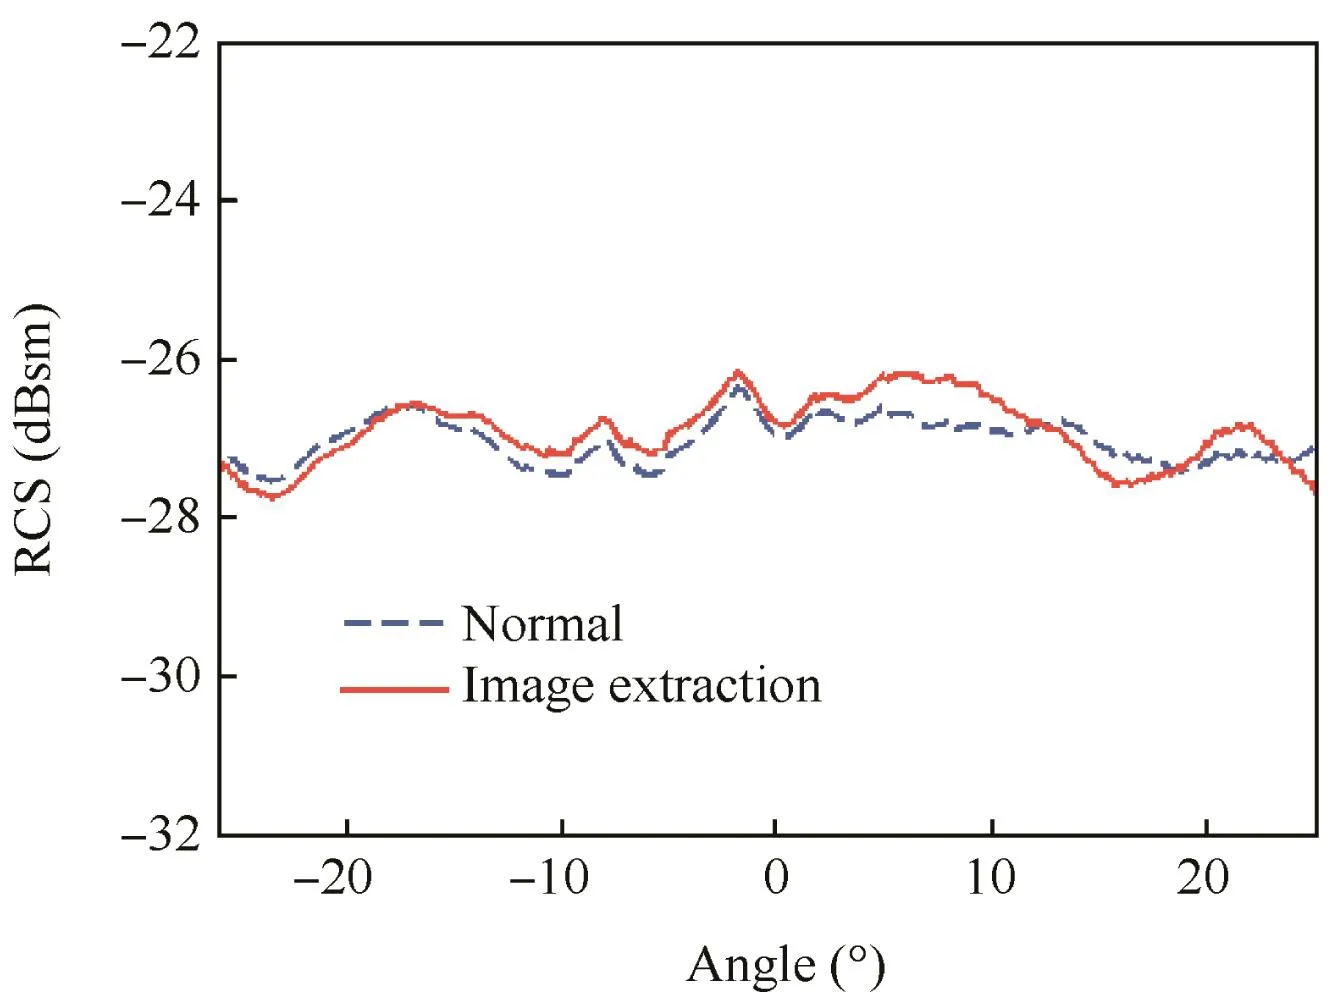
Fig.7 Diagram for comparing RCS obtained in two cases.

Table 1 Typical weak scattering sources of an airplane and their scattering mechanisms.
During RCS measurement,the incidence electric field and conformal antenna basically remain in a parallel state and therefore form a weak scattering source on the aircraft surface.The conformal antenna in an installation state is measured,as shown in Fig.8(a).The antenna is embedded into the metal envelope of an analogue airframe,which is wrapped with wave-absorption materials to ensure that the scattering at the edge of metal envelope is as small as possible.The frequency range for measurement is 9–11 GHz;the frequency interval is 5 MHz.The rotational angle is-45°to 45°;the angle interval is 0.2°.
The microwave imaging algorithm produces the 2D image of metal envelope,as shown in Fig.8(b),from which the 2D reflectivity distribution in the area of the conformal antenna is extracted,as shown in Fig.8(c).The spectral transform of the 2D reflectivity distribution produces the spectral distribution of the target,as shown in Fig.8(d).After its calibration with the metal sphere,the RCS whose measurement frequency is 10 GHz is selected,as shown in Fig.9.
The dotted line in Fig.9 shows the results obtained with the normal RCS measurement method.It contains the scattering of the airframe envelope with the conformal antenna.The curve fluctuates somewhat in the angular domain;the major cause is the scattering on the surface of the airframe envelope.The antenna's RCS is obtained with the extraction and then spectral transform of the reflectivity distribution in the area of conformal antenna is shown by the solid line.It is smoother and 3–5 dB lower than the previous dotted line,indicating that this image extraction method can well separate the scattering of the conformal antenna from that of the airframe envelope,enhancing the measurement accuracy of a weak scattering source.
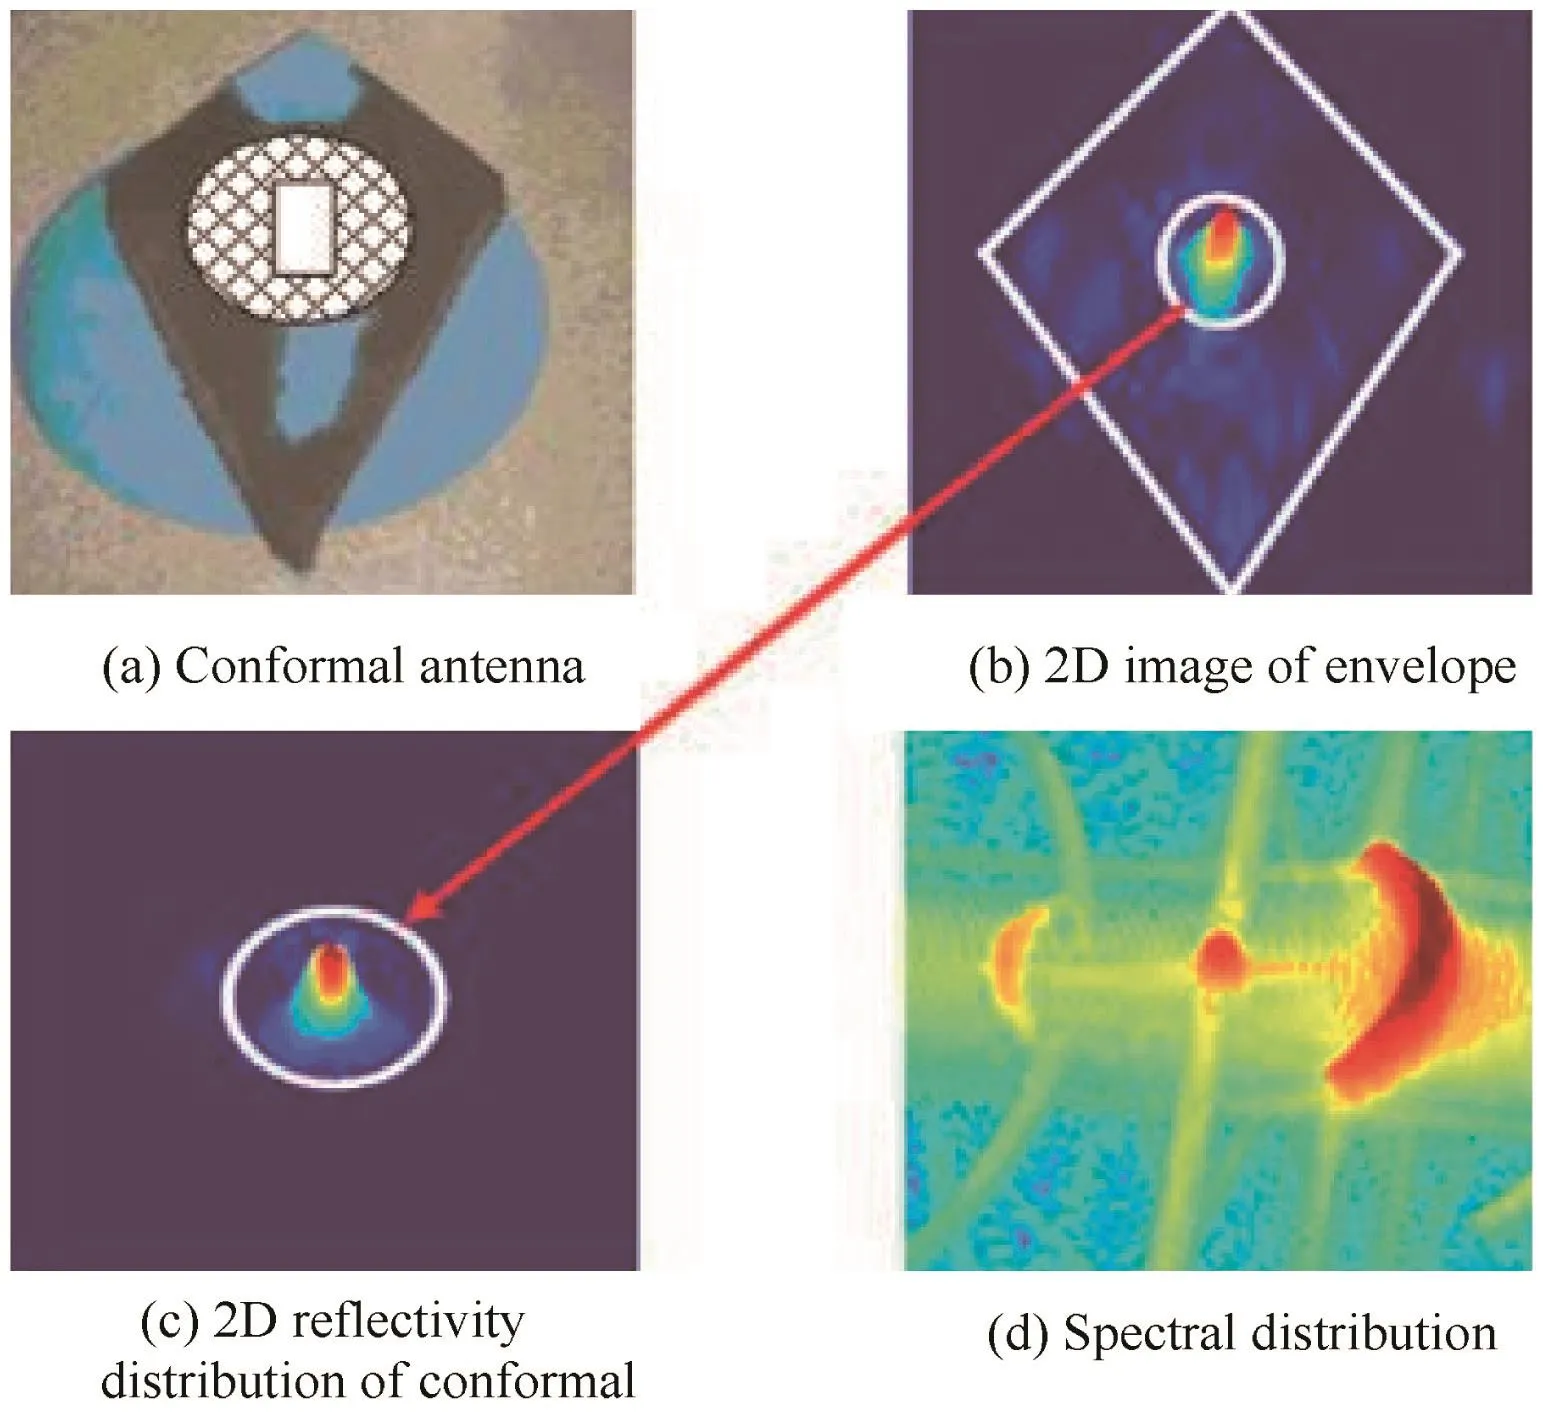
Fig.8 Measurement of low-scattering conformal antenna.

Fig.9 Comparison of two measurement results.
5.Conclusions
(1)The experiments with the known prototypes and the conformal antenna of an aircraft show that the method is effective,with the measurable RCS reaching below-40 dBsm.Therefore,it can be applied to the high precision measurement of an aircraft's weak scattering source.
(2)Its strong scattering sources are separating and extracting the information on the scattering of a target and eliminating clutter.It can build an algorithm into a universal software module,which is embedded into the normal RCS measurement system to perform quasi-realtime processing,thus obtaining a higher precision than the normal RCS measurement method.
(3)Because the RCS by image extraction involves the extraction area of a target,the results on different extraction areas may be different.Therefore,to obtain optimal results,the complete scattering points in the concerned area should be selected in accordance with the scattering properties of the target.Besides,when the measurement frequency is rather low and the target is rather small,the extracted area of the target should not be too small;if smaller than the wavelength,the information on the scattering of the target may be lost,causing rather great errors.
(4)The minimum spacing has something to do with the imaging resolution.When the resolution can distinguish between the images of two targets,the distance between the two targets is the minimum spacing.If there is enough movable space,the RCS can also separate the targets that have great differentiation.
(5)The method mainly uses microwave imaging,whose theoretical foundation is the model of multiple scattering centers.According to the electromagnetic field theory,each scattering center is equivalent to the mathematical discontinuity in the Stratton-Chu integral.The weak scattering source just results from the electromagnetic waves irradiated by the discontinuous structure on the surface of an airplane.Therefore,the method is applicable to the scattering characteristic analysis of a weak scattering source.
Acknowledgements
This study was co-supported by the National Natural Science Foundation of China(Nos.61201320,61371023)and the Fundamental Research Funds for the Central Universities of China(No.3102014JCQ01103).
1.Mensa DL.Wideband radar cross section diagnostic measurements.IEEE Trans Instrum Meas 1984;33(3):206–14.
2.Melin JO.Measuring radar cross section at short distance.IEEE Trans Antennas Propag 1987;35(8):991–6.
3.Hess DW.Introduction to RCS measurements.Antennas and propagation conference,2008 Mar 17–18;Loughborough,UK.Piscataway,NJ:IEEE Press;2008.p.37–44.
4.Tice TE.An overview of radar cross section measurement techniques.IEEE Trans Instrum Meas 1990;39(1):205–7.
5.Knott EF,Shaeffer JF,Tuley MT.Radar cross section.4th ed.Raleigh,NC:Sci Tech Publishing Inc.;2004.p.449–83.
6.Baggett M,Thomas T.Obtaining high quality RCS measurements with a very large foam column.AMTA annual meetingamp;symposium;2005 Oct 13–15;Newport,USA.New York:Curran Associates Inc.;2005.p.1–5.
7.Muth LA,Wang CM,Conn T.Robust separation of background and target signals in radar cross section measurements.IEEE Trans Instrum Meas 2005;54(6):2462–8.
8.Burns JW,Subotic NS.Reduction of clutter contamination in radar cross section measurements using independent components analysis.IEEE antennas and propagation society symposium,2004 Jun 20-25;Monterey,USA.Piscataway,NJ:IEEE Press;2004.p.731–4.
9.White MO.Radar cross-section measurement prediction and control.Electron Commun Eng J 1998;10(4):169–80.
10.Kemptner E,Klement D,Wagner H.RCS determination for DLR stealth design F7.The ROT SCI symposium on''non-cooperative air target identification using radarquot;,1998 Apr 22–24,Mannheim,Germany.p.1–12.
11.Smith FC.Measurement of diffraction radar cross section.Electron Lett 2000;36(9):830–1.
12.Wang HTG,Sanders ML.Benchmarking of RCS codes.IEEE antennas and propagation society symposium,1992 Jun18–25,Chicago,USA.Piscataway,NJ:IEEE Press;1992.p.1320–2.
13.Huang PL,Liu ZH.Research on electromagnetic scattering characteristics of slits on aircraft.Acta Aeronautica et Astronautica Sinica 2008;29(3):675–80(Chinese).
14.Huang PL,Liu ZH,Wu Z.Analysis of electromagnetic scattering characteristics of steps.Acta Aeronautica et Astronautica Sinica 2008;29(2):399–404(Chinese).
15.Bati A,To L,Hilliard D.Advanced radar cross section clutter removal algorithms.Antennas and propagation conference,2010 Apr 12–16;Barcelona,Spain.Piscataway,NJ:IEEE Press;2010.p.1–5.
16.Tulgar O,Ergin AA.Improved pencil back-projection method with image segmentation for far field near field SAR imaging and RCS extraction.IEEE Trans Antennas Propag 2015;63(6):2572–84.
17.Karakasiliotis AV,Lazarov AD,Frangos PV,Boultadakis G,Kalognomos G.Two-dimensional ISAR model and image reconstruction with stepped frequency-modulated signal.IET Signal Proc 2008;2(3):277–90.
18.Hu CF,Zhou Z,Li NJ,Zhang K.Multi-dimensional scattering properties diagnosis system of scale aircraft model in an anechoic chamber.J Syst Eng Electron 2014;25(1):1–9.
19.Cheng GG,Zhu Y,Grzesik J.Microwave medical imaging techniques.Antennas and propagation conference,2013 Apr 8–12;Gothenburg,Sweden.Piscataway,NJ:IEEE Press;2013.p.2669–73.
20.Özdemir C.Inverse synthetic aperture radar imaging with MATLAB algorithms.Hoboken,NJ:Wiley;2012.p.133–9.
21.Patrosky A,Sekora R.Structural integration of a thin conformal annular slot antenna for UAV applications.Antennas and propagation conference,2010 Nov 8–9;Lough borough,UK.Piscataway,NJ:IEEE Press;2010.p.229–32.
Hu Chufengreceived the degrees of B.S.,M.S.and Ph.D.from Northwestern Polytechnical University in 2004,2007 and 2010,respectively.Now he is an associate professor in Science and Technology on UAV Laboratory,Northwestern Polytechnical University.His research interests include radar cross section measurement,microwave imaging and radar remote sensing.
31 August 2015;revised 30 January 2016;accepted 28 February 2016
Available online 9 May 2016
Microwave imaging;
RCS measurement;
Reflectivity distribution;
Spectral transform;
Weak scattering source
Ⓒ2016 Chinese Society of Aeronautics and Astronautics.Production and hosting by Elsevier Ltd.This is an open access article under the CCBY-NC-ND license(http://creativecommons.org/licenses/by-nc-nd/4.0/).
*Corresponding author.Tel.:+86 29 88451041 810.
E-mail address:huchufeng@nwpu.edu.cn(C.Hu).
Peer review under responsibility of Editorial Committee of CJA.
 CHINESE JOURNAL OF AERONAUTICS2016年3期
- CHINESE JOURNAL OF AERONAUTICS的其它文章
- Optimization on cooperative feed strategy for radial–axial ring rolling process of Inco718 alloy by RSM and FEM
- Measuring reliability under epistemic uncertainty:Review on non-probabilistic reliability metrics
- Optimum blade loading for a powered rotor in descent
- Experimental study of ice accretion effects on aerodynamic performance of an NACA 23012 airfoil
- Parachute dynamics and perturbation analysis of precision airdrop system
- Simulative technology for auxiliary fuel tank separation in a wind tunnel