
Modeling and validation on path loss of WSN in pig breeding farm
2017-02-17 07:35ZhuHongLiShuangZhengLiminYangLu
农业工程学报 2017年2期
Zhu Hong, Li Shuang, Zheng Limin,2, Yang Lu
Modeling and validation on path loss of WSN in pig breeding farm
Zhu Hong1, Li Shuang1, Zheng Limin1,2※, Yang Lu1
(1.,,100083,; 2.,,100083,)
In order to build a path loss model and optimize the deployment of ZigBee nodes, in this study, how the characteristic affecting the wireless signal propagation in pig farm environment is evaluated. The research is based on ZigBee wireless sensor network technology. Depend on the environment of pig farm, we consider piggery wall and plant growing between piggeries as the two mainly barriers which affect the wireless signal propagation greatly. During the research, packet loss rate (PLR) of wireless signal and received signal strength indicator (RSSI) are the most important parameters being used to evaluate transmission characteristics. We chose direct ray model as the basic path loss model and designed three groups of experiment to measure the parameters used in the model. Firstly, we tested RSSI value changed with the distance between transmitter and receiver in the case of no obstacle for 12 times. Based on the data obtained by regression analysis, the path loss exponent value was 2.02 and the correlation coefficient was higher than 0.9. Secondly, the influence of barrier was taken in count. The thickness of piggery wall was 0.4 m and the antenna height was set at 1.2 m for avoiding the effect of other obstacles. By increasing the number of wall, the rate of packet loss obviously changed. Result showed that one or two walls have no influence on PLR value, but it turns to 17.75% when the number of walls increases to 3 and when the number of walls added to 5, with PLR value reaches 100%. The influence of wall is transformed into the wall attenuation factor that added into the path loss model, and its value is computed to be 2.64. There are plants growing between the piggeries, which can be divided into three groups, 40, 80 and 120 cm. We set 4 groups of antenna heights for each kind of plant, which is depending on their own height. At each antenna height, we tested RSSI value with the changes of distance between transmitter and receiver, and then get the varying pattern of plant attenuation factor with the antenna height based on the regression analysis. Results showed that plant attenuation factor decreased with the rising of the height of installing antenna. Finally, prediction path loss model with the wall attenuation factor 2.64 and the plant attenuation factor, we use multi stage function to express when the plant height is 40, 80 and 120 cm, were obtained. In order to test the accuracy and practicability of the model, the integrated experiments with both wall and plant as the barriers in the pig farm environment were investigated, and the model was verified according to the field-test result. In the model, the path loss exponent is 2.02 and the basic path loss value is 63.602 dBm and other parameters change with the plant height or antenna height. The model is a comprehensive model that can be used for predicting the path loss value of ZigBee wireless signal in the pig farm environment. On the basic of the prediction path loss model, we can optimize the node deployment for increasing the network coverage rate and connectivity.
wireless sensor networks (WSN); models; farms; path loss; received signal strength indicator (RSSI); pig breeding
0 Introduction
The wireless sensor network are gradually affecting the traditional businesses,which could collect information and be controlled automatically[1].In pig breeding farms, one recent approach is to collect the movement information of pigs via motion sensors for knowing the health of pigs[2], and gather the real-time collected information by using ZigBee communication channel[3].
The deployment of ZigBee access points[4]is important to availability and stability of ZigBee connection in the pig farm. Take the Beijing Resource Group’s pig breeding farm as an example. Pigs can move freely in the all room, as well as in the interval space between two rooms. The walls[5]and the plants[6]are all barriers that affect the transmission of wireless signal. In order to guarantee the connection of wireless network, the 2.4 GHz ZigBee wireless signal fades in the pig farm environment should be studied.
Therefore, in this paper, we conduct experimental study on the signal fading in the pig farm environment. Especially, we chose the direct ray model to analyze the parameters of network. The path loss exponent, reference path loss PL(0), wall attenuation factor AF1, plant attenuation factor AF2and the antenna height were evaluated, and then the effectiveness of all parameters through the integrated experiments were determined.
In this study, we evaluated the wireless signal propagation model in the pig breeding farm, and the important parameters were obtained by experiment to complete such model. Secondly, via further experiments, we prove the effectiveness of such model.
1 Path loss model and parameter measurement
There have been many existing works studying wireless sensor network (WSN) based on ZigBee technology that used in different environment as a system[7-9]. Depend on application environment, there also have different suitable models[10], for example, the parameters of Hata-Okumura model are various in city center and countryside. Here we first introduce path loss model, and assess how it adapts to environments with barriers.
Fig.1 shows the working environment. WSN based on ZigBee technology in the pig breeding farm is shown in Fig.2. There are three kinds of functional module in the farm, the scales module, the environmental monitoring module and the heat detection module. All these modules were controlled by STM32W108 chip made by our lab. The modules can test the RSSI value and show the result on the LED screen. These modules collect data with different sensors connected with the terminal nodes and the server receives all data by ZigBee wireless signal.
1.1 Path loss model
Power loss is the major path loss caused by propagation medium and barriers when the wireless signal transmits from the transmitter to the receiver[11]. Instinctively, such value increases with the distance between transmitter and receiver (T-R distance)[12]. Two path loss models were employed to study how path loss changes, the theoretical model and the empirical model[13]. The theoretical model is inferred from physical theory of electromagnetic wave propagation and the empirical model comes from mathematical analysis of the onsite measurements. Equation (1) is the typical empirical model used in WSN[14], and it indicates that the path loss value changes with distance in logarithmic decrement, following the radio propagation rules.
Whereis the distance, m; PL() is the path loss associated with the distance, dBm;0is the constant distance (usually set to 1 m)[15], and PL(0) is the path loss measured when the T-R distance is0.is the path loss exponent which indicates how rapidly path loss increases with distance, andvaries in different environments[16].
Equation (1) adapts to the environment that has no barriers blocking the propagation of wireless signals and causing path loss as well, however, pig farm has barriers, such as walls and plants[17]. So we chose the direct ray model[18], which was used for non line of sight (NLOS), and it based on equation (1) with extra attenuation factors added for calculating the path loss. The function is given by
Where OBSvalue is 1 or 0 when there is obstacle or not; AFstands for attenuation factor caused by different kinds of barriers, dBm.
1.2 Parameter measurement
There have been various studies on measuring the wireless transmission characteristics in different environments. Commonly, they use RSSI (received signal strength indicator) to curve the value of path loss[19-23].
Hebel et al[24]aimed at formulating the effects of the change in crop canopy heights. Results indicated that the degree of attenuation and signal strength both depended on the loss of line of sight and the height lower than Fresnel zone radius. And it inspired us of how to test the path loss when the plants blocking the propagation. The study of Zhang[25]showed that the effect of multiple diffraction caused by buildings and trees was significant, especially when the height of antenna was lower than the buildings and trees. This conclusion can help us to find the appropriate location for placing the antenna in the pig farm. In the confined animal feeding house, the free space, animal cages, animal presence, and concrete floor separations were considered as barriers[26]. Darr et al[26]measured RSSI value of each situation separately and analyzed the reason of signal fading, however, they failed to formulate a model that can express the effect of all the factors.
Different from existing works, our paper mainly focus on measuring the signal propagation characteristics in pig farm. In the coming section, we will further introduce our methodology and experimental results.
2 Methods
We took pig breeding farm of Beijing Resource Group as an example to measure the path loss characteristics of ZigBee wireless signal (2.4 GHz). Fig.3 showed the structure of the pig farm and the default deployment of the ZigBee access points. Overall, there are 20 parallel piggeries, and each piggery is a rectangle that has 40 m in length and 12 m in width. Brick walls of piggery are 0.4 m in thickness and 5.0 m in height. Between the two walls of adjacent piggery, there are dense and high plants.
To measure the path loss exponentin equation (1), the parameters were measured as follow.
Fig.4 showed the design line of the whole experiment. We designed the experiments based on the path loss model. The influence factors during the tests and the effective parameters showed in Fig.4 as well.
2.1 Measuring path loss exponent
According to reference [24], when there is no other barrier between the transmitter and the receiver, the path loss is mainly caused by T-R distance. Therefore, we varied the T-R distance, and measured the RSSI values for calculating the path loss exponent, which is the foundation of building applicable path loss model in pig breeding environment.
We designed 12 sets of test on the condition that no barriers exist in the real environment, transmitted 100 data in each set. The transmitter was settled at one side of the piggery, and the receiver was moved in a straight line increasing from 3 m to 36 m, with the antenna height of 1.2 m.
The real path loss in the test is
PL=P−P(3)
WherePis transmitted power andPis received power. BothPandPare measured by dBm and PL by dB. The transmitted power of module used in the test was 20 dBm, which is unadjustable.
2.2 Measuring influence of walls to path loss
Walls surrounding the piggery would create substantial attenuation to undermine signal transmission. In this study, the influence of walls on wireless signal transmission was assess.
Value of path loss rate (PLR) is the index which directly reflects stability and reliability of WSN. We put the transmitter and the receiver on both sides of a piggery wall separately, and observed the transmission quality by recording the PLR of receiver. The height of antenna was 1.2 m to avoid the influence of other barriers. Before the experiment, the location of transmitter was settled. To find out the appropriate area that radio signal can be received, the distance between receiver and wall were changed, and the suitable distance was 1.0 m.
2.3 Experiment on influence of different height plant
There are trees, grasses, corn and pumpkins growing between the piggeries. The height of plant, which can be divided into three groups, 30-50, 80-100 and 120-150 cm, could affect the transmission of ZigBee wireless signal. In order to guarantee the validity of the test, the following factors must be considered when we select the test plants: uniform of planting density and height, and enough range of measurement. Then three typical kinds of height were picked, 40, 80 and 120 cm. As is known from chapter 3.2, the height of antenna also affects the quality of signal receiving, so 4 different heights of antenna were set for different plants, which are shown in Table 1.

Table 1 Antenna height at different plant heights
Three sets of measurement were conducted for each antenna height, in which there were 100 data of RSSI value. The location of transmitter was settled in the plant and the T-R distance increased from 0 to 36 m by 6 m. The antenna height changed four times depended on the value in Table 4 at every 6 m.
3 Results and analysis
3.1 Regression parameters of path loss model under no barrier situation
Based on equation (1),can be calculated by linear regression of least square and statistical software SPSS 19 was used to do the linear regression analysis. The result is shown in Table 2.
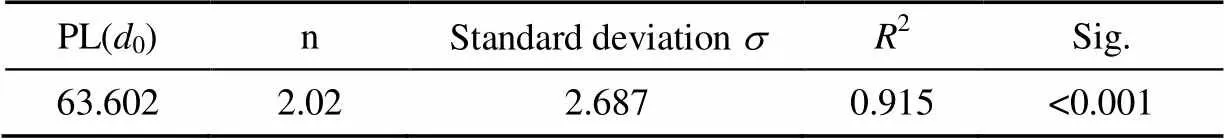
Table 2 Regression parameters of path loss model under no barrier situation
It can be seen from this regression analysis result that the real exponentin the pig breeding farm is 2.02, closed to the typical value of free space path loss model. The parameteris the standard deviation. The value of PL(0) in the model is 63.602 dB. The determination coefficient2is higher than 0.9 andis lower than 0.05, thus both remarkable value differences support our model.
3.2 Effects of walls on path loss rate
3.2.1 Effect of walls on radio signal
With 100 data in each set and 10 sets of data, 1000 data were measured at each point to calculate the average value of PLR. Result of PLR is shown in Table 3.
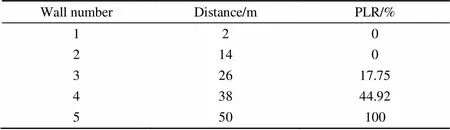
Table 3 Path loss rate (PLR) values with varies of wall number
Table 3 summarizes the average PLR value with different number of walls and it indicates that wall influenced the spread of ZigBee wireless signal. As the result shows, PLR value is zero when one or two walls are set between transmitter and receiver, but increases nearly 20% when the number of walls increases to 3. Clearly, effective communication is significantly undermined when the number of walls added to 4, with PLR value exceeds 40%, and fully terminated by 5 walls, with PLR reaches 100%.
3.2.2 Effect of antenna height on path loss rate
On the basis of previous experiment, the height of antenna is 1.2 m, and then we adjust it to 5 m, same as the wall, to research the relationship between antenna height and the PLR. If PLR value is lower than 10%, which is the most for effective communication, the height would be decreased by 0.5 m to find the threshold height that makes PLR less than 10%. If PLR value is higher than 10%, the height would be increased by 0.5 m till PLR value is less than 10% to find the lowest height. We repeatedly increased the number of wall every time after we obtained the minimum and maximum height of antenna for a fixed number of wall.
Table 4 shows that the PLR value increases with the increasing of antenna height. The rationale behind this result is that the impact of barriers, which resist the wireless signal, is undermined when the antenna height is raised. Comparing Table 2 with Table 3, wall has significant negative effect on wireless communication. If antenna height is lower than the wall because PLR remains at 100% whether the antenna height is 1.2 or 5 m and PLR decreases to zero when the antenna height is increased to 5.5 m. The application of this experiment result is that we should set the antenna height rationally to reduce the numbers of ZigBee route nodes in the WSN and save costs.
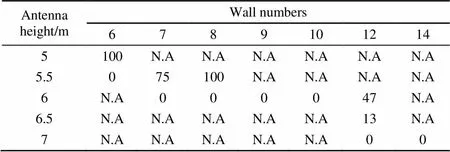
Table 4 Influence of antenna height on ZigBee transmission by path loss rate %
Note: N.A means not available.
3.2.3 Attenuation factor of wall
According to Equation (2), an extra attenuation factor should be added into path loss model when the effect of wall is considered as a barrier. The following equation highlights the attenuation of wireless signals resulted by wall[27]. AF1is short for the Attenuation Factor of wall and it works for reducing the deviation of machine tested value and the predicted value, so it counts in dB.
Whereis the number of walls, we got the values of path loss exponentand PL(0) in Table 1 and obtain the value of PL() by realistic tests. So AF1can be computed at 2.64 dB.
3.3 Influence of different height plant
The relationship between RSSI value and T-R distance is shown in Fig.5. RSSI value decreases with the increase of T-R distance in Fig.5 a, b and c, which is same as the trend of free space propagation model. The trend of each kind antenna height is in the picture as well for showing their mathematical characteristic. RSSI value falls rapidly till no signal can be received when antenna height is lower than plant height. Contrasting with the three figures, the decay speed of RSSI value gets slow when the antenna height is higher than plant, and that is because the plant’s blocking effect reduces with the increasing of antenna height. We fitted the predicted value and the tested at the same antenna height and showed the result in Fig.5.
Similar to wall barrier, the attenuation factor AF2can be calculated on the basis of equation (2) by using the data tested when there is only the plant as a barrier.
There are two variables during the experiment, T-R distance and antenna height, so their relationships with attenuation factor were considered separately.
Fig.6 shows the affecting factors of attenuation factor with the limited apart. The relationship between antenna height and attenuation factor is shown in Fig.6 a when the plant height is 40 cm and the T-R distance is 6 m. The relationship between T-R distance and attenuation factor is shown in Fig.6 b when the plant height is 80 cm and the antenna height is 60 cm.
Attenuation factor reduces with the rising of antenna height in Fig.6 a, but it does not show a regular change with the increasing of T-R distance in Fig.6 b. Such situation also showed when variables took other values. So it can be seen, as the property of plant itself, the attenuation factor has no direct relation with the T-R distance, but it has a certain correlation with antenna height.
It indicates that the attenuation of the wireless signal gradually decreases with the increased antenna height. So the height of antenna is used to represent the attenuation factor AF2of different height of plant. The result after the analysis of regression is shown in Table 5.
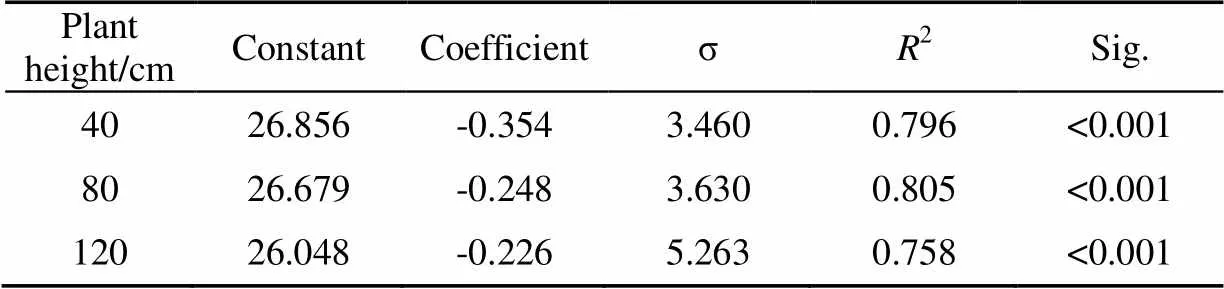
Table 5 Regression parameter of relation between antenna height and attenuation factor
Equation (6) is the result of Table 8 showing in another form and it can be applied to the path loss model calculating.
4 Confirmatory experiments
4.1 Attenuation factor of wall
According to chapter 3.2.3, the AF1was obtained to make the path loss model more accurate than equation (1). It can be verified depending on the empirical model and the practical measured data. When the T-R distance is 10 and 20 m, the actual values that we tested in the pig breeding farm are 87.02 and 98.57 dB respectively.
There is one wall between the transmitter and the receiver when the distance is 10 m, the AF1is 2.64 dB and the PL(1) is 63.602 dB.
The path loss is computed on the basis of equation (4), the value should be

Similarly, there are two walls when the distance is 20 m, then the path loss should be
Comparing the actual values and the prediction values, the forecast error are 0.55 and 3.37 dB, which are in the range of acceptable error, so the path loss prediction model with AF1is comparatively accurate.
4.2 Mixture experiment of wall and plant
The attenuation factor of the wall AF1and the plant attenuation factor AF2were obtained on the basis of experiment that wall and plant were barriers. The integrated path loss prediction model can be set up for pig breeding environment depending on equation (2), and the equation for calculating is given by
According to the equation (7), we can easily predict the path loss values even when both wall and plant are barriers. In this way, the integrated prediction model can be a guide for arranging terminal nodes and route nodes in WSN reasonably.
We continued to test three more groups to verify the accuracy of the path loss model. There are two walls and the plant growing between them in each test, and the height of plant, which is 40, 80 and 120 cm, is different in the three tests. And four kinds of antenna height were set up like former. The interval of two walls is 12 m and the distance from each node (transmitter and receiver) to the wall is 1 m, so the T-R distance is 14 m. The attenuation factor AF1is 2.64 dB. Two sets of data were sent at each antenna height during the test, and 100 data for each set. The RSSI values were recorded.
The comparison of the real measured data and the prediction values is shown in Table 6. When the prediction values exceed 112 dBm, the wireless signal cannot be received in the real experiment because of the sensitivity of receiver.
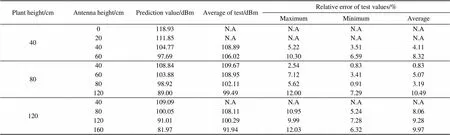
Table 6 Comparison of prediction model and real test
Classifying the data displayed in Table 6 by the height of plant is aimed at observing the relationship between RSSI values and antenna height, and the result is shown in Fig.7. All the prediction values are smaller than the test data, and it may due to the calculation deviation of the attenuation factor AF1. The similar situation is observed when wall is the only barrier. This indicates that correction is needed for the prediction model.
4.3 Discussion and evaluation
The errors are inevitable during the progress of calculating the parameters and it is common that the parameters are different from other researches because the test environment is various.
In this paper, the path loss exponentis 2.02 and that is a little less than others in such environment. The possible reason of that may be as follows: Firstly the indoor exponentis a little smaller than outside environment; Secondly the structure of the test piggery is narrow, and the transmission path of radio signal is line of sight; Thirdly the wireless signal can be reflected from the ceiling[28].
Besides, the Wall attenuation factor (WAF) is depending on the material of wall. The value of soft partition is smaller than that of concrete wall[29]. The WAF in reference [30] is 3.1 dB, and in reference [18] it is 1.39 dB for soft partition and 2.38 dB for concrete wall. The WAF in this paper is 2.64 dB for brick wall, which shows that it is in the normal range.
5 Conclusions
This study assessed the ZigBee wireless signal propagation characteristic in the pig breeding environment, and the path loss prediction model was generated. The wall and plant were major barriers for path loss. The relationship between whole WAF and wall numbers is linear, and the plants attenuation factor of different height plants reduces with the antenna height rising. Finally, the attenuation factor of the wall and plant attenuation factor are added into the empirical model for predicting the path loss value, and the model is verified by the actual test and gets rectified. The final prediction path loss model with the wall attenuation factor 2.64 and the plant attenuation factor, we use multi stage function to express when the plant height is 40, 80 and 120 cm, were obtained, and the path loss exponent n is 2.02 and the basic path loss value is 63.602 dBm and other parameters change with the plant height or antenna height. It can predict the path loss of any two nodes in the pig breeding farm, so that we can easily determine the location of terminal node or routing node and the height of antenna for saving the cost and optimizing the network topology.
[1] Chikankar Pravina B, Mehetre Deepak, Das Soumitra. An automatic irrigation system using ZigBee in wireless sensor network, Pune, India, 2015[C]//Institute of Electrical and Electronics Engineers Inc, 2015.
[2] Badescu Alina-Mihaela, Cotofana Lucian. A wireless sensor network to monitor and protect tigers in the wild[J]. Ecological Indicators, 2015, 57: 447-451.
[3] Suryadevara Nagender Kumar, Mukhopadhyay Subhas Chandra, Kelly Sean Dieter Tebje, et al. WSN-based smart sensors and actuator for power management in intelligent buildings[J]. IEEE/ASME Transactions on Mechatronics, 2014, 20(2): 564-571.
[4] Peng Yuli, Li Pingping, Wang Jizhang, et al. Propagation characteristics of 2.4 GHz wireless channel at different directions and heights in tea plantation, Guangzhou, China [C]//Trans Tech Publications Ltd:Applied Mechanics & Materials, 2013: 1697-1701.
[5] Stamatescu Grigore, Sgarciu Valentin. Evaluation of wireless sensor network monitoring for indoor spaces, Sanya, Hainan, China, 2012 [C]//IEEE Computer Society International Symposium on Instrumentation & Measurement, 2012: 107-111.
[6] Xu Lihong, Zao Minghua, Wei Ruihua, et al. Adaptive control algorithms of transmitting power for greenhouse WSN nodes[J]. Transactions of the Chinese Society of Agricultural Engineering (Transactions of the CSAE), 2014, 30(8): 142-148.
[7] Han Huafeng, Du Keming, Sun Zhongfu, et al. Design and application of ZigBee based telemonitoring system for greenhouse environment data acquisition[J]. Transactions of the Chinese Society of Agricultural Engineering (Transactions of the CSAE), 2009, 25(7): 158-163.
[8] Hu Jin, Fan Hongpan, Zhang Haihui, et al. Design of regulation system of light environment in greenhouse based on wireless sensor network[J]. Transactions of the Chinese Society of Agricultural Engineering(Transactions of the CSAE), 2014, 30(4): 160-167.
[9] Yang Xuhui, Zhou Qingguo, Han Genliang, et al. Energy-efficient aquaculture environmental monitoring system based on ZigBee[J]. Transactions of the Chinese Society of Agricultural Engineering (Transactions of the CSAE), 2015, 31(17): 183-190.
[10] Patri A, Nimaje D S. Radio frequency propagation model and fading of wireless signal at 2.4 GHz in an underground coal mine[J]. Journal of the Southern African Institute of Mining and Metallurgy, 2015, 115(7): 629-636.
[11] Srie Vidhya Janani E, Ganesh Kumar P. Evaluating the technical barriers of large scale sustainable wireless sensor network: A resources approach[J]. Resources Policy, 2015, 46: 134-141.
[12] Mardini Wail, Khamayseh Yaser, Almodawar Abdalrhman Abdalkareem, et al. Adaptive RSSI-based localization scheme for wireless sensor networks[J]. Peer-to-Peer Networking and Applications, 2015: 1-14.
[13] AlSayyari Abdulaziz, Kostanic Ivica, Otero Carlos E. An empirical path loss model for wireless sensor network deployment in a concrete surface environment, Cocoa Beach, FL, United states, 2014 [C]// IEEE World Forum on Internet of Things, 2014, 16(1): 637-642.
[14] Li Siyu, Gao Hongju, Jiang Jianzhao. Impact of antenna height on propagation characteristics of 2.4 GHz wireless channel in wheat fields[J]. Transactions of the Chinese Society of Agricultural Engineering (Transactions of the CSAE), 2009, 25(Suppl 2): 184-189.
[15] Li, Xiaomin, Zang, Ying, Luo, Xiwen. Experiment of propagation characteristics based on 433MHz channel of WSN in orchid greenhouse[J]. Transactions of the Chinese Society of Agricultural Engineering (Transactions of the CSAE), 2013, 29(13): 182-189.
[16] Chan Y T, Lee B H, Inkol R, et al. Received signal strength localization with an unknown path loss exponent, [C]//Institute of Electrical and Electronics Engineers Inc., 2011: 456-459.
[17] Rasool I, Salman N, Kemp A H. RSSI-based positioning in unknown path-loss model for WSN, London, United Kingdom, 2012[C]//Institution of Engineering and Technology, 2012(3).
[18] Seidel Scott Y, Rappaport Theodore S. 914 MHz path loss prediction models for indoor wireless communications in multifloored buildings[J]. IEEE Transactions on Antennas and Propagation, 1992, 40(2): 207-217.
[19] Guo Congcong, Han Wenting, Wang Yi. Loss research on wireless sensor network signal transmission in persimmon orchard[J]. Transactions of the Chinese Society of Agricultural Engineering (Transactions of the CSAE), 2014, 30(15): 214-221.
[20] Li Xiaomin, Zang Ying, Luo Xiwen, et al. Experiment of propagation characteristics based on 433MHz channel of WSN in orchid greenhouse[J]. Transactions of the Chinese Society of Agricultural Engineering (Transactions of the CSAE), 2013, 29(13): 182-189.
[21] Li Zhen, Hong Tiansheng, Ning Wang, et al. Path-loss prediction for radio frequency signal of wireless sensor network in field based on artificial neural network[J]. Transactions of the Chinese Society of Agricultural Engineering (Transactions of the CSAE), 2010, 26(12): 178-181.
[22] Pang Chao, He Dongjian, Li Changyue, et al. Method of traceability information acquisition and transmission for dairy cattle based on integrating of RFID and WSN[J]. Transactions of the Chinese Society of Agricultural Engineering (Transactions of the CSAE), 2011, 27(9): 147-152.
[23] Wen Tao, Hong Tiansheng, Li Zhen, et al. Test of wireless sensor network radio frequency signal propagation based on different node deployments in citrus orchards[J]. Transactions of the Chinese Society of Agricultural Engineering (Transactions of the CSAE), 2010, 26(6): 211-215.
[24] Hebel Martin A, Tate Ralph, Watson Dennis G. Results of wireless sensor network transceiver testing for agricultural applications, Minneapolis, MN, United states, 2007[C]// American Society of Agricultural and Biological Engineers, 2007.
[25] Zhang Wei. Formulation of multiple diffraction by trees and buildings for radio propagation predictions for local multipoint distribution service[J]. Journal of Research of the National Institute of Standards and Technology, 1999, 104(6): 579-585.
[26] Darr Matthew J, Zhao Lingying. Modeling path loss in confined animal feeding operations, Providence, RI, United states, 2008[C]//American Society of Agricultural and Biological Engineers, 2008(1): 351-368.
[27] Motley A J, Keenan J M P. Personal Communication Radio Coverage In Buildings At 900 Mhz and 1 700 MHz[J]. Electronics Letters, 1988, 24(12): 763-764.
[28] Aziz Omar Abdul, Rahman Tharek Abdul. Investigation of path loss prediction in different multi-floor stairwells at 900 MHz and 1 800 MHz[J]. Progress In Electromagnetics Research M, 2014, 39: 27-39.
[29] LaFortune Jean-Francois, Lecours Michel. Measurement and modeling of propagation losses in a building at 900 MHz[J]. IEEE Transactions on Vehicular Technology, 1990, 39(2): 101-108.
[30] Bahl Paramvir, Padmanabhan Venkata N. RADAR: An in-building RF-based user location and tracking system, Tel Aviv, Isr, 2000[C]//Proceedings - IEEE INFOCOM, 2000(2): 775-778
生猪养殖场无线传感器网络路径损耗模型的建立与验证
朱 虹,李 爽,郑丽敏,杨 璐
(1. 中国农业大学信息与电气工程学院北京 100083; 2. 中国农业大学食品质量与安全北京实验室,北京 100083)
研究无线信号在生猪养殖环境中的传播特性,可以对无线传感器网络的路径损耗进行预测,从而为网络的部署奠定基础。研究采用ZigBee无线传感网络技术,通过在生猪养殖场中实际测试了有障碍物情况下,无线信号的丢包率和接收信号的功率强度,进而得出路径损耗值,以及障碍物的衰减因子,并进行了回归分析。研究表明,墙体衰减因子随墙壁数量增加而增大,植株衰减因子随天线架设高度升高而减小。最终模型的路径损耗参数为2.02,路径损耗的基础损耗为63.602,以混凝土墙为障碍物时,其衰减因子大小为2.64。将障碍物的衰减因子综合添加在经验模型中,可以有效的预测路径损耗值。
无线传感器网络;模型;猪场;路径损耗;RSSI;生猪养殖
10.11975/j.issn.1002-6819.2017.02.028
TP393.1
A
1002-6819(2017)-02-0205-08
2016-04-15 Revised date: 2016-11-15
National Science and Technology Program topics (2014BAD04B05), National Science and Technology Support Program (2012BAD28B02), Beijing Innovation Team Project (BAIC02-2016)
Zheng Limin, female, professor, mainly engaged in computer vision and Internet of Things research. Beijing College of Information and Electrical Engineering, China Agricultural University 100083. Email: zhenglimin@cau.edu.cn
Biography:Zhu Hong, female, Associate professor, mainly engaged in computer information systems research. Beijing College of Information and Electrical Engineering, China Agricultural University 100083. Email: zhuhongxie@cau.edu.cn
Zhu Hong, Li Shuang, Zheng Limin, Yang Lu. Modeling and validation on path loss of WSN in pig breeding farm[J]. Transactions of the Chinese Society of Agricultural Engineering (Transactions of the CSAE), 2017, 33(2): 205-212. (in English with Chinese abstract) doi:10.11975/j.issn.1002-6819.2017.02.028 http://www.tcsae.org
朱 虹,李 爽,郑丽敏,杨 璐. 生猪养殖场无线传感器网络路径损耗模型的建立与验证[J]. 农业工程学报,2017,33(2):205-212. doi:10.11975/j.issn.1002-6819.2017.02.028 http://www.tcsae.org
猜你喜欢
今日畜牧兽医(2022年10期)2022-12-23
实验室研究与探索(2021年4期)2021-05-29
动漫界·幼教365(中班)(2020年3期)2020-04-20
铁道通信信号(2020年9期)2020-02-06
创新作文(1-2年级)(2019年4期)2019-10-15
今日农业(2019年16期)2019-09-10
家庭影院技术(2018年9期)2018-11-02
资源节约与环保(2018年1期)2018-02-08
人民周刊(2017年16期)2017-09-25
猪业科学(2017年8期)2017-01-16
