
Evaluation on formation rate of Pleurotus eryngii primordium under different humidity conditions by computer vision
2017-05-19 07:41ZHOUJunDINGWenjieZHUXuejunCAOJunyiNIUXueming
浙江大学学报(农业与生命科学版) 2017年2期
ZHOU Jun,DING Wenjie,ZHU Xuejun,CAO Junyi,NIU Xueming()
Evaluation on formation rate of Pleurotus eryngii primordium under different humidity conditions by computer vision
ZHOU Jun,DING Wenjie1*,ZHU Xuejun,CAO Junyi,NIU Xueming(School of Mechanical Engineering,Ningxia University,Yinchuan 750021,China)
SummaryHumidity is one of significant factors affecting the quantity ofPleurotus eryngiiprimordium.Artificial statistics are necessary to count the number of primordium,since the model for prediction of the formation rate of primordium has not been developed.In this paper,computer vision based on statistics was applied to develop a formation rate model for primordium.To solve the problem of statistics on primordium,image preprocessing and gray recognition template extraction were firstly studied.The number of primordium was accounted on the basis of primordium size. However,recognition rate was low because of the similarity between primordium and background.Second,combined with the gray image matrix of primordium,a characteristic-genetic-screening method based on size and shape of primordium was proposed to extract the morphological characteristics of primordium seed,and a feature library of primordium seeds was built to display the characteristic data information.Then,the large data analysis was carried out on the morphological database based on genetic idea,and 12 seeds were acquired.A primordium quantity neural network prediction model was established based on back-propagation neural network in which matching quantity of primordium seeds was considered as input,the actual quantity of primordium as output.Primordium statistics were completed and verified,with accuracy up to 94.79%.According to the statistics on the primordium under different relative humidity conditions,the formation rate model of primordium was established.It is found that computer vision based statistical method for primordium can be used to evaluate the formation rate of primordium under different humidity conditions.
Pleurotus eryngiiprimordium;grayscale image;image recognition;seed
The organic edible fungus is one of the most industrialized productions of modern agriculture in Ningxia,China.Investigation on the effect of humidity change on primordium formation has great significance on the product promotion.
Image recognition technology has been applied to edible fungus since 1990s.The measurement of length, width and other shape descriptors were statistically analyzed to research mushrooms[1-2].An automated system by means of computer vision was established with features of color,shape,stem cut,and cap veil opening to detect and grade the mushrooms[3].The best separation rate in images for disabled mushrooms was achieved by enhancing color components and intensity[4].A system of grading shiitake was developed according to size,shape and color characteristics to classify automatically[5].An algorithm was investigated based on the size and position of mushrooms for robotic harvesting systems[6].In order to check defectives on the surface of mushroom,a discrimination model was built to recognize defectivePleurotus geesteranus[7]andLentinus edodes[8]by using computer image processing technology.In addition,an automatic shiitake grading systemwasstudied by computervisions[9-10].Tounderstand the morphological features ofPleurotus,a segmentation algorithm was proposed based on fuzzyC-means clustering and an improved ant colony algorithm[11].To meet therequirement of guidance and location of vision system,the region marking technique for mushroom image was proposed based on sequential scan[12],and mushroom picking robot[13]has also been applied to edible fungus based on computer vision.
A great of studies were focused on quality detection,classification,location and so on,belonging to large-scale single body.However,little work has been reported on the small-scale single body,such as primordium.In the period of primordium formation, hyphae constantly kink,small protrusions appear. Primordium is made by hyphal knots,which lead to the similarity between primordium and background,and it is hard for the primordium recognition.In this study, morphological characteristic templates based on the characteristic-genetic-screening method were obtained, to examine the influence of shape and size,to predict the quantity of primodium by neural network model, and to develop a formation rate model forPleurotus eryngiiprimordium.
1 Materials and methods
The samples ofP.eryngiiprimordium images were collected by digital camera in Changchengyuan edible fungi park in Pengyang County,Ningxia Hui Autonomous Region,China.The digital camera is Canon EOS 300D with 6.3 million effective pixels, 3 072×2 048 image resolution,13 mm focal length, 76°field of view and 15 cm shooting distance.The primordium images were captured by the camera facing perpendicularly toP.eryngiibag.In the experiment,1 984 images were collected,1 632 images of which were effective.All the applied equipments are shown in Table 1.
Two major parts were used to identify and choose primordium templates.The first is a preliminary study on quantitative statistics of primordium,including image acquisition,image preprocessing,template extraction in gray image and template matching. Another is the statistical model of primordium number in dense growth environment.They will be described in details in the following sections.

Table 1 Equipment
1.1 Preliminary study on quantitative statistics of primordium
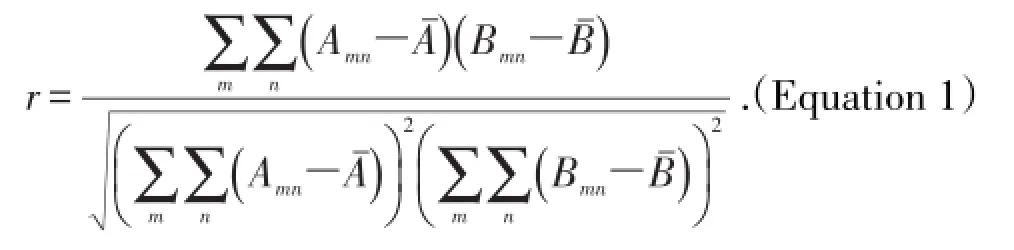
The original image of primordium is shown in Fig.1A.By camera,auxiliary tool(Fig.1B)and light emitting diode(LED)flashlight,primordium images (Fig.1C)were obtained.In order to strengthen the gradation characteristic information of primordium and restrain interference factors,the gray value was adjusted to[50,220]by[0,255]according to the gray level histogram(Fig.1D).The interference induced by drops under LED flashlight can be eliminated.Drops appeared at the period of cylindrical shell and primordium formation.After the enhancement of gradation processing,gray images of primordium(Fig. 1E)were obtained.Then a morphological processing was carried out on the basis of gray scale images to extract primordium features effectively(Fig.1F).
The features of primordium became more obvious after morphological opening operation.By examining the matrix of primordium gray image,the gray value of primordium corresponding to the data in matrix was the same.The around gray value was larger or less than the internal value,and overall structure was in a circular distribution.Thus the primordium recognition template was set to a circular structure.An example was applied to explain how to create a template of 10× 10.When the arc of the circle was through a grid and the grid was not in arc or the majority of grids were not in the arc,the number of grid was set to 0(Fig.2).
Template matching was the process of using temples to find the identical object in the same size from original images(Fig.3).
To represent the relevance between template A and objective B,correlation coefficientrwas applied to calculate the relevance between the template and unrecognized images.The formula ofrwas represented by:
In this experiment,r=1 was chosen to decide the degree of similarity.
As shown in Fig.1C,the size of primordium is different.A single size is difficult to express primordium information.Therefore,four different sizes of templates in 10×10,12×12,14×14 and 16× 16 were established.According to the recognition result obtained from different templates,the well matched template was selected in comparison of original images and the recognized images.Finally, the number of primordium was obtained,as shown in Fig.4.
Thirty-five primordium images were used to template matching and were compared with artificial statistics,so as to verify the effectiveness of primordium recognition templates.The result showed that recognition rate was slightly low with only 84.22%.The main reasons are summarized as:
1)The shape and size of primordium are different.The four recognition templates were designed only by size,thus not all characteristics of primordium could be well contained.
2)The primordium images were collected in the growth stage,and the shape and size were changed in this period.
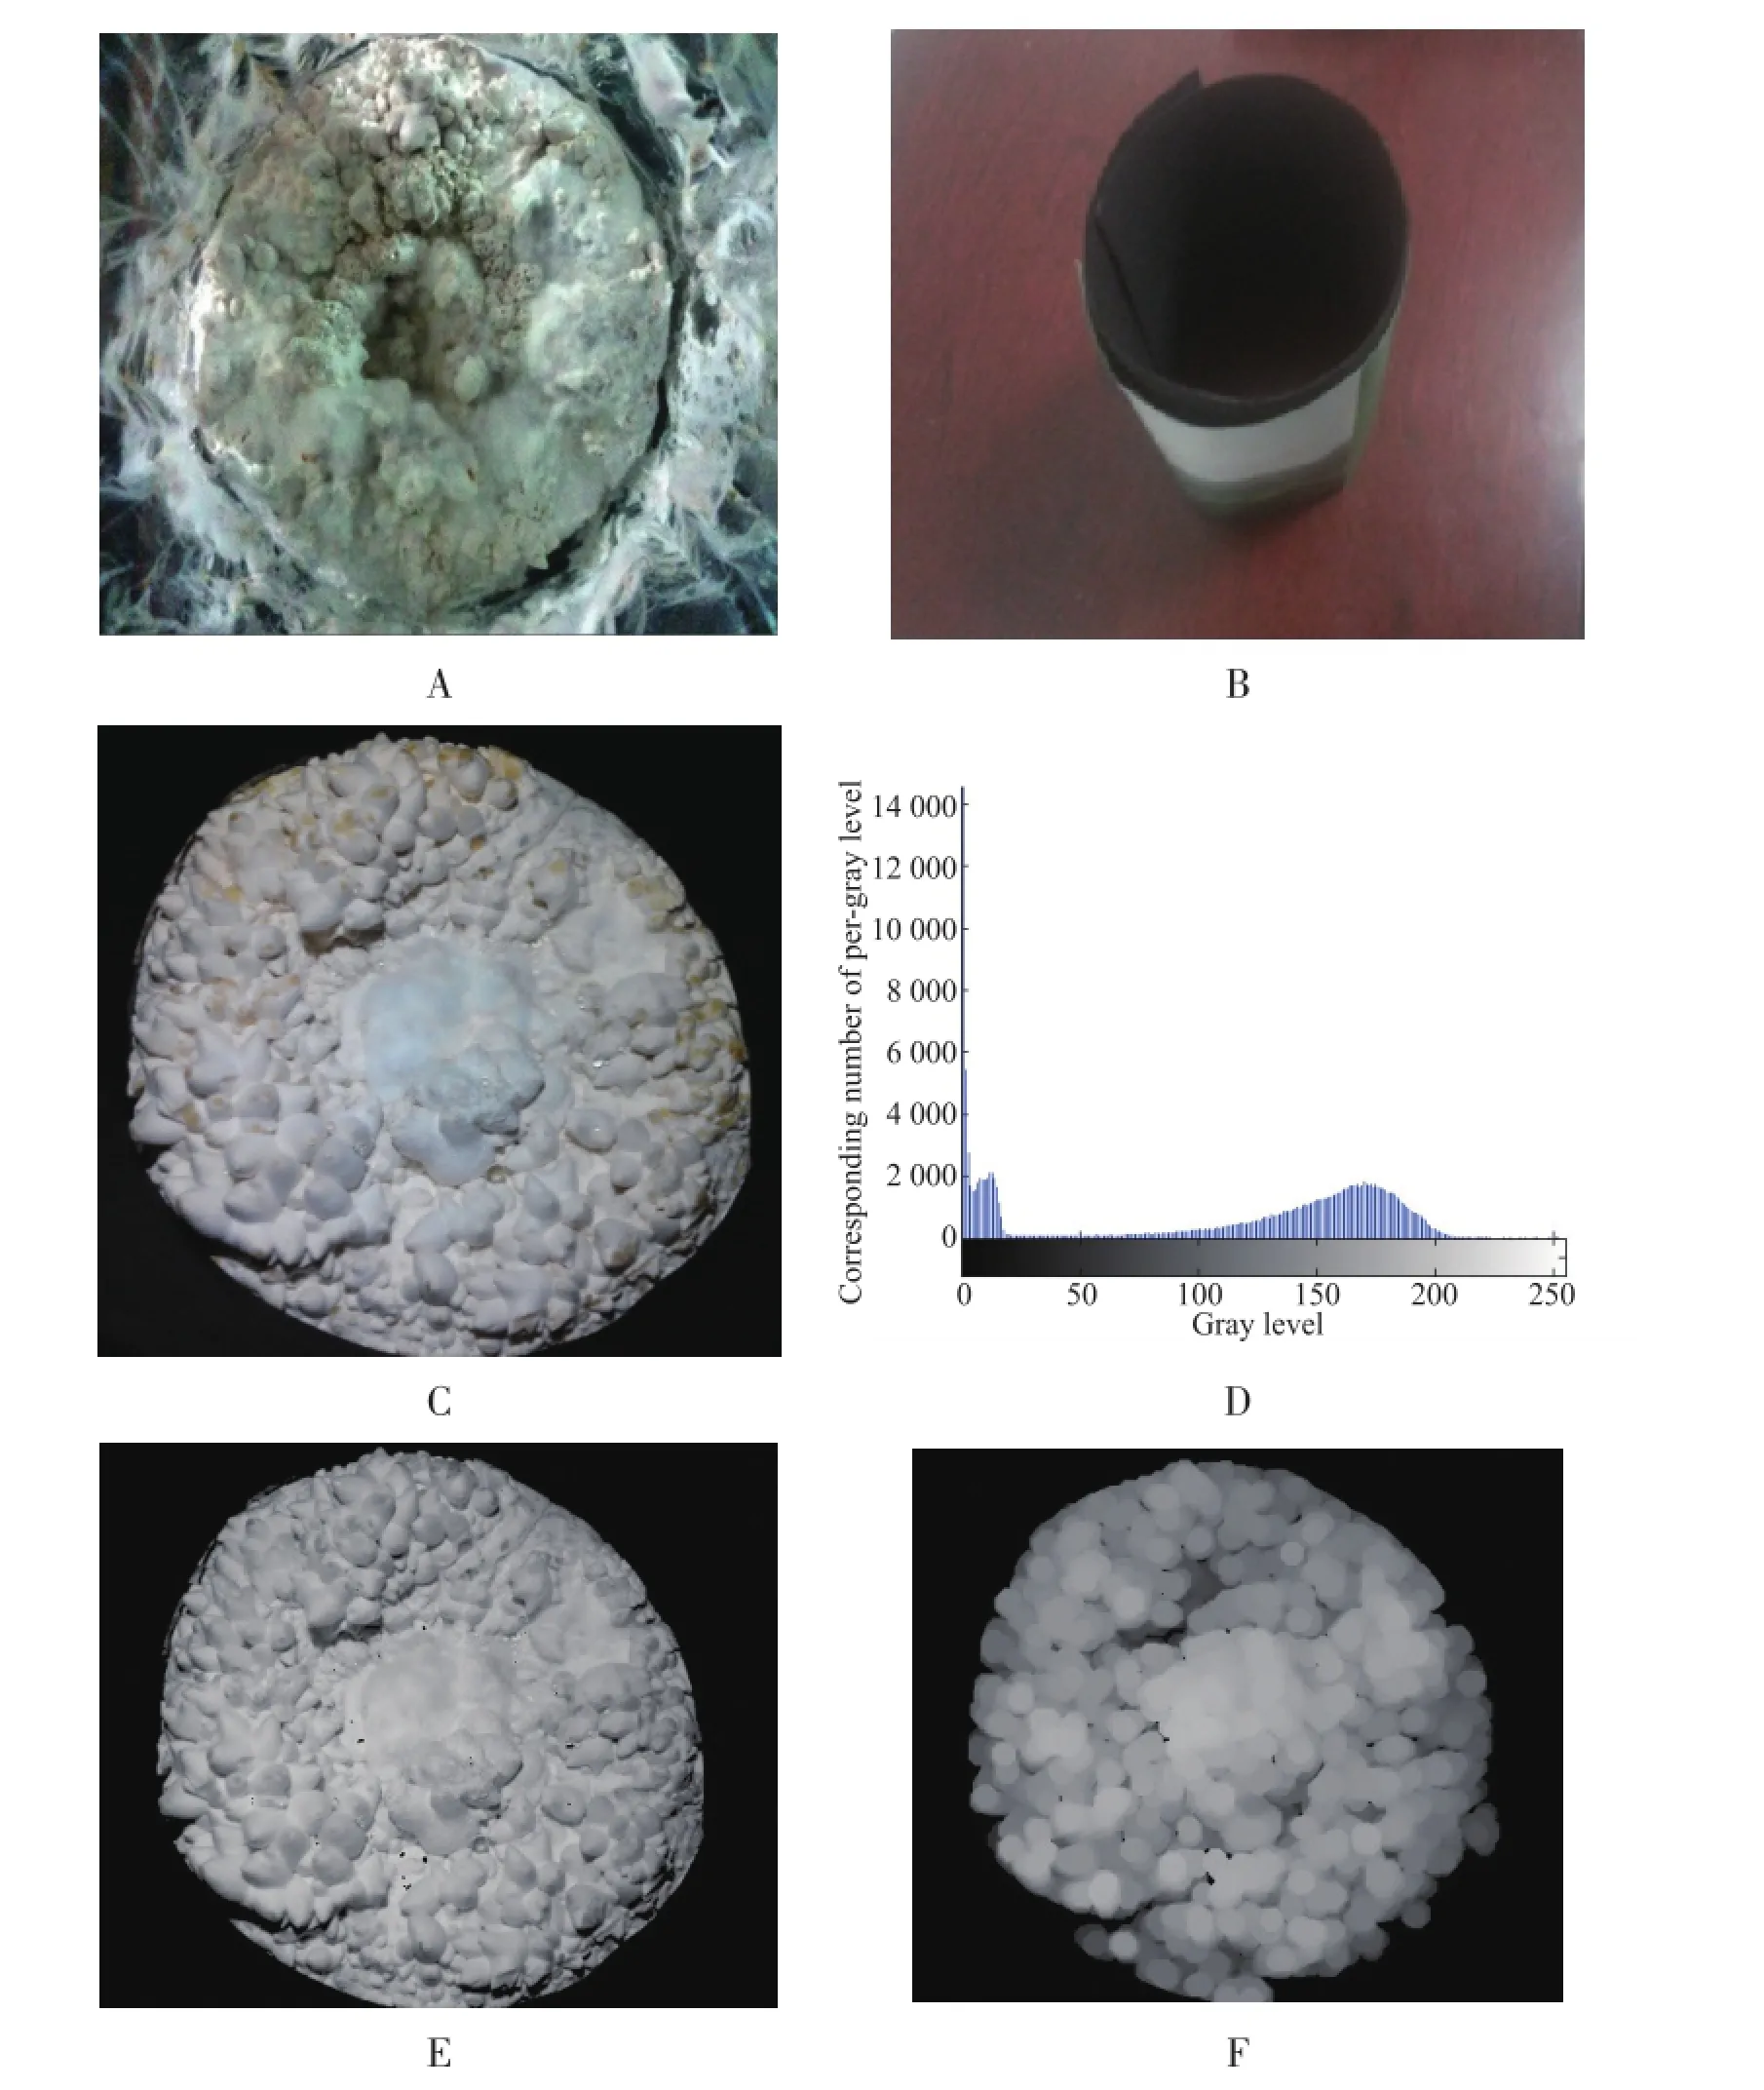
Fig.1 Image preprocessing ofPleurotus eryngiiprimordium
Primordium features can be recognized through gray scale based on template matching method. Additionally,the effectiveness of template matching was examined.However,the four recognition templates in different sizes were observed in failure of expression on the morphological information,resulting in recognition failure or partly unrecognized.Hence,it is necessary to find a better way to improve the recognition template.
1.2 Statistical model of primordium in dense growth environment
According to the above analysis,a new method of characteristic-genetic-screening is brought forward in this section.
1.2.1 The characteristic-genetic-screening method
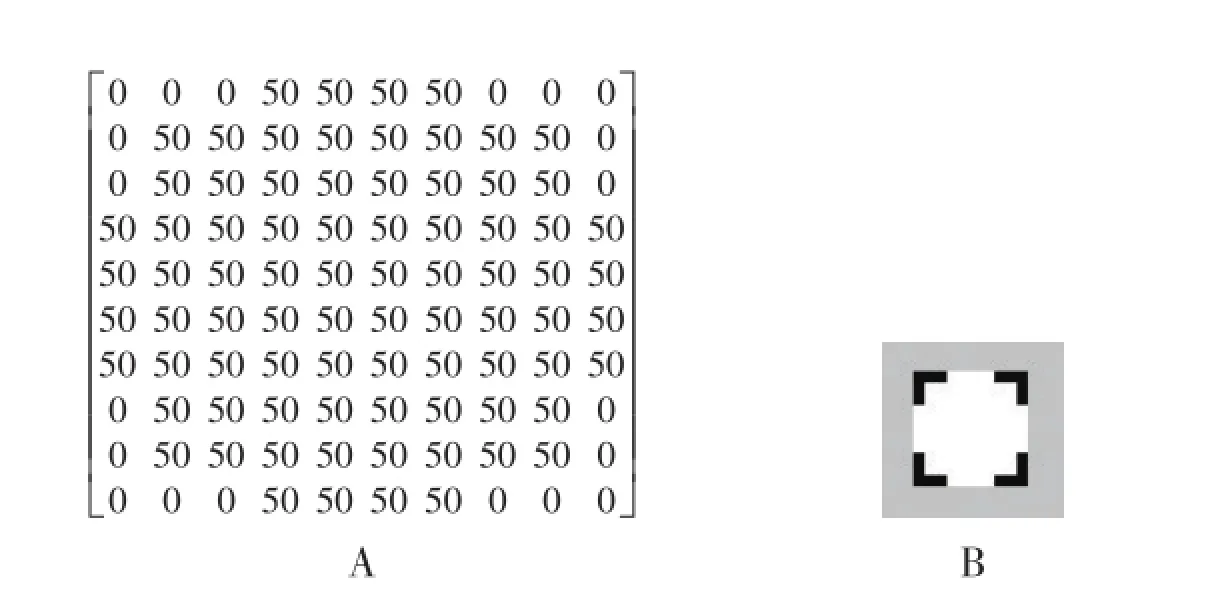
Fig.2 Recognition template of primordium
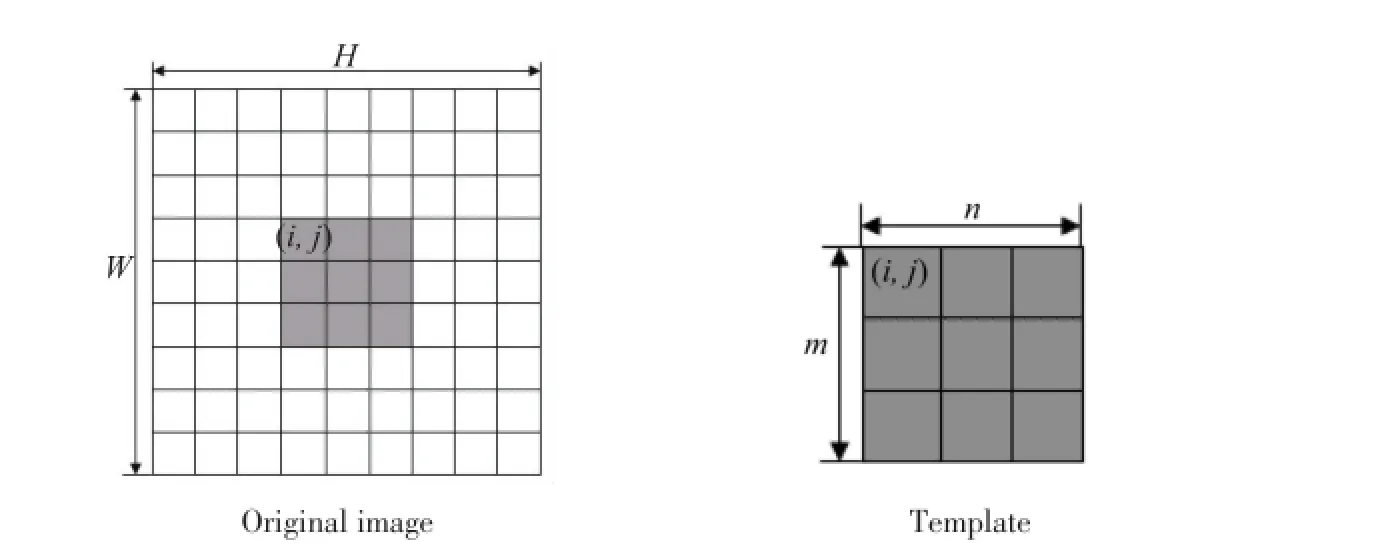
Fig.3 Principle of template matching

Fig.4 Recognition result of primordium number
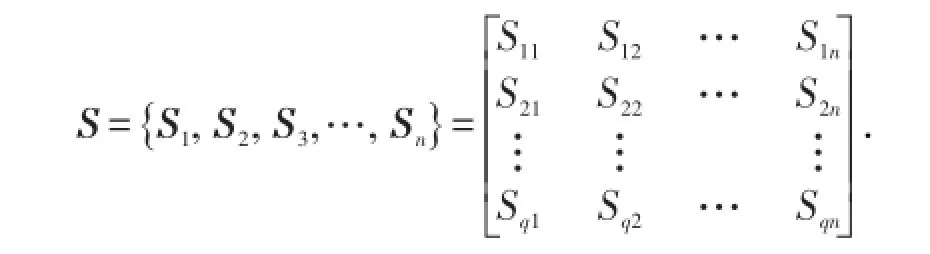
In primordium statistics,data processing can be considered as a finite set from template matching of view.The model of primordium seed is expressed as:
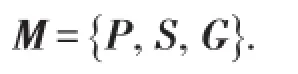
WherePis a descriptive feature set,which represents different features of objects;Sis a feature set,which represents the feature of each generation;Gis a screened feature set,which is of the rest of set after screening.The formula is unfolded:
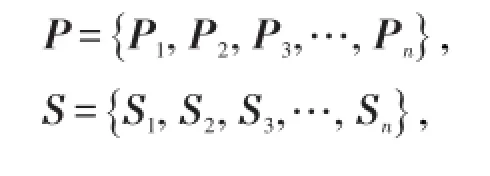

By the feature ofprimordium,the numberoffeature extraction can be represented byp={p1,p2,p3,…,pn}. Then refining the algorithm is applied to the basic features.Itisobtained:
Wheren=1,2,3,…,n.nis basic features.
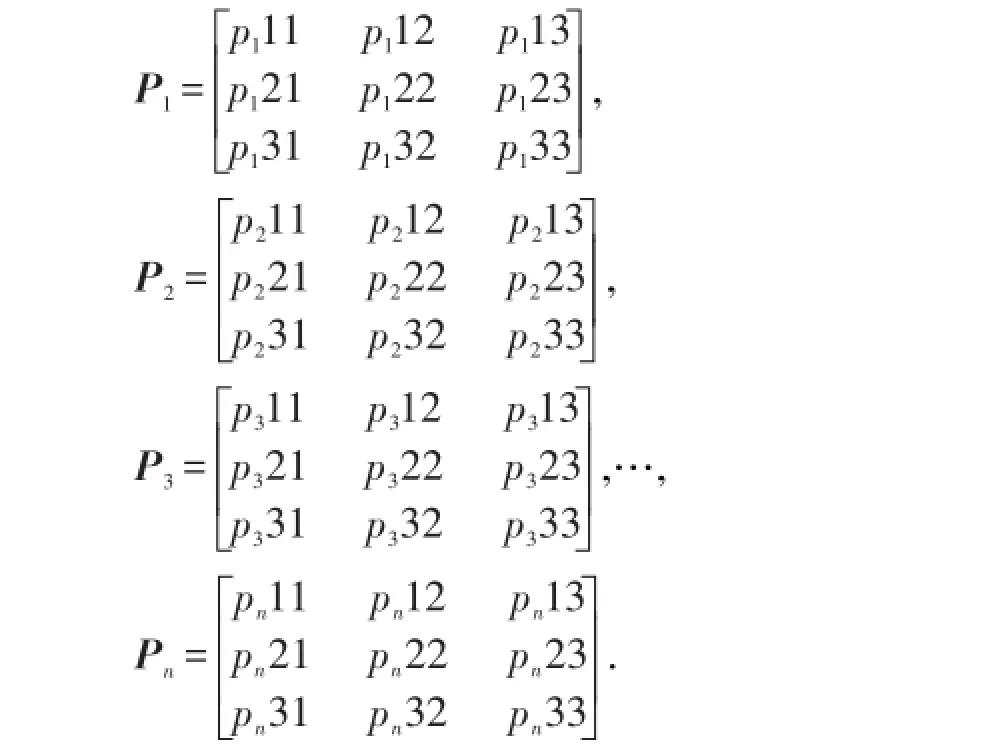
So far,the basic feature setP={P1,P2,P3,…,Pn} was obtained.In order to obtain a great of features, large data analysis was carried out to obtain some representative features which are the extension ofP.Itis obtained:
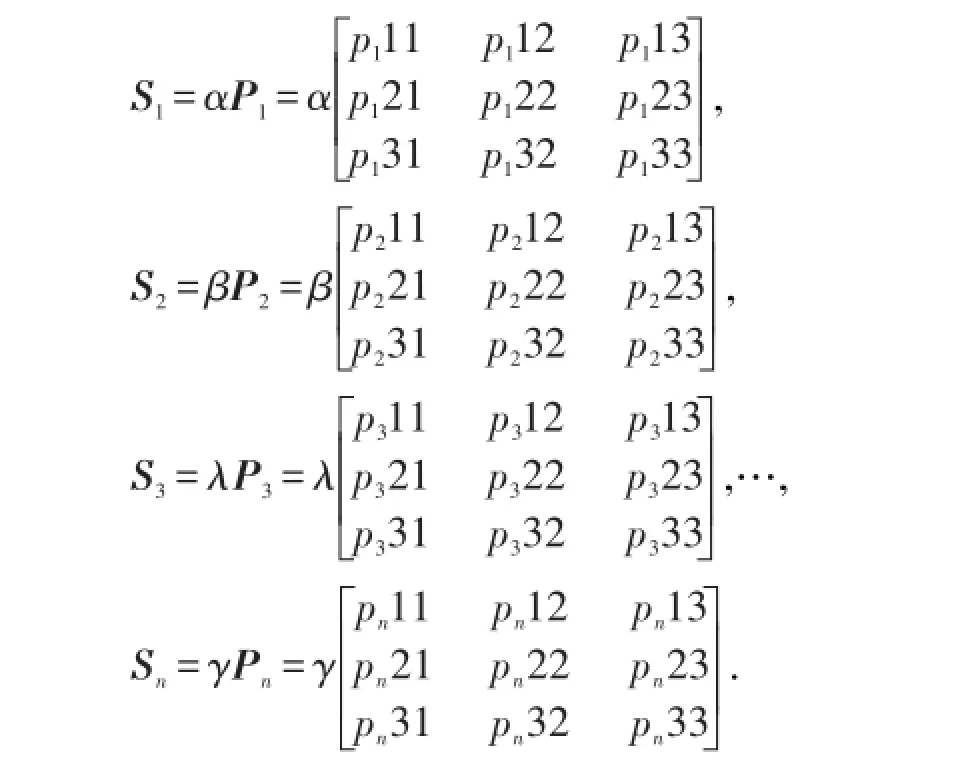
Whereα,β,λ,…,γare the characteristic expansion coefficient,respectively.
So,a total ofq×nfeatures were obtained,andSwas treated as a database of seeds which was the source of data analysis.
The seeds of database were cultivated,and the suitable seed characteristics were selected as the basis for final quantitative statistics.So the results are as follows:
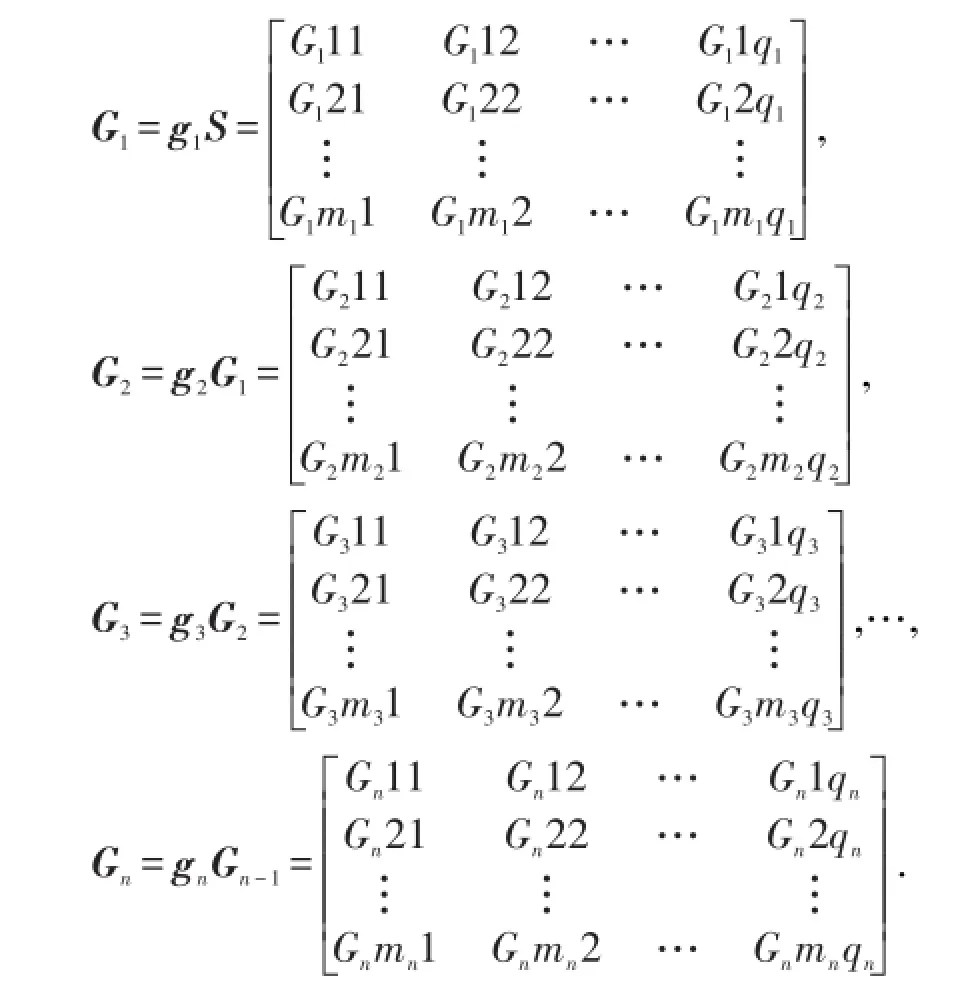
Whereg1,g2,g3,…,gn(n=1,2,3,…,n.nis a natural number)representseed selection rule ofeach generation.
Afterngenetic generations,Gnwas selected as the representative of seed features,and was used as the basis of quantitative identification.
The above process is characteristic-geneticscreening(CGS)method.
1.2.2 The application of characteristic-geneticscreening method
In order to make process traceability,the database of primordium images was set up byMicrosoft Office Access 2003to store information,such as the sequence number of seeds and names.In the database, a frame which corresponded to the primordium feature was stored for each primordium seed of each generation.Since the primordium image is the basic data of morphological characteristics,which determines the general characteristic of primordium, the selected primordium images must have a good typicality and representation.Therefore,it is not only to set up characteristic image database,but also to apply the large data method to analyze the characteristic database.
1.2.2.1 The first generation seed selection
As shown in Fig.1A,there are some differences in the shape and size of primordium.The shape of primordium has hemispheric,nearly spherical,semispheroidic,flat hemispherical,oval,half spindle, which can be represented byp={hemispherical, nearly spherical,semi-spheroidic,flat hemispherical, oval,half spindle}={p1,p2,p3,…,p6}.In order to show the characteristic of primordium accurately,the size and shape of the primordium were considered as an indicator.
Every primordium image contains a large number of primordium,and it is time consuming to extract the primordium template manually.Therefore,a“manual &auto”method was proposed to improve the efficiency of feature extraction.The process is shown as follows:
1)Extracting 54 initial primordium features manually.2)Referring to manual extraction,the primordium images are searched and matched.
In order to get the characteristic expansion coefficient,statistical method was used to analyze 20primordium images and 54 initial primordium features. Twenty-times matching work was carried out to obtain the different values ofrand the number of matching primordium with different primordium features.In the comparison of the above obtained matching primordium quantity and manually obtained matching primordium quantity,rwas determined.The primordium feature was extracted based onr≥0.85,which was called expansion coefficient,i.e.α,β,λ,…,γ≥0.85.
According to the method of primordium feature extraction,30 primordium images were processed. The extraction result was manually discriminated by removing images which do not have primordium features and unrecognized images on considering of 1/1 000 variation probability.At last,1 000 primordium seeds were reserved.
The reserved seeds were used as the first generation seeds.According to seed cultivation rules, the generic seeds were from generation to generation with better adaptability,and universal seeds were cultivated after eliminating poor adaptability seeds. These seeds were finally kept in the primordium feature database,recorded as“1-×××”.
1.2.2.2 The second generation seed selection
Taking seed 1-1 as an example,only one primordium was recognized at the most for 30 primordium images,whiler≥0.90,r≥0.80 andr≥0.85.The result showed poor universality with this kind of seeds,and thus be removed.At the same time, the matched seeds,such as seed 1-10 and 1-13,need to be removed as the number of primordium recognition is much higher than the number of due primordium images.
A screening process was taken for 1 000 first generation seeds,andr≥0.85 was used as the basis of discriminant.According to manual statistic results,the part of seeds with higher number than the actual number of seeds was removed.The rest part was used as the next generation seeds.
Based on above screening rules,a total of 410 seeds were selected as the second generation seeds and were stored in the database,recorded as“2-×××”.
1.2.2.3 The third generation seed selection
To study the seed adaptability,the adaptiverwhich mean matching numbers were close to actual numbers was calculated.In the experiment,the value ofrwas firstly calculated for 50 seeds.The result is shown in Fig.5.
Based on the collection of datar,the mean value, variance and standard deviation ofrwere calculated respectively.The range ofrwas determined by normal distribution,represented byr∈(r-σ,r+σ].It was calculated that the data in this range was 68.26%. Taking seed 2-1 as an example,the average ofrwas 0.840 7;the variance was 0.000 2;the standard deviation was 0.014 4;and thervalue range was (0.826 3,0.855 1].
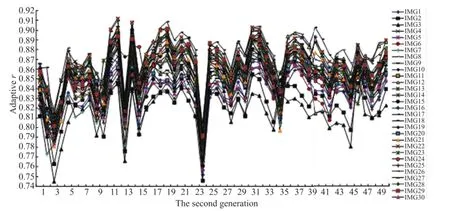
Fig.5 Adaptivervalue of the second generation seed
Based on the mean value and the range ofr,50 second-generation seeds were categorized.The identical orsimilarseedswith mean value ofrwere chosen.In this way,12 categories were obtained.Likewise,the rest of 360 seeds were categorized.Finally,12 seeds can be used asthethird generation seeds.
2 The neural network model based on primordium number prediction
2.1 The neural network model
By calculating 30 images with their adaptivervalue of 12 seeds,the matched primordium quantity was obtained with differentvaluesofr,asshown in Table 2.
According to the statistical results shown in Table 2,the matched primordium quantity was seen as an independent variable,marked asX,and the actual quantity of primordium was marked asY,thus the specific expressionfwas obtained.It was found that the samples were not linear because the data were random after regression analysis.Hence,it was difficult to get the specific relationship betweenXandYdirectly.Considering a good nonlinear mapping ability and wide application,the neural network was used to fit the data and obtain the relationship betweenXandY.According to the Kosmogorov theorem,three-layer back propagation(BP)neural network can approximate any continuous function with a reasonable and appropriate weight.So a single hidden layer BP neural network model was established to reduce the difficulty of network training,as shown in Fig.6.
It is necessary to preprocess the collected data and determine the hidden layer nodes of neural network before the prediction model is established. The data of matched primordium quantity were normalized to a range of 0-1,which reduced changes in the order of magnitude.Ten nodes in hidden layer were selected on the basis of experience.The number of the matched primordium of the third generation seeds was used as input of neural network,and the manually recognized primordium was seen as output. So the feed-forward neural network prediction model was established for the number of primordium.The regression analysis graph,shown in Fig.-7, was obtained after several times training.The result showed a high correlation between the output samples and objectives.
2.2 The verification of models
To verify the prediction ability of BP neuralnetwork,50 primordium images were analyzed.As shown in Fig.8,it was more accurate of applying the neural network to prediction models by 12 seeds.The average recognition accuracy was up to 94.79%by accurate recognition calculations.It indicated high recognition ability for 12 seeds selected with the above mentioned method.It can be used as the representative of the morphological characteristics of the primordium.
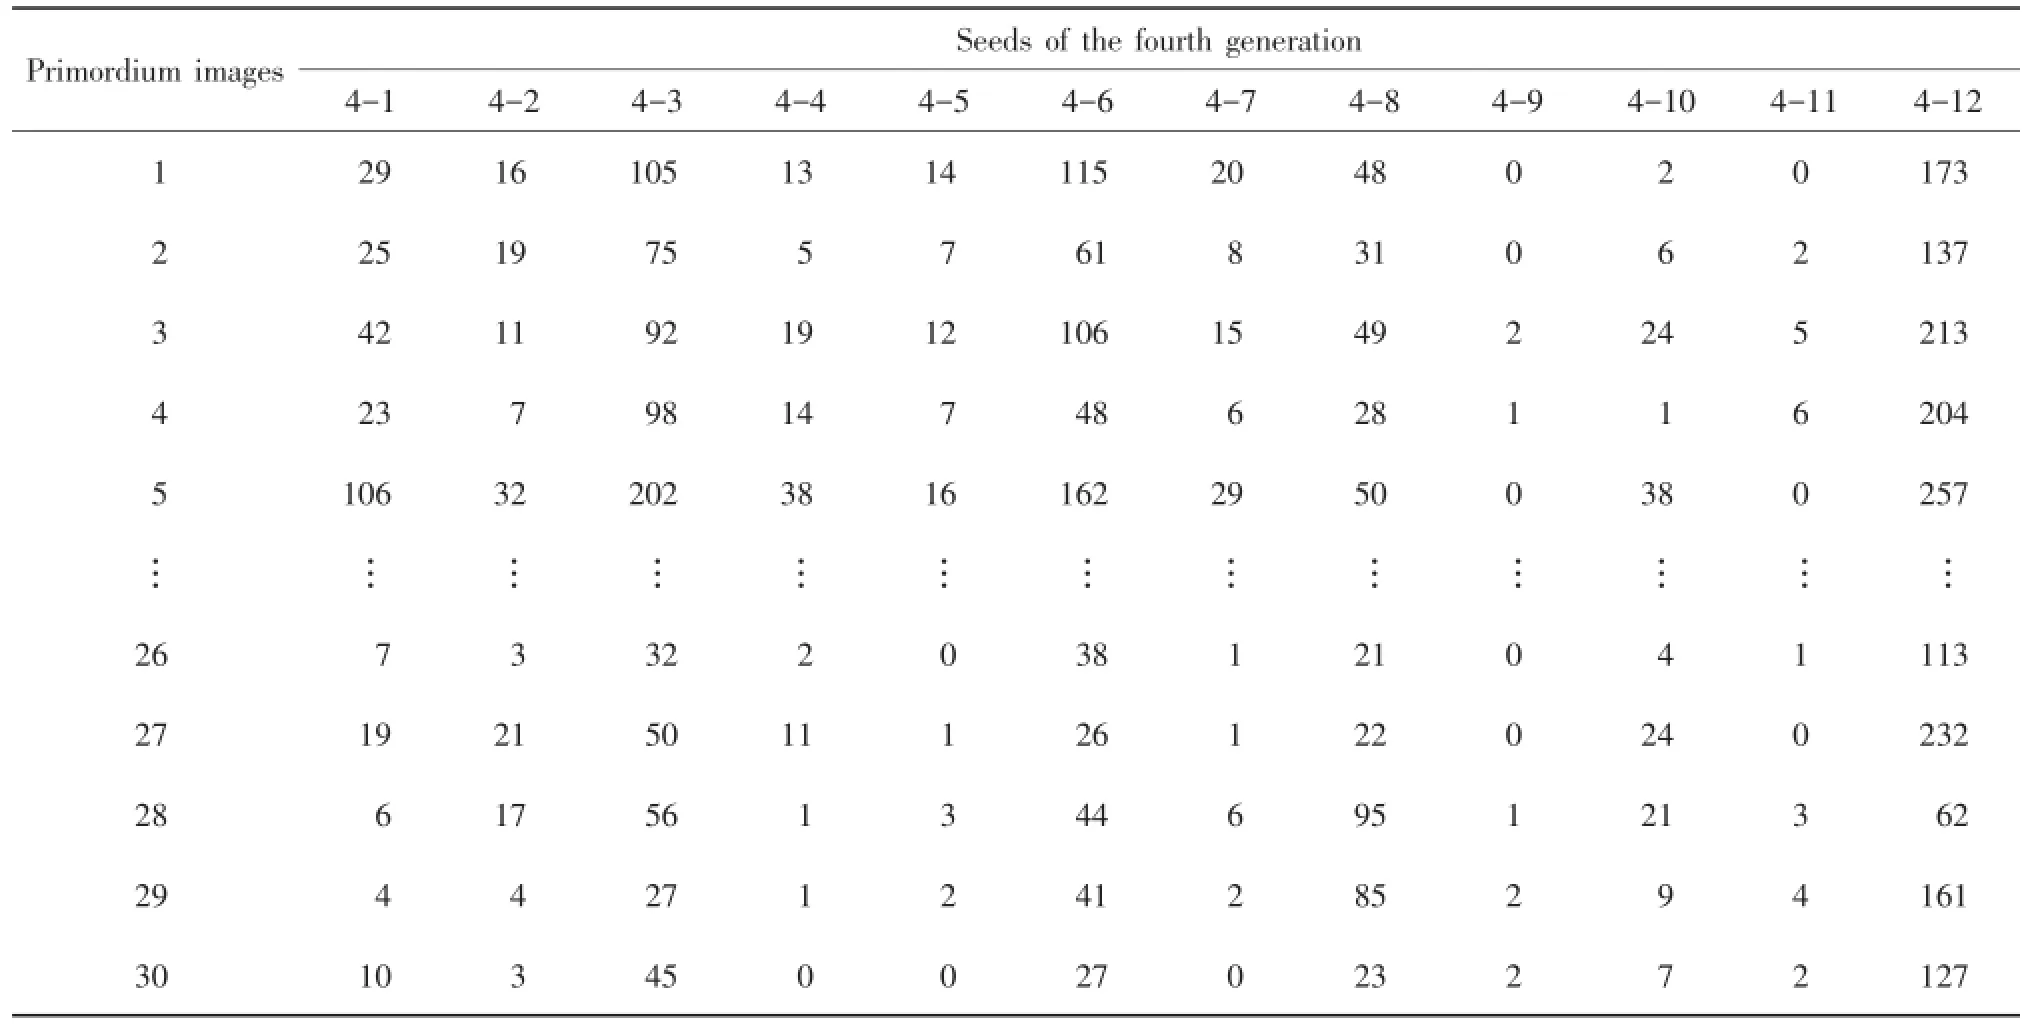
Table 2 Matched primordium quantity under different mean values ofr
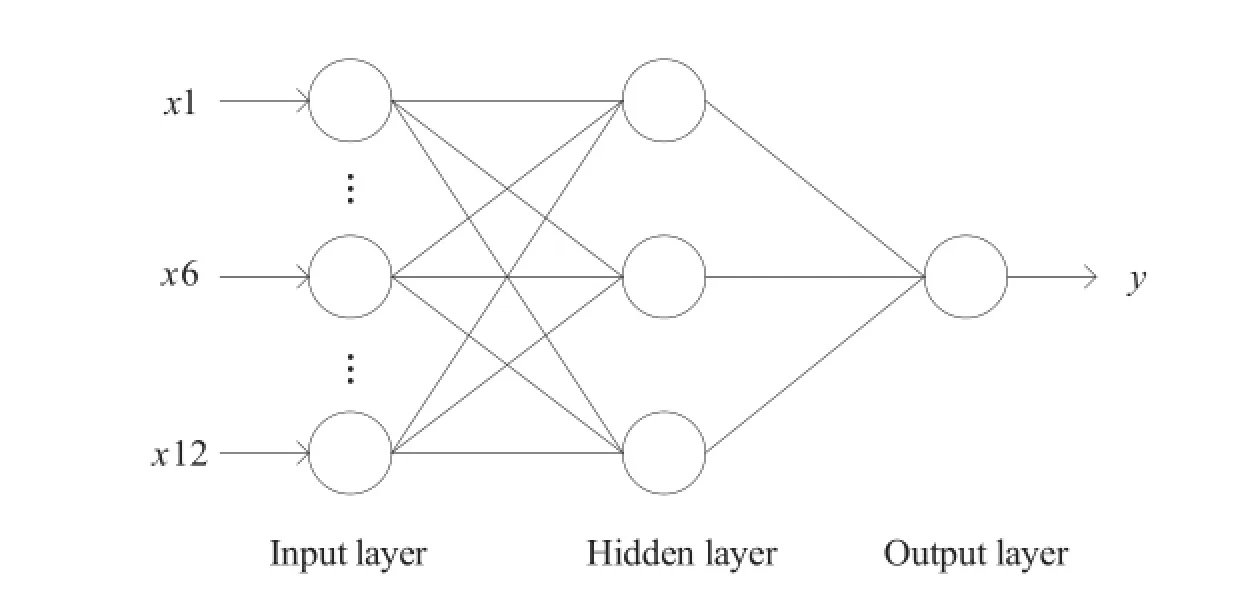
Fig.6 Back propagation(BP)neural network construction
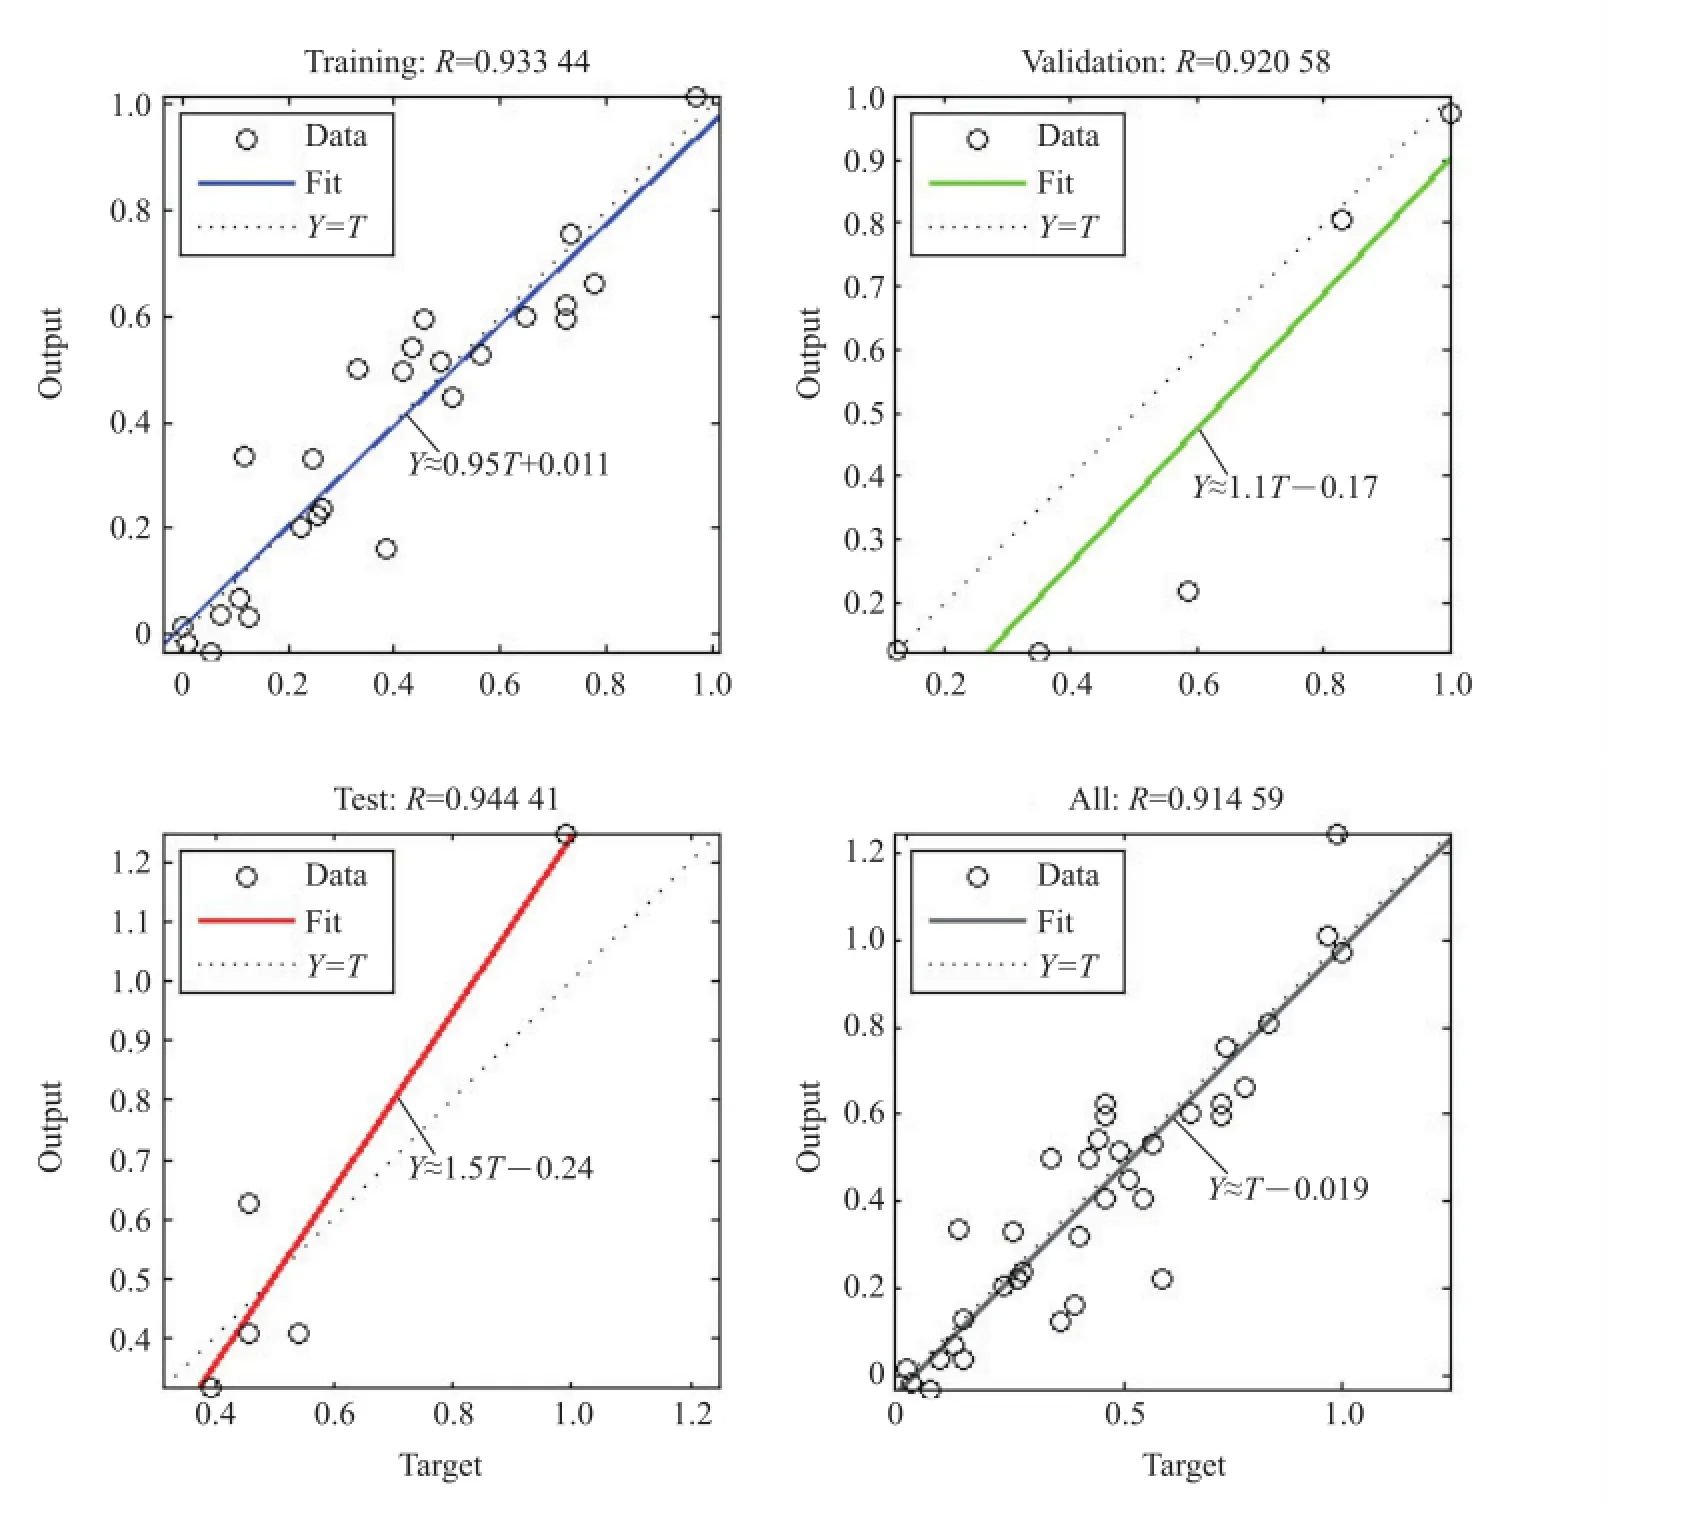
Fig.7 Regression analysis of the model
3 The experiment of primordium growth rate
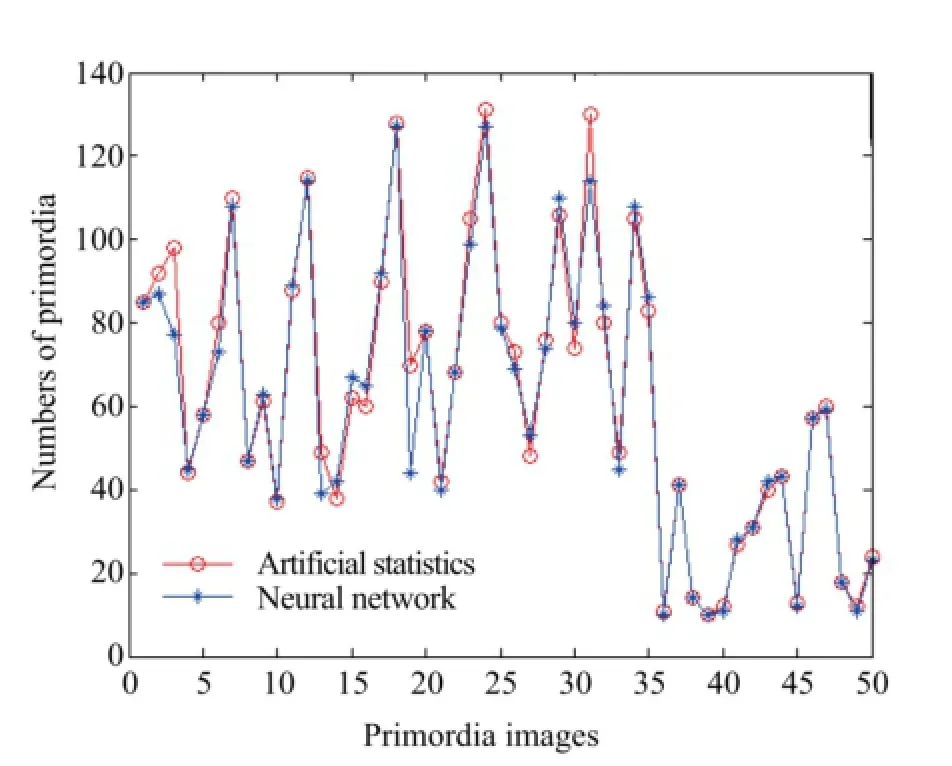
Fig.8 Statistical analysis of the number of primordium
The formation quantity of primordium under four different relative humidity conditions was obtained by analyzing the gathered primordium images from the above mentioned method(Fig.9).It was showed that the change of primordium quantities was basically accordant with different humidities.The number of primordium increased with time.It took about 4.5 days to maximize the number of primordium,then decreased.These results were in accordance with the research of YUet al.[15],and this testified the validity of the prediction model on the other side.
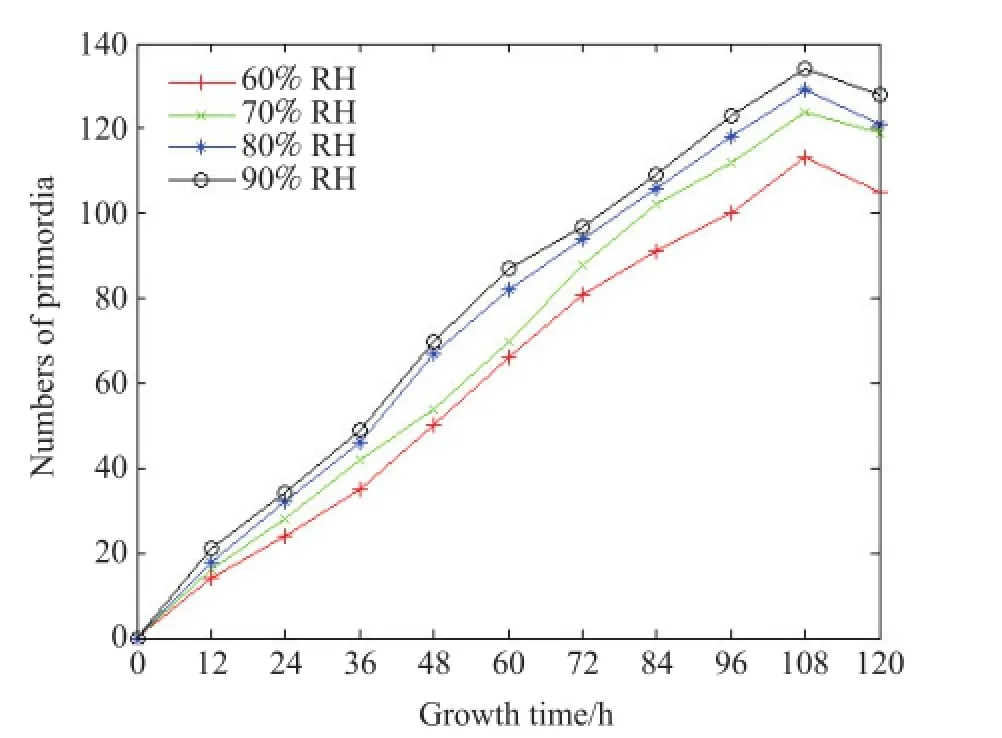
Fig.9 Variations of primordium quantities under different relative humidities(RHs)
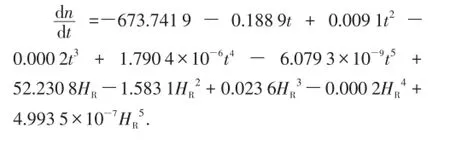
The model of formation rate(△n-HRmodel)was proposed and was represented by:
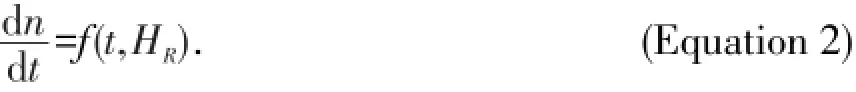
Wherenis the number of primordium;tis growth time;HRis the relative humidity conditions of primordium.
The relationship among the above mentioned data was obtained by fitting them.
4 Conclusions
4.1 The feature statistics-template matching is established,based on the analysis of information characteristics of primordium image such as digital features and gray distribution.The characteristicgenetic-screening(CGS)method is proposed to explore the statistics method for intensive number of primordium single body with big data analysis,to provide theoretical basis of statistics on the number of primordium.
4.2 Through the genetic selection of characteristic seeds,characteristic primordium quantity database was set up and supported by the neural network prediction model of primordium quantities.The accuracy rate of primordium quantities was up to 94.79%,higher than the size-based templates of 10.57%.Therefore,it is proved to be effective and feasible by using CGS method.
4.3 The primordium formation rate model was set up with the support of the prediction neural network model of primordium quantities.The results suggest that the△n-HRmodel reflects the trend which tallies with the growth law of primordium.
[1]VAN DE VOOREN J G,POLDER G,VAN DER HEIJDEN G W A M.Application of image analysis for variety testing of mushroom.Euphytica,1991,57(3):245-250.
[2]VAN DE VOOREN J G,POLDER G,VAN DER HEIJDEN G W A M.Identification of mushroom cultivars using image analysis.Transactions of the ASAE,1992,35(1):347-350.
[3]HEINEMANN P H,HUGHES R,MORROW C T,et al.Grading of mushrooms using a machine vision system.Transactions of the ASAE,1994,37(5):1671-1677.
[4]VÍZHÁNYÓ T,FELFÖLDI J.Enhancing colour differences inimages of diseased mushrooms.Computers and Electronics in Agriculture,2000,26(2):187-198.
[5]CHEN H H,TING C H.The development of a machine vision system for shiitake grading.Journal of Food Quality,2004,27(5): 352-365.
[6]TILLETT R D,BATCHELOR B G.An algorithm for locating mushrooms in a growing bed.Computers and Electronics in Agriculture,1991,6(3):191-200.
[7]黄星奕,姜爽,陈全胜,等.基于机器视觉技术的畸形秀珍菇识别.农业工程学报,2010,26(10):350-354. HUANG X Y,JIANG S,CHEN Q S,et al.Identification of defectPleurotus geesteranusbased on computer vision.Transactions of the Chinese Society of Agricultural Engineering,2010,26(10):350-354.(in Chinese with English abstract)
[8]李江波,王靖宇,苏忆楠,等.基于计算机视觉的香菇缺陷检测.包装与食品机械,2010,28(5):1-5. LI J B,WANG J Y,SU Y N,et al.Defects detection ofLentinus edodessurface based on computer vision technology.Packaging and Food Machinery,2010,28(5):1-5.(in Chinese with English abstract)
[9]潘海兵,陈红.香菇自动检测分级系统的研究//中国农业工程学会2011年学术年会论文集.2011. PAN H B,CHEN H.Research on the automatic detecting and grading system of edodes//Chinese Society of Agricultural Engineering.2011.(in Chinese with English abstract)
[10]陈红,夏青,左婷,等.基于纹理分析的香菇品质分选方法.农业工程学报,2014,30(3):285-292. CHEN H,XIA Q,ZUO T,et al.Quality grading method of shiitake based on texture analysis.Transactions of the Chinese Society of Agricultural Engineering,2014,30(3):285-292.
[11]WANG Y S,ZHAO J Y,GUO Q,et al.Segmentation algorithm for the image ofPleurotus eryngiimorphological features.Agricultural Network Information,2010(1):15-18.
[12]俞高红,骆健民,赵匀.基于序贯扫描算法的区域标记技术与蘑菇图像分割方法.农业工程学报,2006,22(4):139-142. YU G H,LUO J M,ZHAO Y.Region marking technique based on sequential scan and segmentation method of mushroom images.Transactions of the Chinese Society of Agricultural Engineering, 2006,22(4):139-142.(in Chinese with English abstract)
[13]周云山,李强,李红英,等.计算机视觉在蘑菇采摘机器人上的应用.农业工程学报,1995,11(4):27-32. ZHOU Y S,LI Q,LI H Y,et al.Application of computer vision in mushroom picking robot.Transactions of the Chinese Society of Agricultural Engineering,1995,11(4):27-32.(in Chinese with English abstract)
[14]ZHAO L,ZHU X J.The development of remote monitoring system for cultivation environment ofPleurotus eryngii//The IEEE International Conference on Information and Automation.2015:2643-2648.
[15]于海龙,杨娟,尚晓冬,等.工厂化生产中相对湿度对杏鲍菇生长的影响.上海农业学报,2011,27(4):18-21. YU H L,YANG J,SHANG X D,et al.Effect of relative humidity onPleurotus eryngiigrowth in factory cultivation.Acta Agriculturae Shanghai,2011,27(4):18-21.(in Chinese with English abstract)
基于机器视觉的不同湿度下杏鲍菇原基形成速率评估(英文).
周军,丁文捷*,朱学军,曹军义,牛雪明(宁夏大学机械工程学院,银川750021)
作为生长发育中的关键影响因子之一,湿度变化对控制杏鲍菇原基形成数量有重要的生产意义。然而,目前统计原基数量仍以人工为主且尚未建立起相应的原基形成速率模型。因此,本文采用以机器视觉为基础的原基数量统计方法来建立原基形成速率模型。为解决原基数量统计问题,首先对原基图像预处理、灰度识别模板提取等进行研究,采用以原基尺寸为依据的识别模板对原基数量进行识别统计,然而识别率较低;进而结合原基灰度图像矩阵表现形式,提出了基于原基尺寸和形状的“遗传-特征-筛选”的方法提取原基形态特征种子,并建立原基种子形态特征库,以便直观显示种子特征数据信息;接着采用基于遗传思想的原基种子挖掘方法对原基种子形态特征库进行大数据分析,得到12个适用于原基形态特征提取的种子。借助反向传播神经网络,以种子匹配原基数量为输入、实际原基数量为输出建立了原基数量神经网络预测模型,实现了原基数量的统计。验证结果表明,原基数量统计准确率达到94.79%。根据不同相对湿度下的原基数量统计结果,建立了原基形成速率变化模型。试验表明,基于机器视觉的原基数量统计方法能够对不同湿度下的原基形成速率进行评估。
杏鲍菇原基;灰度图像;图像识别;种子
TP 391.4;S 646
A
10.3785/j.issn.1008-9209.2016.04.113
浙江大学学报(农业与生命科学版),2017,43(2):262-272
Foundation item:Supported by National Natural Science Foundation of China(No.61263007),the National Science and Technology Support Program of China(No.2013BAD16B04).
*Corresponding author:DING Wenjie(http://orcid.org/0000-0001-5608-6016),E-mail:dwjnet@zju.edu.cn
ZHOU Jun(http://orcid.org/0000-0002-4027-2356),E-mail:jixiezhoujun@126.com
Received:2016-04-11;Accepted:2016-08-12
猜你喜欢
北京航空航天大学学报(2022年6期)2022-07-02
植物研究(2021年1期)2021-02-26
天津医科大学学报(2021年1期)2021-01-26
植物研究(2020年6期)2020-03-05
中国信息技术教育(2020年2期)2020-02-02
照明工程学报(2019年3期)2019-07-09
计算机应用(2018年10期)2018-11-22
图书馆界(2017年3期)2017-09-13
科技与创新(2015年12期)2015-07-21
湖北农业科学(2014年6期)2014-07-02
