
Apparent diffusion coefficient by diffusion-weighted magnetic resonance imaging as a sole biomarker for staging and prognosis of gastric cancer
2017-07-18 11:01FrancescoGigantiAlessandroAmbrosiDamianoChiariElenaOrsenigoAntonioEspositoElenaMazzaLucaAlbarelloCarloStaudacherAlessandroDelMaschioFrancescoDeCobelli
Francesco Giganti, Alessandro Ambrosi, Damiano Chiari,, Elena Orsenigo, Antonio Esposito, Elena Mazza, Luca Albarello, Carlo Staudacher,, Alessandro Del Maschio, Francesco De Cobelli
1Department of Radiology and Experimental Imaging Center, San Raffaele Scientific Institute, Milan, Italy;2Vita-Salute San Raffaele University, Milan, Italy;3Department of Surgery, San Raffaele Scientific Institute, Milan, Italy;4Department of Oncology, San Raffaele Scientific Institute, Milan, Italy;5Pathology Unit, San Raffaele Scientific Institute, Milan, Italy
Apparent diffusion coefficient by diffusion-weighted magnetic resonance imaging as a sole biomarker for staging and prognosis of gastric cancer
Francesco Giganti1,2, Alessandro Ambrosi2, Damiano Chiari2,3, Elena Orsenigo3, Antonio Esposito1,2, Elena Mazza4, Luca Albarello5, Carlo Staudacher2,3, Alessandro Del Maschio1,2, Francesco De Cobelli1,2
1Department of Radiology and Experimental Imaging Center, San Raffaele Scientific Institute, Milan, Italy;2Vita-Salute San Raffaele University, Milan, Italy;3Department of Surgery, San Raffaele Scientific Institute, Milan, Italy;4Department of Oncology, San Raffaele Scientific Institute, Milan, Italy;5Pathology Unit, San Raffaele Scientific Institute, Milan, Italy
Objective:To investigate the role of apparent diffusion coefficient (ADC) from diffusion-weighted magnetic resonance imaging (DW-MRI) when applied to the 7th TNM classification in the staging and prognosis of gastric cancer (GC).
Methods:Between October 2009 and May 2014, a total of 89 patients with non-metastatic, biopsy proven GC underwent 1.5T DW-MRI, and then treated with radical surgery. Tumor ADC was measured retrospectively and compared with final histology following the 7th TNM staging (local invasion, nodal involvement and according to the different groups — stage I, II and III). Kaplan-Meier curves were also generated. The follow-up period is updated to May 2016.
Results:Median follow-up period was 33 months and 45/89 (51%) deaths from GC were observed. ADC was significantly different both for local invasion and nodal involvement (P<0.001). Considering final histology as the reference standard, a preoperative ADC cut-off of 1.80×10⁻³mm2/s could distinguish between stages I and II and an ADC value of ≤1.36×10⁻³mm2/s was associated with stage III (P<0.001). Kaplan-Meier curves demonstrated that the survival rates for the three prognostic groups were significantly different according to final histology and ADC cut-offs (P<0.001).
Conclusions:ADC is different according to local invasion, nodal involvement and the 7th TNM stage groups for GC, representing a potential, additional prognostic biomarker. The addition of DW-MRI could aid in the staging and risk stratification of GC.
Apparent diffusion coefficient; diffusion-weighted magnetic resonance imaging; gastric cancer; prognosis; TNM staging
View this article at:https://doi.org/10.21147/j.issn.1000-9604.2017.02.04
Introduction
Gastric cancer (GC) is the fourth most common cancer worldwide, with poor prognosis and survival rate for advanced stages (1). Substantial differences exist in the incidence and among different ethnic groups within the same region (1-3). An accurate preoperative assessment is crucial to delineate the initial approach to therapy (surgeryvs.neoadjuvant therapy). Endoscopic ultrasonography (EUS) is the most reliable method to evaluate the depth of invasion of primary GC, particularly for early stages (4,5).
Multidetector computed tomography (MDCT) is a noninvasive technique, useful to evaluate metastatic disease, ascites, or distant nodal spread (6-8). The role of positron emission tomography (PET) in the preoperative staging of GC is still evolving (9).
Recently, new advances in diffusion-weighted magnetic resonance imaging (DW-MRI) have confirmed the potential value of this technique for the gastrointestinal tract (10,11). On DW-MRI, pathological tissue is characterized by higher signal intensity than normal structures (12,13). This technique reflects the mobility of water molecules in biological tissues through the measurement of the apparent diffusion coefficient (ADC), a quantitative marker that has shown great promise as a prognostic factor and a potential biomarker for neoadjuvant therapy response for different tumors, including GC (14,15). Pathological tissues, showing a higher cellularity and decreased extracellular space, result in a restriction of water diffusion and, consequently, lower ADC values.
The 7th staging criteria schema of the American Joint Committee on Cancer (AJCC) and the Union for International Cancer Control (UICC) is based upon TNM classifications (16). There has been an ongoing debate whether gastro-esophageal junction lesions (Siewert II and III) should be staged as esophageal or gastric cancer (17), with interesting results supporting the latter (18). The validation of the 7th TNM edition has been analyzed in several studies, proving that the 7th edition is more accurate than the 6th edition when it comes to prognosis (19-21).
However, there is evidence that GC in Eastern countries (Asia predominantly) may differ biologically from the Western world (22,23). Also, there is a survival advantage for Asian patients with GC, mostly due to the early diagnosis (as mass screening is uncommon in the Western world) and the higher extent of lymphadenectomy performed in the Eastern world (24).
As a consequence, data on the prognostic value of the 7th TNM classification in Western countries are scarce (25-29). A recent multicenter study has proposed a new stage grouping for GC, urging the scientific community to refine the UICC/AJCC TNM classification basing on worldwide data (30). Röckenet al. have also reported that other variables (in addition to T and N stage) can influence patient survival in GC and have pointed out the need to investigate novel prognostic biomarkers able to reliably differentiate different prognostic groups in patients with GC (31). There is growing evidence supporting the use of DW-MRI with regard to TNM staging for GC (32,33).
Hence, given both the great interest for new molecular biomarkers (31,34) and the lack of published data from the Western world in this regard, we evaluated the value of ADC from DW-MRI in the staging and prognosis of GC on a high-volume European single-center basis.
Materials and methods
This is a retrospective study of a single cohort that follows the Standards for Reporting of Diagnostic Accuracy (STARD) guidelines, in accordance with the World Medical Association of Helsinki and good clinical practice guidelines. All data were retrieved from a previous database of a prospective study on gastro-esophageal tumors that enrolled patients from October 2009 to May 2014. The Medical Ethics Committee of San Raffaele Scientific Institute approved the protocol, and all patients gave their written informed consent. The follow-up period is updated to May 2016.
Eligibility criteria
In this study, the initial population that was retrieved comprised 173 patients. The patients were enrolled according to the following criteria: 1) biopsy-proven Siewert II–III or GC; 2) visible tumor on DW-MRI; and 3) fitness for surgery. The exclusion criteria were the following: 1) neoadjuvant therapy following initial imaging (n=47); 2) poor image quality (n=2); 3) no visible tumor on DW-MRI (n=5); 4) stage IV disease (n=24); or 5) no surgical data available, for comorbidities (n=2) or because patients were treated at other institutions (n=4). The final population consisted of 89 patients who underwent surgery.
Study design
The extent of surgical resection was carried out according to the Japanese Gastric Cancer Association (JGCA) guidelines (35). The final diagnosis of GC was assessed by histopathological examination of resected specimens, according to the 7th TNM edition (16).
DW-MRI protocol and evaluation
All patients were scanned on the same 1.5T MR system (Achieva, Philips Medical Systems, Best, The Netherlands) using a five-channel phased-array cardiac coil positioned according to tumor location, with cardiac and respiratorytriggering. Before the start of the examination, patients were invited to drink 500 mL of water and Ferumoxsil (Lumirem®; Guerbet, Roissy CdG Cedex, France) in order to distend the gastric walls; an intramuscular injection of scopolamine-butylbromide (20 mg, Buscopan®, Boehringer Ingelheim GmbH, Ingelheim, Germany) was also administered after patient positioning, in order to minimize intestinal peristalsis.
The protocol study was performed according to some previous studies (13,15). For the sake of completeness, it is important to stress that we performed a multiplanar T2-weighted study, followed by a DW-MRI protocol (usingbvalues of 0 and 600 s/mm2) and a dynamic T1-weighted study (DCE) during intravenous injection of 0.1 mL/kg of body weight of gadobutrol (Gadovist®, 1 mmol/mL; Bayer Schering Pharma, Berlin, Germany).
Image analysis
Two experienced radiologists (FG and FDC with 7 and more than 20 years of experience in abdominal MRI, respectively) who were privy only to tumor location reviewed independently all DW-MRI scans. Specifically, they were blinded to histopathological results (including TNM staging) and patients’ outcome. Definitions of imaging characteristics of GC on DW-MRI were based on previous studies (36).
Image quality was sufficient to evaluate tumor ADC values in all patients. Quantitative measurements were obtained tracing a small region of interest (ROI) on the ADC map, so as to minimize partial volume effects. During ROI placement, readers made also reference to T2-weighted, DW-MRI and DCE sequences to identify the lesion (Figure 1).
Statistical analysis
Continuous variables were summarized by their median values and interquartile range (IQR, 1st quartile to 3rd quartile); categorical variables were summarized by means of frequencies and percentages.
Inter-observer consensus and agreement in measuring ADC values were evaluated by means of Spearman’s correlation coefficient and intraclass correlation coefficient (ICC), and 95% confidence intervals (95% CI) were evaluated by bootstrap, with adjusted percentile. Differences between groups were verified by Mann-Whitney U test statistics.
(5) 如果配变状态无电,则根据配变与分支线的关联关系,取回该分支线下的所有配变以及分支线开关的状态;
In order to classify the population into three classes (T stage, N stage and according to the prognostic groups of TNM stage, respectively), two optimal cut-off sets were identified fitting a conditional inference tree model constrained to three leaves. In the model, we applied recursive partitioning based on conditional permutation tests.
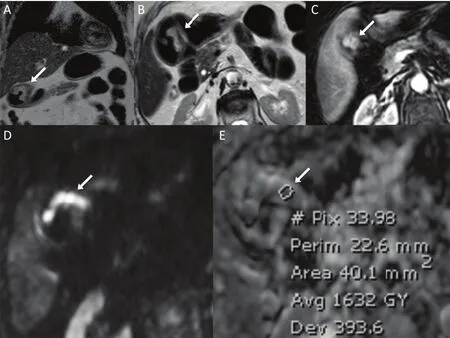
Figure 1Tumor of the gastric antrum in a 69-year-old woman (final histology: adenocarcinoma, intestinal type, T1bN1). (A) Coronal T2 weighted sequence; (B) axial T2 weighted sequence; (C) dynamic contrast-enhanced study; (D) diffusion-weighted imaging; (E) corresponding apparent diffusion coefficient (ADC) map; lesion ADC from the region of interest was 1.63×10⁻³mm2/s.
Furthermore, at each step, P values were adjusted for multiplicity by Benjamini and Yekutieli procedure and we assessed the overall accuracy in order to stratify the population correctly (37). To this aim, sensitivity, specificity, positive and negative predictive values and accuracy were fitted by means of leave-one-out crossvalidation.
Survival curves were fitted by means of Kaplan-Meier estimator and Log-rank test was used to verify differences between curves. We fitted a spline surface to give a graphical overlook of the relationships of ADC as function of both T and N stages (38).
All P values were computed by means of permutation methods, to avoid distributional assumptions or asymptotic approximations. Statistical analyses were performed using R software (Version 3.2.0; Foundation for Statistical Computing, Vienna, Austria).
Results
Study population
Baseline characteristics of the 89 patients included in this study are shown inTable 1. The median age of the totalpopulation was 71 years (IQR: 65.86–77.77 years). The median interval time between DW-MRI and surgery was 9 d (IQR: 4–23 d).
DW-MRI analysis
ADC measurements had a very good inter-observer reproducibility (Spearman’s rho=0.92, 95% CI, 0.88–0.95; ICC=0.92, 95% CI, 0.88–0.94). Given the high inter-reader reproducibility, the measurements were averaged between the two observers and used for the subsequent analyses.Tables 2and3show the median ADC values in the different groups at final histology for T and N stage, respectively.Figure 2shows the median ADC values for each stage in the three prognostic groups (stages I, II and III). Data in parentheses represent the number of patients for each group, as a function of histology.Table 4shows the median ADC values when patients were considered according to the prognostic groups based on TNM staging at histology.
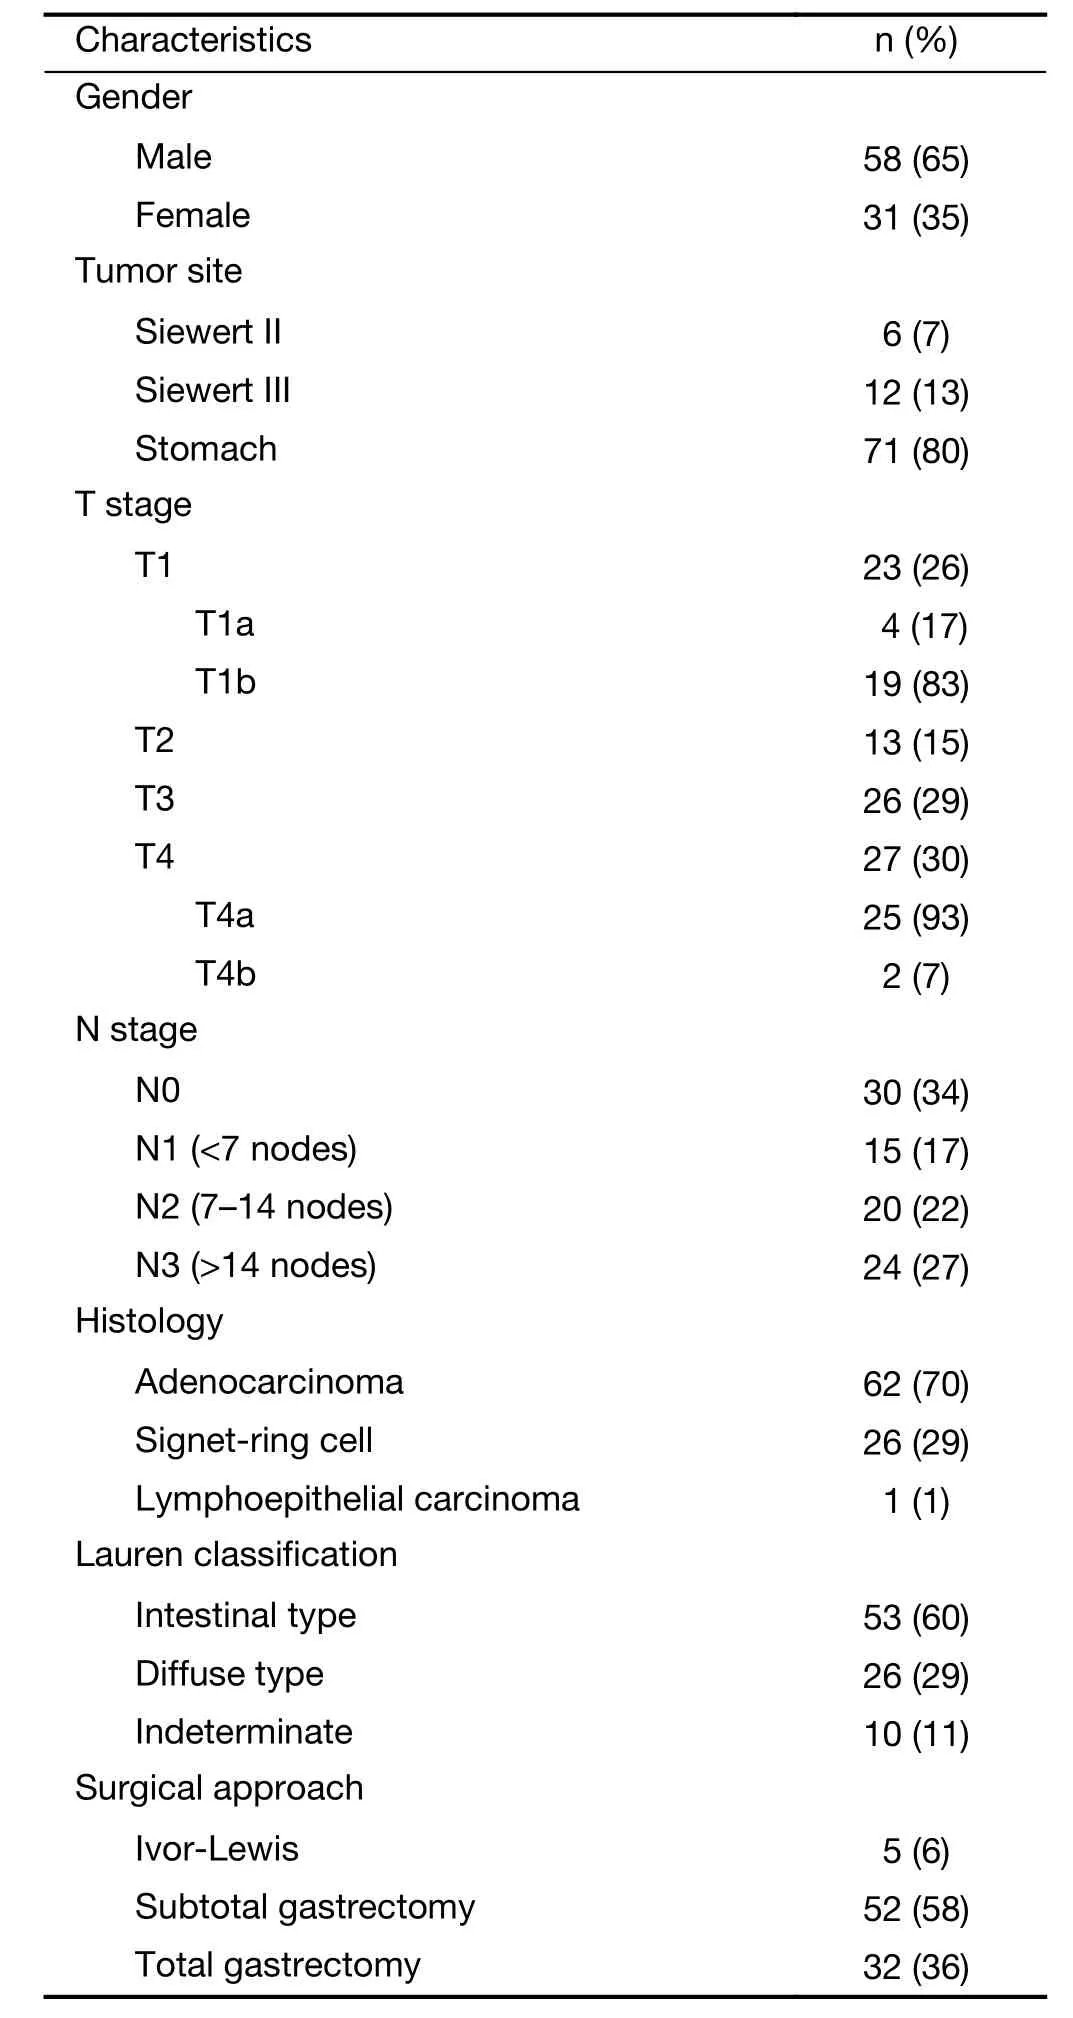
Table 1 Patients’ characteristics (N=89)
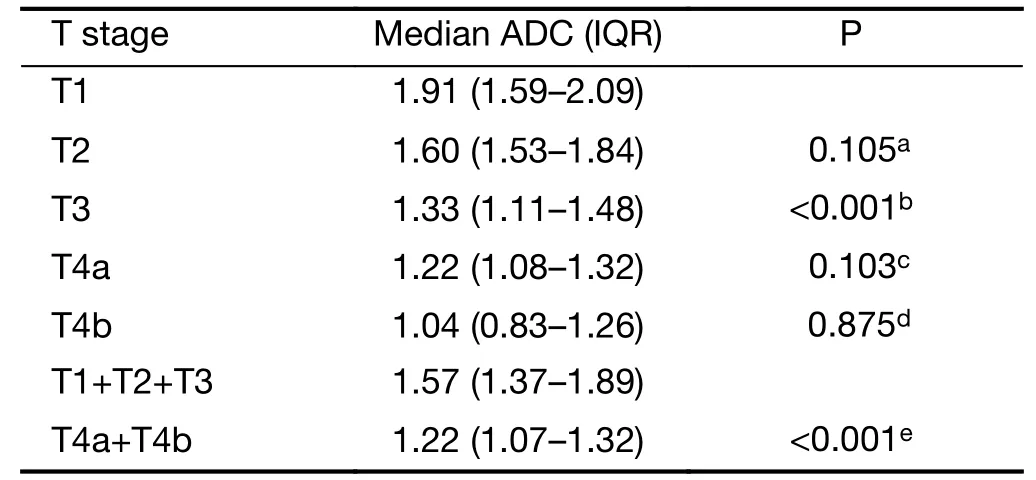
Table 2 ADC values (×10–3mm2/s) in the different subgroups at final histology for T stage

Table 3 ADC values (×10–3mm2/s) in the different subgroups at final histology for N stage
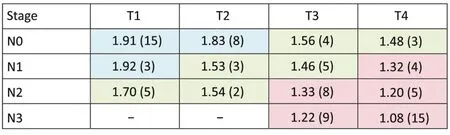
Figure 2Median ADC values (×10–3mm2/s) in the different groups when staged according to the three prognostic groups based on the 7th TNM classification. Data in parentheses represent the number of patients for each group according to histology.
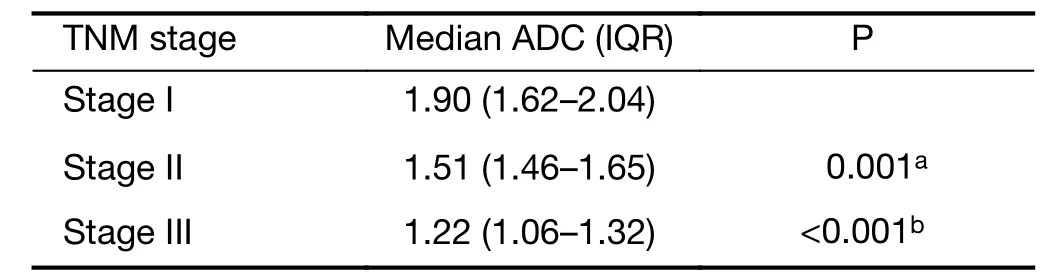
Table 4 ADC values (×10–3mm2/s) for each stage in the three prognostic groups according to the 7th TNM classification
Overall survival
The median follow-up period was 33 (IQR: 14–62.40) months. There were 45/89 (51%) deaths, all related to GC; specifically 4 (9%) events occurred for stage I, 8 (18%) for stage II and 33 (73%) for stage III, based on histology. Survival time at 60 months (5 years) was 84% (IQR: 71%–100%) for stage I, 61% (IQR: 43%–87%) for stage II, and 23% (IQR: 13%–41%) for stage III.
Using final histology as the standard of reference, an ADC value of ≤1.36×10⁻³mm2/s could predict a negative prognosis, enabling to differentiate stage III from stage I–II patients (P<0.001). Of note, the additional cut-off of 1.80×10⁻³mm2/s could significantly divide stage I from stage II patients (P<0.001) (Figure 3).
After cross validation of our model, we obtained the following results for T stage (sensitivity: 62%; specificity: 88%; positive predictive value: 72%; negative predictive value: 82%; accuracy: 79%) and N stage (sensitivity: 78%; specificity: 68%; positive predictive value: 86%; negative predictive value: 55%; accuracy: 75%). The overall accuracy of our model was 79%.
Survival time for patients with an ADC ≤1.36×10⁻³mm2/s (stage III) was significantly lower compared to patients with an ADC superior to this cut-off (stages I–II). Survival time for patients with an ADC >1.80×10⁻³mm2/s (stage I) was significantly higher than that of patients with ADC values ranging from 1.36 to 1.80×10⁻³mm2/s (stage II).
These results were also confirmed by Kaplan-Meier curves analysis, and the survival rates for the three prognostic groups, according to the aforementioned cutoffs and to final histology, are presented inFigure 4(P<0.001).
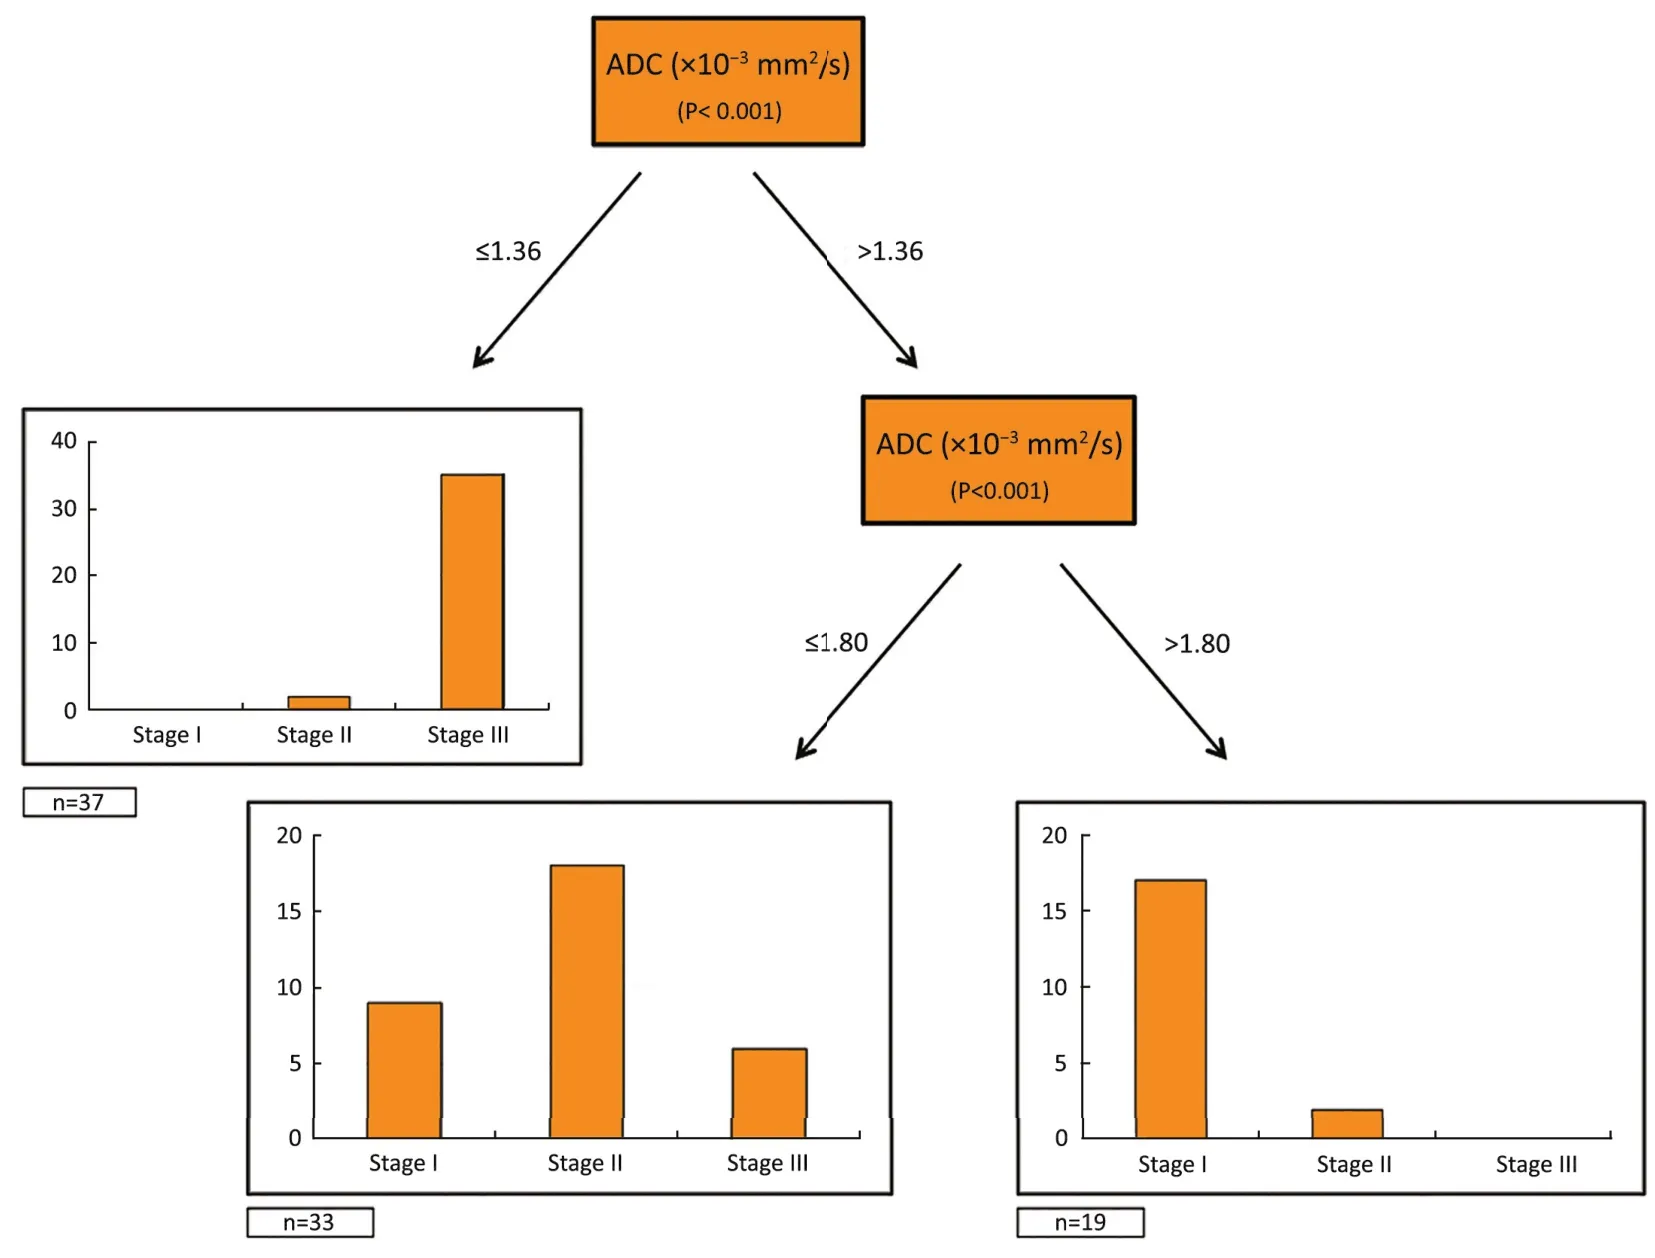
Figure 3Tree plot showing the ADC values used to stratify the population into prognostic groups according to the 7th TNM edition.
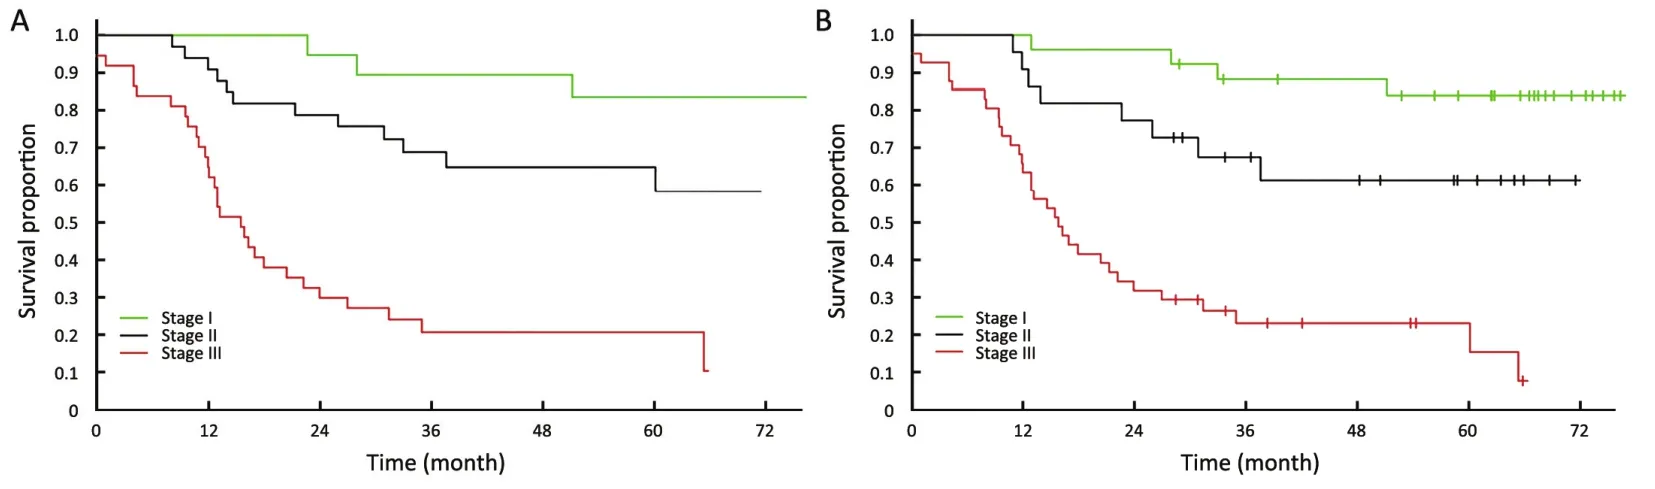
Figure 4Kaplan-Meier curves showing the overall survival rates according to the different ADC cut-offs (×10–3mm2/s) obtained from our study (A) and histology (B).
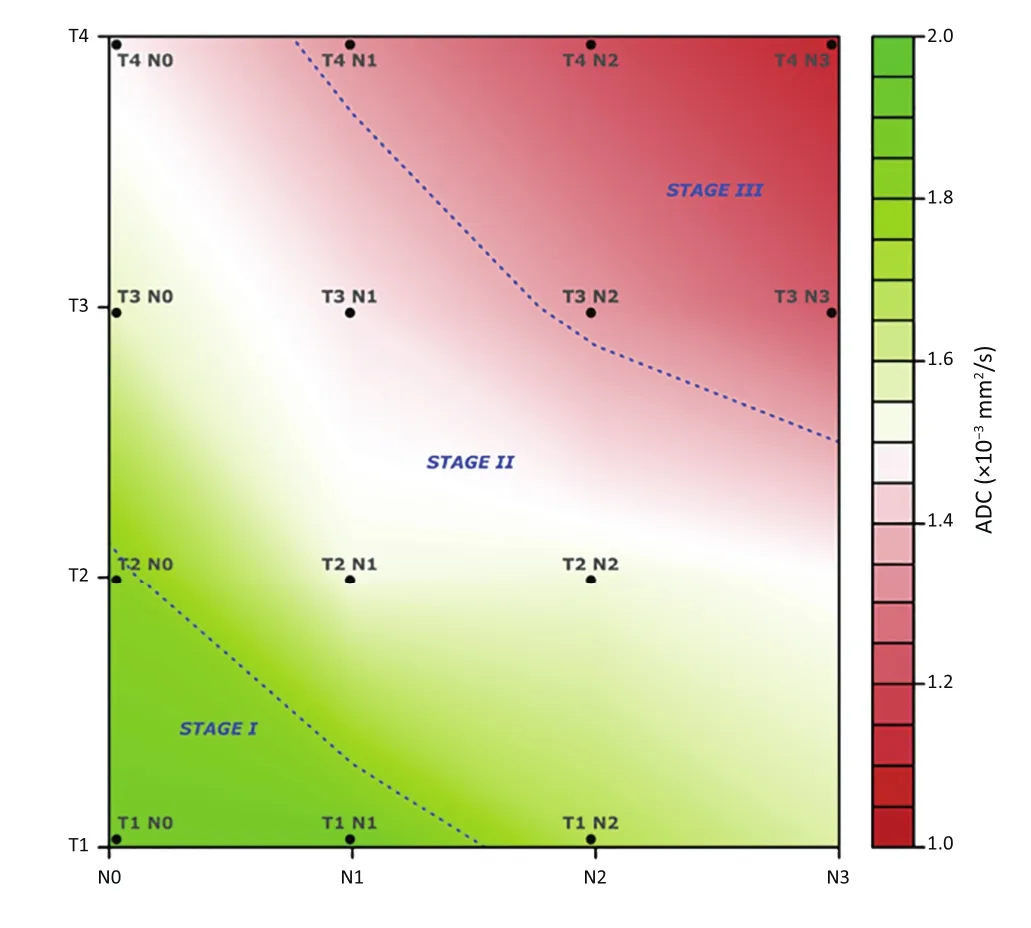
Figure 5Level plot of the spline surface of ADC as function of T and N stage, according to the 7th TNM edition.
Figure 5is a graphical depiction of the aforementioned findings, in accordance with the ADC values emerged from this study.
Discussion
Currently, TNM classification is mainly used on a routine basis for tailoring oncologic treatment of patients affected by cancer. Our findings support the use of a new prognostic biomarker in relation to TNM staging. The inclusion of ADC into the TNM classification as an efficient, prognostic tool has yet to be demonstrated.
Some studies have previously determined the ability of DW-MRI to detect, stage and assess tumor response in oncology (32,33,39,40). Liuet al. showed that ADC of GC correlates inversely with T and N stage (33). Similarly, we found that ADC was significantly different according to the presence or absence of local invasion (T1–3vs.T4a–b) and nodal involvement (N0vs.N+). We also found a significant difference in ADC values between the groups N0–N1 and N2–N3, respectively.
We believe that this study adds to current literature suggesting that ADC could reliably stratify patients into the three TNM groups according to our proposed cut-offs. The median ADC was significantly different in the three classes, showing an inverse trend (i.e. lower ADC values were related to higher TNM stages). This supports the idea that more aggressive tumors have a higher cellularity and, therefore, a more restricted diffusion of water molecules.
From a clinical point of view, this is also supported by the cumulative survival rates shown inFigure 4, as Kaplan-Meier curves demonstrated that the survival rates for the three prognostic groups were significantly different, according to the above-mentioned cut-offs and to final histology. The separation of survival curves at each respective stage was similar at both analyses. This is a major finding of our study when compared with previous literature, and supports the idea that a stratification using our cut-offs could reflect the natural history of untreated, resectable GC in terms of survival.
We previously reported that ADC≤1.5×10⁻³mm2/s is associated with a negative prognosis in GC (15). Our study compares favorably with this result, as T1, T2 and N0 tumors (i.e. patients with an expected better outcome) had median ADC values higher than this cut-off.
We also noticed an opposite trend between ADC values and the prognostic groups based on TNM at histology (Figure 2). As an example, the T1N0 group (stage I) had a median ADC higher than T2N1 (stage II), and this latter had a higher median ADC than that of T3N2 patients (stage III). This confirms that less aggressive tumors (i.e.higher ADC values) are characterized by less restricted water diffusivity, due to the less cellularity, and is also supported by the favorable outcome showed in the prognostic groups at histology.
However, we acknowledge the main limitations of this study. Firstly, our retrospective study has been performed on a relatively small set of patients and in a single center. As such, our results need to be confirmed by other institutions in an independent validation cohort and on different DW-MRI systems. This need is also supported by the fact that ethnicity impacts on survival of patients with GC and therefore an international cohort validation could be desirable.
Our population was solely composed of patients directly treated with surgery, as the aim of this study was to investigate the relationship between ADC and TNM for untreated, resectable GC. As such, patients undergoing neoadjuvant therapy were deliberately excluded from this study, in order to avoid any potential biological change that might affect pathological staging of the resected specimen and ADC calculations.
Indeed, there is growing evidence that ADC values can vary after neoadjuvant therapy in GC, due to the cytotoxic effects of the treatment (e.g. necrosis or fibrosis) (12,13,15).
Consequently, one of our future aims is to conduct a similar study on patients treated with neoadjuvant therapy, analyzing ADC variations before and after treatment. This could also represent an additional tool to help in the assessment of a separate TNM classification performed after neoadjuvant therapy (i.e. a new “yp” staging system that takes into account other variables in addition to clinical and pathological data), as already suggested by other authors (30,34).
Finally, we recognize that EUS and MDCT play a crucial role in the preoperative staging of GC and the lack of comparison between the three techniques is another limitation of this study. However, the purpose of the present report was to investigate the role of ADC from DW-MRI as a sole biomarker in the staging and riskstratification of GC, and we deliberately focused on DWMRI findings.
Having said that, one of our future research plans could be to conduct a prospective comparison between DWMRI, MDCT and EUS in the staging of GC, using ADC as an additional tool to increase the performance of MRI when compared to MDCT and EUS.
Although our results are based on a relatively small sample size, we believe they add to the growing evidence that the application of DW-MRI in GC could aid risk stratification. Given the high imbalance between Asian and Western studies on GC, this is the largest series of patients with this disease assessed by DW-MRI in the Western world so far; of note, the samebvalues of 0 and 600 s/mm2have been used in other centers to evaluate the accuracy of DW-MRI in assessing inflammatory bowel diseases (10). This supports the idea that the protocol of this study reflects the best compromise between signal-to-noise ratio and lesion detection sensitivity for the gastrointestinal tract. Also, this protocol has already been used to investigate the application of DW-MRI in GC, with promising results (12,13,15).
Moreover, histology of the resected specimens (considered as the reference standard) was available for all patients and the two radiologists participating in this study were blinded to any other imaging/clinical finding and patients’ outcome, ensuring an unbiased reading of DWMRI scans. The follow-up period was wide (almost 7 years) and all causes of death were related to the clinical history of GC. ADC calculation is a post-processing analysis that can be performed even retrospectively by other centers on different DW-MRI systems; this could be of great value in order to test the validity of our findings, before widespread application in clinical practice.
Conclusions
This non-invasive, quantitative biomarker appears to be of value in evaluating the aggressiveness of GC and can be reliably assessed by different operators, as demonstrated by the high inter-observer reproducibility found in our study. The addition of DW-MRI could theoretically help in the staging and risk stratification of GC according to the 7th TNM edition and we hope that other centers in different countries (i.e. with a different incidence of this disease and using different DW-MRI systems) will investigate whether our ADC thresholds can be applied even to their clinical scenarios.
Acknowledgements
The authors are indebted to all the patients, families, nurses and radiographers who greatly contributed to the realization of this study.
Footnote
Conflicts of Interest: The authors have no conflicts of interest to declare.
1.Jemal A, Bray F, Center MM, et al. Global cancer statistics. CA Cancer J Clin 2011;61:69-90.
2.OPCS (Office of Population, Census and Surveys). 1994 Cancer statistics: Registrations in England and Wales (Series MB No. 21). London: HMSO, 1978.
3.Freedman ND, Chow WH, Gao YT, et al. Menstrual and reproductive factors and gastric cancer risk in a large prospective study of women. Gut 2007;56:1671-7.
4.Yoshida S, Tanaka S, Kunihiro K, et al. Diagnostic ability of high-frequency ultrasound probe sonography in staging early gastric cancer, especially for submucosal invasion. Abdom Imaging 2005;30:518-23.
5.Mocellin S, Pasquali S. Diagnostic accuracy of endoscopic ultrasonography (EUS) for the preoperative locoregional staging of primary gastric cancer. Cochrane Database Syst Rev 2015;2: CD009944.
6.Kim SJ, Kim HH, Kim YH, et al. Peritoneal metastasis: detection with 16- or 64-detector row CT in patients undergoing surgery for gastric cancer. Radiology 2009;253:407-15.
7.Lee IJ, Lee JM, Kim SH, et al. Diagnostic performance of 64-channel multidetector CT in the evaluation of gastric cancer: differentiation of mucosal cancer (T1a) from submucosal involvement (T1b and T2). Radiology 2010;255:805-14.
8.Giganti F, Orsenigo E, Arcidiacono PG, et al. Preoperative locoregional staging of gastric cancer: is there a place for magnetic resonance imaging? Prospective comparison with EUS and multidetector computed tomography Gastric Cancer 2016;19:216-25.
9.Yun M, Lim JS, Noh SH, et al. Lymph node staging of gastric cancer using (18)F-FDG PET: a comparison study with CT. J Nucl Med 2005;46: 1582-8.
10.Oussalah A, Laurent V, Bruot O, et al. Diffusionweighted magnetic resonance without bowel preparation for detecting colonic inflammation in inflammatory bowel disease. Gut 2010;59:1056-65.
11.Ordás I, Rimola J, García-Bosch O, et al. Diagnostic accuracy of magnetic resonance colonography for the evaluation of disease activity and severity in ulcerative colitis: a prospective study. Gut 2013;62:1566-72.
12.De Cobelli F, Giganti F, Orsenigo E, et al. Apparent diffusion coefficient modifications in assessing gastrooesophageal cancer response to neoadjuvant treatment: comparison with tumour regression grade at histology. Eur Radiol 2013;23:2165-74.
13.Giganti F, De Cobelli F, Canevari C, et al. Response to chemotherapy in gastric adenocarcinoma with diffusion-weighted MRI and (18) F-FDG-PET/CT: correlation of apparent diffusion coefficient and partial volume corrected standardized uptake value with histological tumor regression grade. J Magn Reson Imaging 2014;40:1147-57.
14.Lambrecht M, Van Calster B, Vandecaveye V, et al. Integrating pretreatment diffusion weighted MRI into a multivariable prognostic model for head and neck squamous cell carcinoma. Radiother Oncol 2014;110:429-34.
15.Giganti F, Orsenigo E, Esposito A, et al. Prognostic role of diffusion-weighted MR imaging for resectable gastric cancer. Radiology 2015;276:444-52.
16.Edge SB, Byrd DR, Compton CC, et al. AJCC Cancer Staging Manual. 7th edition. New York: Springer, 2010.
17.Siewert JR, Stein HJ. Classification of adenocarcinoma of the oesophagogastric junction. Br J Surg 1998;85:1457-9.
18.Hasegawa S, Yoshikawa T, Aoyama T, et al. Esophagus or stomach? The seventh TNM classification for Siewert type II/III junctional adenocarcinoma Ann Surg Oncol 2013;20:773-9.
19.Kim DH, Oh CA, Oh SJ, et al. Validation of seventh edition AJCC gastric cancer staging modifications. J Surg Oncol 2012;105:26-30.
20.Jung H, Lee HH, Song KY, et al. Validation of the seventh edition of the American Joint Committee on Cancer TNM staging system for gastric cancer. Cancer 2011;117:2371-8.
21.Chae S, Lee A, Lee JH. The effectiveness of the new (7th) UICC N classification in the prognosis evaluation of gastric cancer patients: a comparative study between the 5th/6th and 7th UICC N classification. Gastric Cancer 2011;14:166-71.
22.Naylor GM, Gotoda T, Dixon M, et al. Why does Japan have a high incidence of gastric cancer? Comparison of gastritis between UK and Japanese patients Gut 2006;55:1545-52.
23.Yamaoka Y, Kato M, Asaka M. Geographic differences in gastric cancer incidence can be explained by differences betweenHelicobacter pyloristrains. Intern Med 2008;47:1077-83.
24.Okajima W, Komatsu S, Ichikawa D, et al. Prognostic impact of the number of retrieved lymph nodes in patients with gastric cancer. J Gastroenterol Hepatol 2016;31:1566-71.
25.Marchet A, Mocellin S, Ambrosi A, et al. Validation of the new AJCC TNM stating system for gastric cancer in a large cohort of patients (n=2,155): focus on the T category. Eur J Surg Oncol 2011;37:779-85.
26.Marrelli D, Morgagni P, de Manzoni G, et al. Prognostic value of the 7th AJCC/UICC TNM classification of noncardia gastric cancer: analysis of a large series from specialized Western centers. Ann Surg 2012;255:486-91.
27.Reim D, Loos M, Vogl F, et al. Prognostic implications of the seventh edition of the international union against cancer classification for patients with gastric cancer: the Western experience of patients treated in a single-center European institution. J Clin Oncol 2013;31:263-71.
28.Hayashi T, Yoshikawa T, Bonam K, et al. The superiority of the seventh edition of the TNM classification depends on the overall survival of the patient cohort: comparative analysis of the sixth and seventh TNM editions in patients with gastric cancer from Japan and the United Kingdom. Cancer 2013;119:1330-7.
29.McGhan LJ, Pockaj BA, Gray RJ, et al. Validation of the updated 7th edition AJCC TNM staging criteria for gastric adenocarcinoma. J Gastrointest Surg 2012;16:53-61. Discussion 61.
30.Sano T, Coit DG, Kim HH, et al. Proposal of a new stage grouping of gastric cancer for TNM classification: International Gastric Cancer Association staging project. Gastric Cancer 2017;20:217-25.
31.Röcken C, Behrens HM. Validating the prognostic and discriminating value of the TNM-classification for gastric cancer — a critical appraisal. Eur J Cancer 2015;51:577-86.
32.Liu S, He J, Guan W, et al. Added value of diffusionweighted MR imaging to T2-weighted and dynamic contrast-enhanced MR imaging in T staging of gastric cancer. Clin Imaging 2014;38:122-8.
33.Liu S, Wang H, Guan W, et al. Preoperative apparent diffusion coefficient value of gastric cancer by diffusion-weighted imaging: Correlations with postoperative TNM staging. J Magn Reson Imaging 2015;42:837-43.
34.Wittekind C. The development of the TNM classification of gastric cancer. Pathol Int 2015; 65:399-403.
35.Japanese Gastric Cancer Association. Japanese classification of gastric carcinoma: 3rd English edition. Gastric Cancer 2011;14:101-12.
36.Kim IY, Kim SW, Shin HC, et al. MRI of gastric carcinoma: results of T and N-staging in an in vitro study. World J Gastroenterol 2009;15:3992-8.
37.Benjamini Y, Yekutieli D. The control of the false discovery rate in multiple testing under dependency. Ann Stat 2001;29:1165-88.
38.Hastie T, Tibshirani R, Friedman J. The Elements of Statistical Learning: Data Mining, Inference, and Prediction. 2nd edition. New York: Springer, 2009.
39.Joo I, Lee JM, Kim JH, et al. Prospective comparison of 3T MRI with diffusion-weighted imaging and MDCT for the preoperative TNM staging of gastric cancer. J Magn Reson Imaging 2015;41:814-21.
40.Venturini M, Pilla L, Agostini G, et al. Transarterial chemoembolization with drug-eluting beads preloaded with irinotecan as a first-line approach in uveal melanoma liver metastases: tumor response and predictive value of diffusion-weighted MR imaging in five patients. J Vasc Interv Radiol 2012;23:937-41.
Cite this article as:Giganti F, Ambrosi A, Chiari D, Orsenigo E, Esposito A, Mazza E, Albarello L, Staudacher C, Del Maschio A, De Cobelli F. Apparent diffusion coefficient by diffusion-weighted magnetic resonance imaging as a sole biomarker for staging and prognosis of gastric cancer. Chin J Cancer Res 2017;29(2):118-126. doi: 10.21147/j.issn.1000-9604.2017.02.04
10.21147/j.issn.1000-9604.2017.02.04
Francesco Giganti, MD. Department of Radiology and Experimental Imaging Center, San Raffaele Scientific Institute, Vita-Salute San Raffaele University, Via Olgettina 60, Milan 20132, Italy. Email: giganti.fra@gmail.com.
Submitted Feb 13, 2017. Accepted for publication Mar 20, 2017.
猜你喜欢
黑龙江大学自然科学学报(2022年1期)2022-03-29
新世纪智能(数学备考)(2021年9期)2021-11-24
数学物理学报(2021年4期)2021-08-30
现代装饰(2021年1期)2021-03-29
当代水产(2021年1期)2021-03-19
计算机教育(2020年5期)2020-07-24
当代陕西(2019年15期)2019-09-02
学生天地(2019年28期)2019-08-25
学苑创造·A版(2018年11期)2018-02-01
读者(2017年5期)2017-02-15
 Chinese Journal of Cancer Research2017年2期
- Chinese Journal of Cancer Research的其它文章
- Satisfactory surgical outcome of T2 gastric cancer after modified D2 lymphadenectomy
- Postoperative chemotherapy with S-1 plus oxaliplatin versus S-1 alone in locally advanced gastric cancer (RESCUE-GC study): a protocol for a phase III randomized controlled trial
- Current status and challenges in sentinel node navigation surgery for early gastric cancer
- Depth of tumor invasion and tumor-occupied portions of stomach are predictive factors of intra-abdominal metastasis
- Helicobacter pylori antibody responses in association with eradication outcome and recurrence: a population-based intervention trial with 7.3-year follow-up in China
- Adjuvant chemotherapy with paclitaxel and cisplatin in lymph node-positive thoracic esophageal squamous cell carcinoma