
Flowstructure and phosphorus adsorption in bed sediment at a 90° channel conflunce
2017-11-02 09:09YangXiao肖洋YangXia夏阳SaiyuYuan袁赛瑜HongwuTang唐洪武
水动力学研究与进展 B辑 2017年5期
Yang Xiao (肖洋), Yang Xia (夏阳), Sai-yu Yuan (袁赛瑜), Hong-wu Tang (唐洪武)
1. State Key Laboratory of Hydrology-Water Resources and Hydraulic Engineering, Hohai University, Nanjing 210098, China
2. College of Water Conservancy and Hydropower Engineering, Hohai University, Nanjing 210098, China,
E-mail: sediment_lab@hhu.edu.cn
Flowstructure and phosphorus adsorption in bed sediment at a 90° channel conflunce
Yang Xiao (肖洋)1,2, Yang Xia (夏阳)2, Sai-yu Yuan (袁赛瑜)2, Hong-wu Tang (唐洪武)1,2
1. State Key Laboratory of Hydrology-Water Resources and Hydraulic Engineering, Hohai University, Nanjing 210098, China
2. College of Water Conservancy and Hydropower Engineering, Hohai University, Nanjing 210098, China,
E-mail: sediment_lab@hhu.edu.cn
The distribution of the phosphorus (P) adsorption in a bed sediment at channel confluences is an important issue for understanding the transport of contaminants in channel networks. In this study, the flow structure and its effect on the P distribution in the bed sediment were investigated in ao90 confluence flume. It is shown that the P adsorption amount in the sediment varies significantly in different hydrodynamic zones. The P adsorption amount is high in the flow separation zone where the horizontal velocity of the flow is very small, and it is low in the maximum velocity zone where the flow velocity reaches a maximum. The low P adsorption amount is observed in the downstream portion of the distorted shear layer, while the P enrichment is found in the upstream portion, as is related to the significant downwelling flow in this zone. Thus, the flow structure, especially, the flow velocity, has a significant effect on the distribution of the P adsorption in the bed sediment at the channel confluences.
Channel confluence, adsorption, phosphorus, distribution, bed sediment
The contaminant transport at confluences is an important issue for managing the water quality in river networks. The time-averaged flow structure at river confluences was a topic of intense research over the past 30 years[1-3]. A conceptual model consisting of six distinct hydrodynamic zones at river confluences was proposed[1].Of thesesix zones, theflow stagnation zone[2]and the shear layer[3]are particularly important for the transport of contaminants. Some studies show that the distribution of the phosphorus (P) adsorption in the bed sediment at the river mouthsisaffected dominantly by the alongshore current[4]. However, the distribution of the P adsorption in the bed sediment at river confluences,where the flow structureisvery complex, remains unclear.
In this study, the flow structure and its effect on the P distribution in the bed sediment were investigated in ao90confluenceflume.Theflumeis schematically shown in Fig.1,consisting of three tanks, PVC pipes (with inner diameter of 0.11 m), two ultrasonicflowmetersand pump-valvesystems,a honey comb,and a tailgate.All channelshave a rectangular cross section.
The sediment is collected from the Huaihe River,China, and it is then air dried in a ventilated environment.Thestonesand other solid impuritiesare removed by screening with a 200mesh sieve.The median diameter of the sediment is 27 μm, as is measured by a laser particle size analyzer (Malvern Mastersizer 2000, Malvern Instruments Ltd, Malvern UK), and the inorganic P content is 0.548 mg/g.
The experimental procedure is as follows: (1) the sediment is placed in a plexiglass plate (1.00 m × 0.40 m× 0.01 m) and flattened, (2) the flow discharges of the main and tributary channelsare 4L/sand 6L/s,respectively, controlled by the pump-value systems, (3)the water level is adjusted to 0.18 m by the tailgate downstream, (4) 11 g of KH2PO4is added to the flowin the tanks. After the flow is circulated for 2 h, the plate isplaced in theconfluencezone,(5)the experiment lastsfor 48h toensurea saturated adsorption. The P concentration in the overlying water ismonitored throughout theexperiment,which is about 1.25 mg/L, (6) the plate is taken out and the P content in the bed sediment is measured, and (7) the three-dimensional velocity field ismeasured by an acousticDoppler velocimeter (ADV,NorTek Vectrino+).

Fig.1 The experimental flume with a 9 0oconfluence and the measurement cross sections (m)
There are six cross sections for the measurements(S1-S6) at the confluence zone with an interval of 0.10 m(Fig.1),and 19 pointsin each crosssection with a horizontalinterval of 0.02 m.The wet sediment is collected by a 0.01 m diameter plastic tubing at each point and air-dried in a ventilated environment. 0.2 g of thesurface sediment isused tomeasure the inorganic P amount according to thestandard Measurement and Testing Programmeof theEuropean Commission. The inorganic P amount is determined by using the molybdenum bluemethod on an ultraviolet-visible spectrophotometer.

Fig.2 (Color online) Contours of streamwise velocities u(m/s)in the spatial distributions
Figure 2shows thecontours of thestreamwise velocity u, which is seen to decrease from the outer side (the main channel side) to the inner side (the tributary side),with thenegativestreamwise velocity observed in the flow separation zone, where there is a horizontal recirculating flow. The width of the flow separation zone increases with the increasing distance downstream the junction corner, and decreases from the water surface to the flume bottom. The streamwise velocity reaches a maximum in the zone next to the separation zone, which is called the maximum velocity zone.Astheflow separation zone develops downstream, the paths for the two incoming flows are narrowed and the maximum velocity zone is squeezed to the outer side. The flow separation zone and the maximum velocity zone altogether occupy about 1/4 of the crosssection.Theshear layer with a large horizontal-velocity gradient isobserved outsidethe maximum velocity zone, and it is distorted counterclockwise due to the large discharge of the tributary[3].Themaximum velocity zoneand theshear layer nearly disappear at S6, which might be due to the fact that the velocities of the two incoming flows become comparable.
Figure 3 shows the vectors of the cross-sectional velocities(,)vwsuperimposed on the contours of the lateral velocitiesv. The flow separation is generated from S2. In the flow separation zone, there are a lateral flow with small lateral velocity and a counterclockwise vertical eddy. Adjacent to this zone, there are a negative lateral flow originating from the tributary and a positive lateral flow originating from themain channel. The values of the positive lateral velocities increasefrom S3toS5,and then decreaseat S6,whereasthoseof thenegativeonesdecrease downstream. There is a large counterclockwise secon-dary flow (termed as the helical cell[3]) that occupies about 5/6 of the cross section, and it intrudes into the lower portion of theflow separation zone asthe velocities in the lower portion of the flow separation zone are small due to the bed resistance. There is a smallclockwiseeddy between the flow separation zone and the large secondary flow.

Fig.3 (Color online) Contours of lateral velocities v(m/s) in the spatial distributions
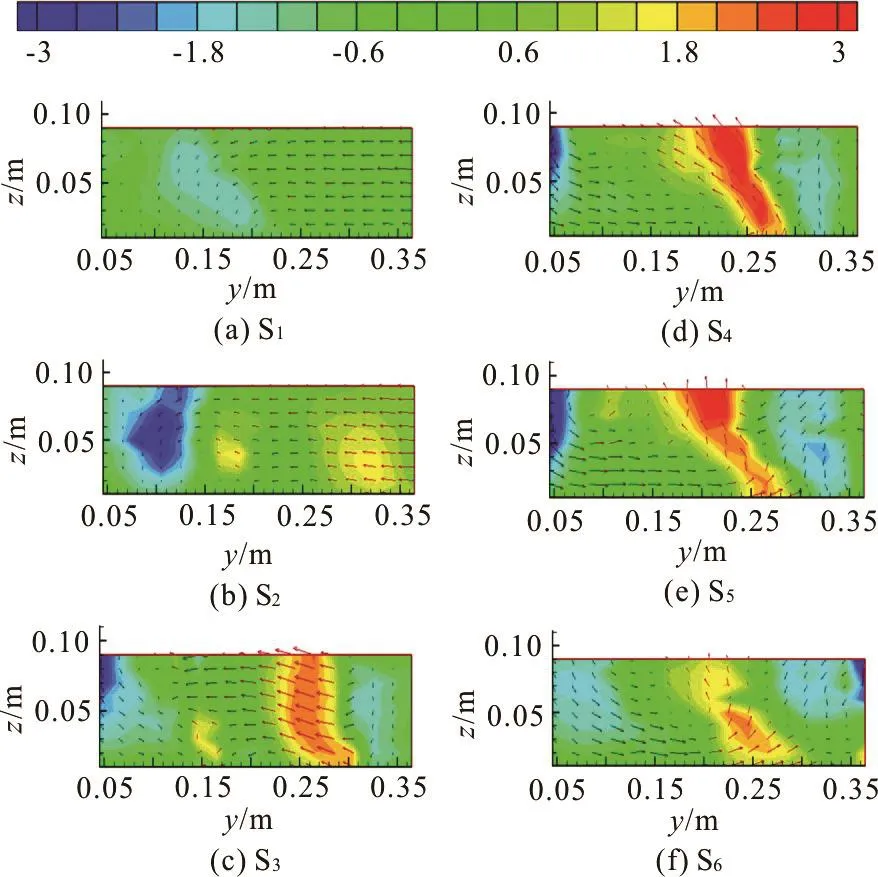
Fig.4 (Color online) Contours of vertical velocities w(m/s) in the spatial distributions
Figure 4 shows the vectors of the cross-sectional velocities(,)vwsuperimposed on the contours of the vertical velocitiesw. There are a downwelling flow within the counterclockwise eddy on the outer side of the flow separation zone, and an upwelling flow in the maximum velocity zone.Thedownwelling flow is located next to the outer wall. The intensity of the upwelling flow increasesfrom S3toS5,and then decreases at S6, while the similar trend is observed for thedownwelling flow.The intensity of thedownwelling flow is particularly prominent on theouter side of S2.

Fig.5 (Color online) The distribution of inorganic P amount(mg/g) in bed sediment at the confluence zone
Figure 5 shows the distribution of P in the bed sediment at the confluencezone.The effect of the velocity for simple flow patterns on the adsorption of P in the sediment was widely studied[5,6], which comes upwith an important relation between the flow velocity and the P adsorption amount. Smith[6]shows that the retention ability of the bed sediment decreases as the water velocity increases in the natural ditches,and a largevelocity apparently contributestothe decrease of the retention ability due to lesscontact between the water and the sediment. In this study, the horizontal velocity is low in the flow separation zone,which is helpful for theP adsorption ontothe sediment[6], thus, the P enrichment is observed in this zone. The horizontal velocity reaches a maximum in the maximum velocity zone, resulting in a distinct low adsorption strip in this zone. A low-adsorption zone is also observed in the distorted shear layer from S3to S6.The horizontal velocities in the shear layer are almost aslargeasthosein the maximum velocity zone.However, there is an enrichment zone in the distorted shear layer at S2, where is a significant downwelling flow.Ellioteand Brooks[7]showsthat thesolute exchange between the flow and the porous stream bed is related to the irregular variation of the pressure at the bed surface. Thus, the downwelling flow might significantly increase the pressure at the bed surface,and, thus,enhance the solute exchange between the overlying water and theporousstream bed,which contributes to the large P adsorption amount onto the bed sediment.
Several important conclusions could be drawn as follows:
(1)The flow structure,especially the flow velocity, has a significant effect on the distribution of theP adsorption in the bed sediment at channel confluences.
(2)TheP enrichment isobserved in theflow separation zone, where the flow velocity is very small.
(3) Low amount of the P adsorption is observed in the maximum velocity zone and the downstream portion of the distorted shear layer,wherethe horizontal velocity is large.
(4)The P enrichment zone isobserved at the upstream portion of the distorted shear layer due to the existence of the downwelling flow.
[1]Best J. L. Sediment transport and bed morphology at river channel confluences[J]. Sedimentology,1988,35(3):481-498.
[2]Best J.L.,Reid I.Separation zoneat open-channel junctions[J]. Journal of Hydraulic Engineering, ASCE,1984, 110(11): 1588-1594.
[3]Yuan S., Tang H., Xiao Y. et al. Turbulent flow structure at a 90-degree open channel confluence: Accounting for the distortion of the shear layer [J].Journal of Hydroenvironment Research, 2016, 12: 130-147.
[4] Chomicki K. M., Howell E. T., Defield E. et al. Factor influencing the phosphorus distribution near the mouth of the Grand River, Ontario, Lake Erie [J]. Journal of Great Lakes Research, 2016, 42(3): 549-564.
[5]Xiao Y., Cheng H. K., Yu W. W. et al. Effects of water flow on the uptake of phosphorus by sediments: An experimental investigation [J]. Journal of Hydrodynamics, 2016,28(2): 329-332.
[6]Smith D. R. Assessment of in-stream phosphorus dynamics in agricultural drainage ditches [J]. Science of the Total Environment, 2009, 407(12): 3883-3889.
[7]Elliott A. H., Brooks N. H. Transfer of nonsorbing solutes to a streambed with bed forms: Laboratory experiments [J].Water Resources Research, 1997, 33(1): 137-151.
August 9, 2016, Revised July 4, 2017)
* Project supported by the National Natural Science Foundation of China (Grant No. 51239003, 51509073, 201501007 and 51279046).
Biography: Yang Xiao (1974- ), Male, Ph. D., Professor
Sai-yu Yuan,E-mail: yuansaiyu@hhu.edu.cn
猜你喜欢
动漫界·幼教365(小班)(2022年8期)2022-07-12
大江南北(2022年6期)2022-06-16
保健与生活(2022年10期)2022-05-06
保健与生活(2021年4期)2021-02-22
保健与生活(2020年8期)2020-04-28
中学生博览(2019年22期)2019-12-09
小说界(2018年6期)2018-11-26
水动力学研究与进展 B辑(2017年4期)2017-09-15
意林(2016年22期)2016-11-30
意林(2016年24期)2016-11-22
- 水动力学研究与进展 B辑的其它文章
- On the clean numerical simulation (CNS) of chaotic dynamic systems *
- BEM for wave interaction with structures and low storage accelerated methods for large scale computation *
- Flow-pipe-soil coupling mechanisms and predictions for submarine pipeline instability *
- Simulation of flows with moving contact lines on a dual-resolution Cartesian grid using a diffuse-interface immersed-boundary method *
- On the hydrodynamics of hydraulic machinery and flow control *
- A 3-D SPH model for simulating water flooding of a damaged floating structure *