Automatic clustering of EEG data from ICU patients
2018-01-23 08:42JinJingEmileangremontaSenanEbrahimMohammadGhassemiEricRosenthalSaharZafarBrandonWestover
西北大学学报(自然科学版) 2018年1期
Jin Jing, Emile D′angremonta, Senan Ebrahim, Mohammad Ghassemi, Eric Rosenthal, Sahar Zafar, M. Brandon Westover
(1.Neurology Department, Massachusetts General Hospital, Harrard Medical School, Boston, MA, 02114, USA;2.Faculty of Science, Utrecht University,Utrecht, PO Box 80125, Netherlands; 3.School of Science, Massachusetts, Institute of Technology, Boston, MA, 02114, USA)
1 Introduction
Seizures, status epilepticus, and seizure-like rhythmic or periodic activity are common, pathological, and harmful states of brain electrical activity seen in the electroencephalogram (EEG) of patients during critical medical illnesses or acute brain injury[1-2]. A growing body of evidence shows that these states, when prolonged, cause neurological injury[3-4]. In this study, we aimed to develop a valid method to automatically discover a small number of homogeneous pattern clusters, to facilitate efficient interactive labelling by EEG experts.
2 Method
In this study, we analysed continuous EEG recordings from 10 different ICU patients at MGH. The duration of each recording is at least 12 hours, with a sampling rate of 200 Hz. Digital filters were applied to remove artifacts such as powerline interference, and baseline drift. In addition, spectrograms was prepared for frequency domain feature extraction[5-6]. In total, as listed in Table 1, we extracted 576 time and frequency domain features from each EEG recording.

Tab.1 Temporal and spectral features extracted from EEG.
After feature extraction, we applied principal component analysis (PCA)[11]with 90% variance retained to reduce the dimensionality for each feature array. It is followed by unsupervised clustering method K-means[12], to further split the data into 9 clusters using K-means. From each cluster we took 9 random samples plus the cluster center, rendering 900 samples in total. Three experts independently labelled all samples into one of 6 standard pattern categories (seizures, GPDs, LPDs, LRDA, GRDA, burst suppression, other).
We compared two methods for labelling clusters: (1) “Labour intensive labelling” (LIL): assign the most frequent of 30 expert provided labels; (2) “Labour efficient labelling “(LEL): assign the most frequent of the 3 expert labels for the central sample. We compared interrater agreement (IRA) indexed by Gwet′s AC1[13]among experts vs. between each expert and consensus labels using LIL vs. LEL. Finally, we used Laplacian Eigenmaps (LE)[14]to visualize the data, as shown in Figure 1.
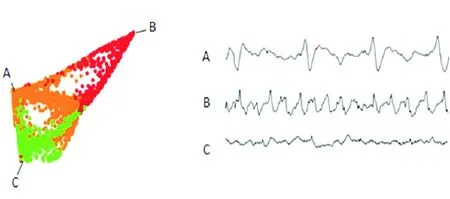
Fig.1 Laplacian Eigenmaps for 2-D visualization of high-D data.
3 Results
Median [IQR] expert-expert IRA for all label pairs across subjects was 0.65 [0.58, 0.75]. IRA for individual expert labels and the final consensus label was 0.76 [0.70, 0.82] using LIL, and 0.71 [0.63, 0.78] using LEL. The boxplots are shown in Figure 2. Differences between LIL and LEL were not statistically significant (p=0.34). As illustrated in Figures 3a-f, LE visualizations of the feature space generally revealed a continuum.
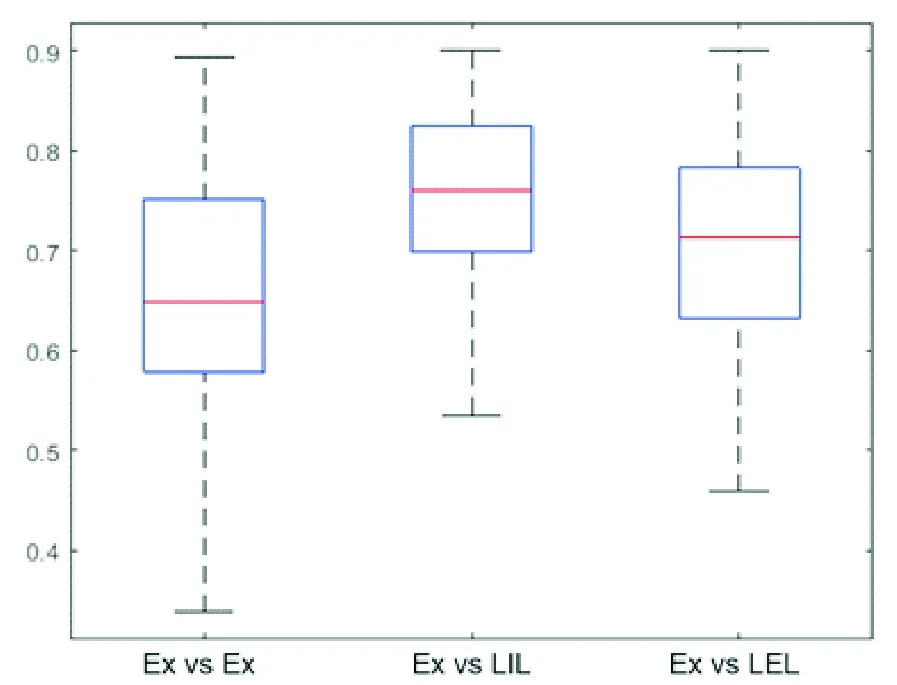
Fig.2 Boxplots of IRA Gwet′s AC1 index for expert-expert [Ex vs Ex], expert-LIL [Ex vs LIL], and expert-LEL [Ex vs LEL].
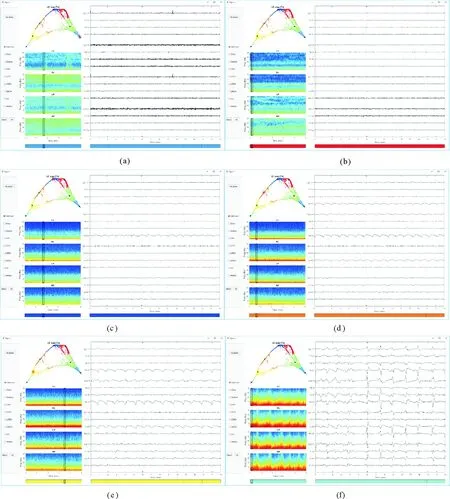
Fig.3 LE visualizations of the feature space generally revealed a continuum of EEG patterns.
4 Conclusion
This research suggests that large EEG datasets can be automatically clustered into a small number of patterns described by standard ICU EEG pattern labels. We demonstrated efficient cluster labelling by inspecting only the central most representative of each cluster. Furthermore, LE visualizations support the hypothesis of an interictal-ictal continuum.
[1] FISHER R S, BOAS W V E, BLUME W,et al. Epileptic seizures and epilepsy: Definitions proposed by the International League against Epilepsy (ILAE) and the International Bureau for Epilepsy (IBE)[J].Epilepsia, 2005,46(4):470-472.
[2] HOLTKAMP M, MEIERKORD H. Non-convulsive status epilepticus: a diagnostic and therapeutic challenge in the intensive care setting[J].Therapeutic advances in Neurological Disorders, 2011,4(3):169-181.
[3] 刘国权. 基于发作间期 EEG 的癫痫自动诊断系统的研究与设计[D].南京:南京邮电大学, 2016.
[4] 孟庆芳, 陈珊珊, 陈月辉,等. 基于递归量化分析与支持向量机的癫痫脑电自动检测方法[J].物理学报, 2014, 63(5): 0505061-0505068.
[5] 张瑞,宋江玲, 胡文凤. 癫痫脑电的特征提取方法综述[J].西北大学学报(自然科学版), 2016, 46(6): 781-788.
[6] 李艳艳, 杨陈军, 野梅娜, 等. 一种新的癫痫脑电融合特征提取方法[J].西北大学学报(自然科学版), 2016, 46(6): 801-808.
[7] ESTELLER R, ECHAUZ J, TCHENG T,et al. Line length: an efficient feature for seizure onset detection. In Engineering in Medicine and Biology Society[J].Proceedings of the 23rd Annual International Conference of the IEEE ,2001,2:1707-1710.
[8] DECARLO L T. On the meaning and use of kurtosis[J].Psychological Methods, 1997,2(3):292.
[9] COIFMAN R R, WICKERHAUSER M V. Entropy-based algorithms for best basis selection[J].IEEE Transactions on Information Theory, 1992,38(2):713-718.
[10] MUKHOPADHYAY S, RAY G C. A new interpretation of nonlinear energy operator and its efficacy in spike detection[J].IEEE Transactions on Biomedical Engineering, 1998,45(2):180-187.
[11] JOLLIFFE I T. Principal Component Analysis and Factor Analysis[M].New York:Springer,1986:115-128.
[12] 陈爽爽,周卫东,袁琦,等. 基于多特征的颅内脑电癫痫检测方法[J].中国生物医学工程学报, 2013, 32(3): 279-283.
[13] GWET K L. Handbook of inter-rater reliability: The definitive guide to measuring the extent of agreement among multiple Raters[D]. Advanced Analytics, Gaithersburg, MD, 2010.
[14] BELKIN M,NIYOGI P. Laplacian eigenmaps and spectral techniques for embedding and clustering[C]∥Ihternational Information Processing Systems:Natural and Synthetic.MIT Press, 2002:585-591.
猜你喜欢
声屏世界(2022年13期)2022-10-08
小小说月刊(2022年14期)2022-07-18
哈尔滨轴承(2020年2期)2020-11-06
铁道通信信号(2020年3期)2020-09-21
铁道通信信号(2020年8期)2020-02-06
校园英语·下旬(2019年11期)2019-11-28
铁道通信信号(2019年8期)2019-10-10
电子制作(2019年10期)2019-06-17
铁道通信信号(2019年2期)2019-03-26
电子制作(2018年19期)2018-11-14