
Morphological beak differences of loliginid squid, Uroteuthis chinensis and Uroteuthis edulis, in the northern South China Sea*
2018-05-07 06:07JINYue金岳LIUBilin刘必林CHENXinjun陈新军KevinSTAPLES
关键词:新军
JIN Yue (金岳) LIU Bilin (刘必林) CHEN Xinjun (陈新军) Kevin STAPLES 4
1 College of Marine Sciences, Shanghai Ocean University, Shanghai 201306, China
2 National Distant-water Fisheries Engineering Research Center, Shanghai Ocean University, Shanghai 201306, China
3 The Key Laboratory of Sustainable Exploitation of Oceanic Fisheries Resources, Ministry of Education, Shanghai Ocean University, Shanghai 201306, China
4 School of Marine Sciences, University of Maine, Orono, Maine 04469, USA
5 Collaborative Innovation Center for National Distant-water Fisheries, Shanghai 201306, China
1 INTRODUCTION
The mitre squid,Uroteuthischinensis, is a largesized (maximum reported size 490 mm mantle length(ML) for male and 310 mm for female, commonly to 200 mm mantle length) (Natsukari and Okutani,1975; Jereb and Roper, 2010) Indo-Pacific species extending from the western Pacific to the Indian Ocean (Voss, 1963; Natsukari and Tashiro, 1991;Chotiyaputta, 1993; Dunning, 1998; Jereb and Roper,2006). It can be either a target species or a welcome bycatch for numerous commercial and small-scale fisheries throughout its range. It is reported to be currently exploited in the East and South China Seas and constitutes, together with the swordtip squid,Uroteuthisedulis, the majority of the Chinese neritic squid catch (Voss and Williamson, 1971).U.chinensiscaptured with a variety of gears that include various bottom trawls, purse seines, dip-, and cast nets, hookand-line, scoop nets, and bamboo stake nets, that sometimes involve light attraction with torches and lamps (Jereb and Roper, 2010).
Uroteuthisedulisis also an Indo-Pacific species that is relatively abundant in the western Pacific Ocean, from its northern waters (East China Sea,Japan Sea) to tropical seas (Indonesia, Java Sea,Malaysia, Thailand), south to northern Australia(Voss, 1973; Chikuni, 1983; Natsukari and Tashiro,1991; Jereb and Roper, 2006). It is a medium- to large-sized squid (maximum mantle length 502 mm for male and 410 mm for female, common size in commercial catches between 150 and 250 mm) (Jereb and Roper, 2010). This species is very abundant in the East China Seas and the northern waters of Taiwan Island. It is vigorously exploited by the Hong Kong fishery and it is believed also to be rather abundant in the South China Sea (Chikuni, 1983). It is caught throughout the year by jig, set net, bottom trawl and other gears (Jereb and Roper, 2010).
UroteuthischinensisandU.edulishave similar appearances and characteristics, which often leads to misidentification. The teeth of the arm sucker rings and the hectocotylized length of arm are presently thought to be the most useful features for distinguishing these two species (Voss and Williamson, 1971). ForU.chinensis, arm sucker rings with up to 12 (more often 6 to 8) long, slender, square-cut (bluntlypointed) teeth on the distal margin; more than 50% of left ventral arm (up to 65% to 80%, Jereb and Roper,2006) is hectocotylized. ForU.edulis, the sucker rings of lateral arms have 10 to 18 sharp teeth distally,smooth or with a few plate-like teeth proximally; left ventral arm hectocotylized part accounts for one-third to one-half (up to 70%) of the arm length (Jereb and Roper, 2010).
There has been an increase in the number of studies using the beaks of cephalopods to determine speciesspecific length-weight relationships, age and growth patterns (Ivanovic and Brunetti, 1997; Perales-Raya et al., 2010; Franco-Santos and Vidal, 2014). The beak, which consists of an upper beak (UB) and a lower beak (LB), is a hard structure composed of proteins and chitin (Miserez et al., 2007; Oh and Hwang, 2013) and is used for feeding. It is situated in the buccal mass, which lies at the base of their arms.The study of beak morphometry is of major importance for the species taxonomy, as well the size estimation of cephalopods in the diets of top predators (Lefkaditou and Bekas, 2004) because of their high resistance to erosion during digestive process in predator stomachs(Clarke, 1962). Since cephalopod predator studies predominantly rely on cephalopod beaks for diet analysis, it is important to have an estimate of the relationship between beak morphometry and squid mantle length or body weight (Jackson, 1995a).Researchers have studied the relationships between beak morphological variables and both mantle length and body weight using different models (Clarke,1962; Jackson, 1995a; Ivanovic and Brunetti, 1997;Jackson et al., 1997; Gröger et al., 2000; Lu and Ickeringill, 2002; Xavier and Cherel, 2009).
This study aims to compare the differences of beak characters between two loliginid squid,U.chinensisandU.edulis. The relationship between beak variables and mantle length of two species are established and different models are compared to identify optimal models, which can provide the basis for estimating the biomass of the two squid species in predator diet.The changes in beak variables among mantle length groups and maturity stages are also studied to find out how the mantle length and maturity stage influence beak morphology.
2 MATERIAL AND METHOD
UroteuthischinensisandU.eduliswere collected randomly in waters of northern South China Sea from March to October 2015.U.chinensiswere sampled from September to October 2015 (at 108°30′–115°30′E, 20°00′–23°00′N);U.eduliswere sampled from March to April and October 2015 (at 113°30′–115°30′E, 21°00′–23°00′N). A total of 247 samples were obtained, 104U.chinensisand 143U.edulisand frozen at -18℃.
Once defrosted, squid were measured (dorsal mantle length, 1 mm accuracy) and weighed (body weight, 1 g accuracy. Sex was identified and sexual maturity stage was determined based on morphological changes in the gonads as defined by Ou (1983). The beaks were extracted from the buccal mass and cleaned with 75% ethanol before measurement.Twelve morphometric variables of beaks were measured with digital Vernier calipers to an accuracy of 0.1 mm. These variables include upper hood length(UHL), upper crest length (UCL), upper rostrum length (URL), upper rostrum width (URW), upper lateral wall length (ULWL), upper wing length(UWL), lower hood length (LHL), lower crest length(LCL), lower rostrum length (LRL), lower rostrum width (LRW), lower lateral wall length (LLWL), and lower wing length (LWL) (Fig.1). A student’s t-test was used to test for differences between beak variables fromU.chinensisandU.edulis.

Fig.1 Schematic diagram of beak morphometric variables measurements (Fang et al., 2014b)
Principal component analysis (PCA) was used to select beak variables that can characterize beak variation based on related coefficients for further analysis. Only the foremost principal components that explain 60% of the total variance, therefore keeping a majority of the original variables’information, were selected as main factors (Tang and Feng, 2006). In order to adjust the effect of sample size on beak variables, these needed to be standardized by mantle length (i.e. UHL/ML, UCL/ML, URL/ML,URW/ML, ULWL/ML, UWL/ML, LHL/ML, LCL/ML, LRL/ML, LRW/ML, LLWL/ML and LWL/ML)(Li, 2010; Fang et al., 2012, 2014a).
The most representative variables for characterizing horizontal and vertical beak features were selected to establish relationships between beak morphological variables and mantle length. different functions were used to quantify the relationships between beak morphological variables and squid body size (function 1–4) (Fang et al., 2015). The relationship between the mantle length (mm) and body weight (g), was expressed using power function (function 5).


wherexis the beak variable,y(ML) is the mantle length, BW is body weight, andaandbare two parameters to be estimated.
Akaike’s information criterion (AIC) was used to choose the best models for each beak variable- mantle length relationship (Akaike, 1974; Haddon, 2001),with the model that had the smallest value of AIC classified as the best model (Burnham and Anderson,2002). AIC was calculated using the following function (Fang et al., 2015):

whereθis the number of estimated parameters,nis the number of observations, and RSS is the residual sum of squares between the observed and estimated data.
Frequency analysis was used for investigating the distribution of different beak variables. Since UHL,UCL and ULWL had similar measurement ranges,class intervals were 2.00 mm between groups.Similarly, class intervals of LCL, LLWL and LWL were 1.00 mm between groups. Class intervals of LHL were 0.50 mm between groups.
ANOVA (Analysis of Variance) and post hoc test(LSD) were used to compare the differences among mantle length groups with 30 mm class interval and among maturity stages with I to Ⅳ in two species.

Table 1 Sampling data of U. chinensis and U. edulis
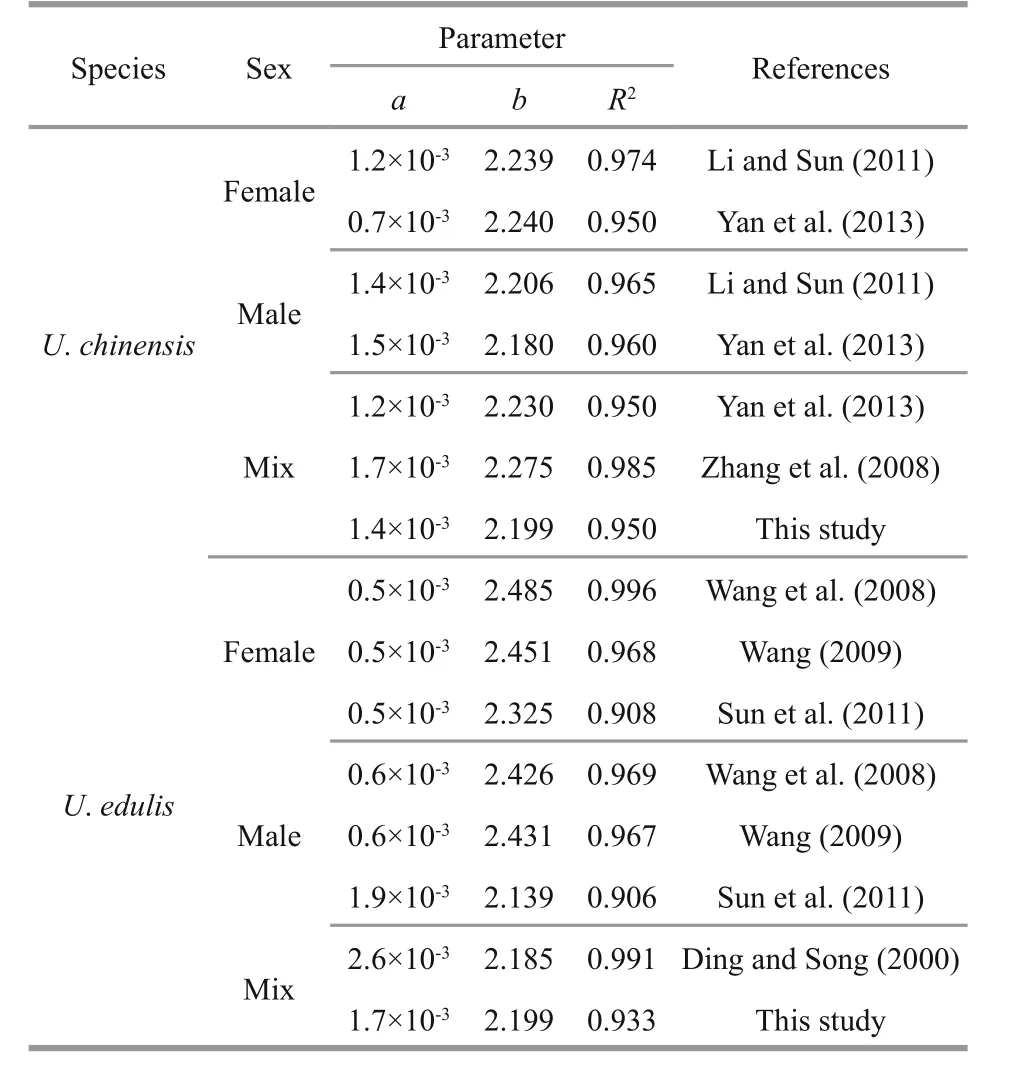
Table 2 Comparison of body weight and mantle length relationship in different studies for U. chinensis and U. edulis
3 RESULT
3.1 Relationship between body weight and mantle length
According to sampling data (Table 1), the mantle length and body weight ofU.chinensisare quite different from that ofU.edulis. The relationships between body weight and mantle length forU.chinensisandU.eduliscould be expressed as follows:

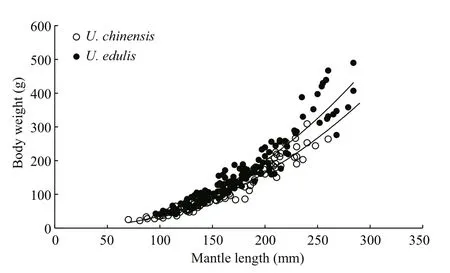
Fig.2 Variation in relationship between body weight and mantle length of U. chinensis and U. edulis
The formulae showed that the curves were fitted to the observed data very well (Fig.2) and that these two species had similar relationship between body weight and mantle length. According to the formulae,U.edulisgrows slightly faster thanU.chinensis, while the latter had a higherR2value. The differences of body weight-mantle length relationship between this study and previous studies are shown in Table 2. In previous studies, the value of parameteraforU.chinensis(U.edulis) ranged from 0.000 7 to 0.001 7(0.000 5 to 0.002 6), the value of parameterbforU.chinensis(U.edulis) ranged from 2.180 to 2.275(2.139 to 2.485). TheR2of all formulae were very high (≥0.908).
3.2 Beak measurement variations between species
As shown in Table 3, the values of UHL, UCL,ULWL, LCL, LLWL and LWL were higher than that of other beak variables. For UHL, UCL, ULWL, LCL,LLWL and LWL,U.edulishad relative higher values of maximum, minimum and mean thanU.chinensis(except for the minimum value in LWL). According to the Student’st-test (Table 3), only the URL, UWL,LRL, LWL showed non-significant differences between two species.
3.3 Principal component analysis of beaks in two species
Considering that the shapes of upper beak and lower beak are different, PCAs were implemented separately for them. In upper beaks (Table 4), the cumulative contribution of factor 1 and factor 2 was 89.03% forU.chinensis, while it was 86.69% forU.edulis. In lower beak (Table 5), the cumulative contribution of factor 1 and factor 2 was 88.74% forU.chinensis, while it was 86.28% forU.edulis.Considering factor 1 had the higher contribution, it was selected to characterize beak features for both beaks and species. According to loading coefficient value of factor 1, UCL/ML, UHL/ML and ULWL/ML had higher values than other variables for the upper beak for both species; LHL/ML, LCL/ML and LLWL/ML had higher values for the lower beak forU.chinensis, while LCL/ML, LLWL/ML and LWL/ML had higher values for the lower beak forU.edulis.These variables were also selected for further study because of their representation of beak features according to PCA.

Table 3 differences of beak morphological variables between U. chinensis and U. edulis
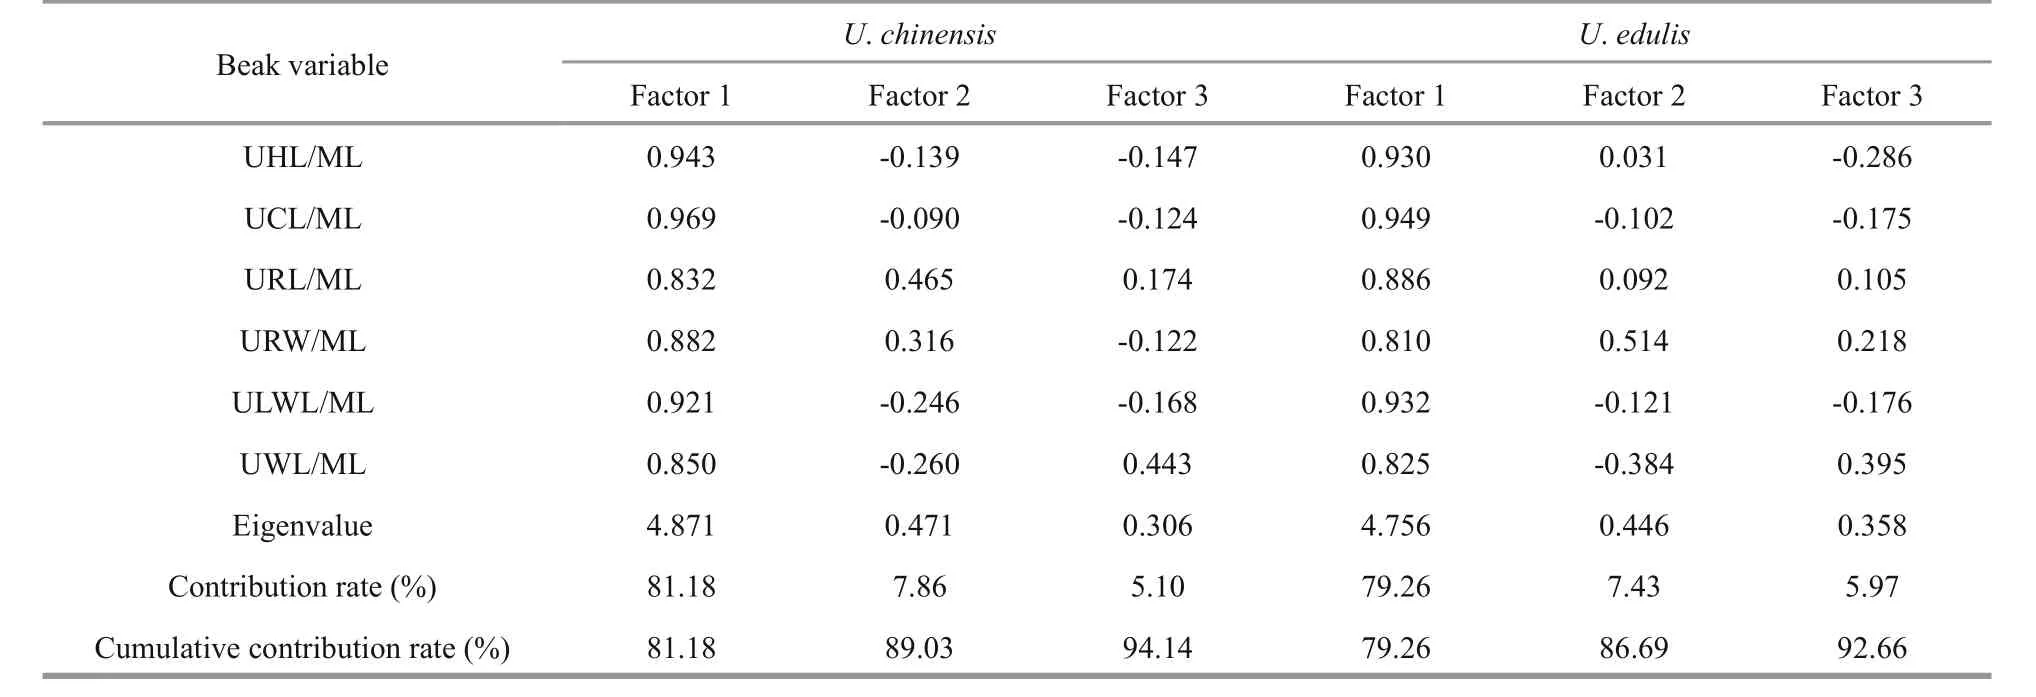
Table 4 Principal component analysis of upper beak variables in U. chinensis and U. edulis

Table 5 Principal component analysis of lower beak variables in U. chinensis and U. edulis
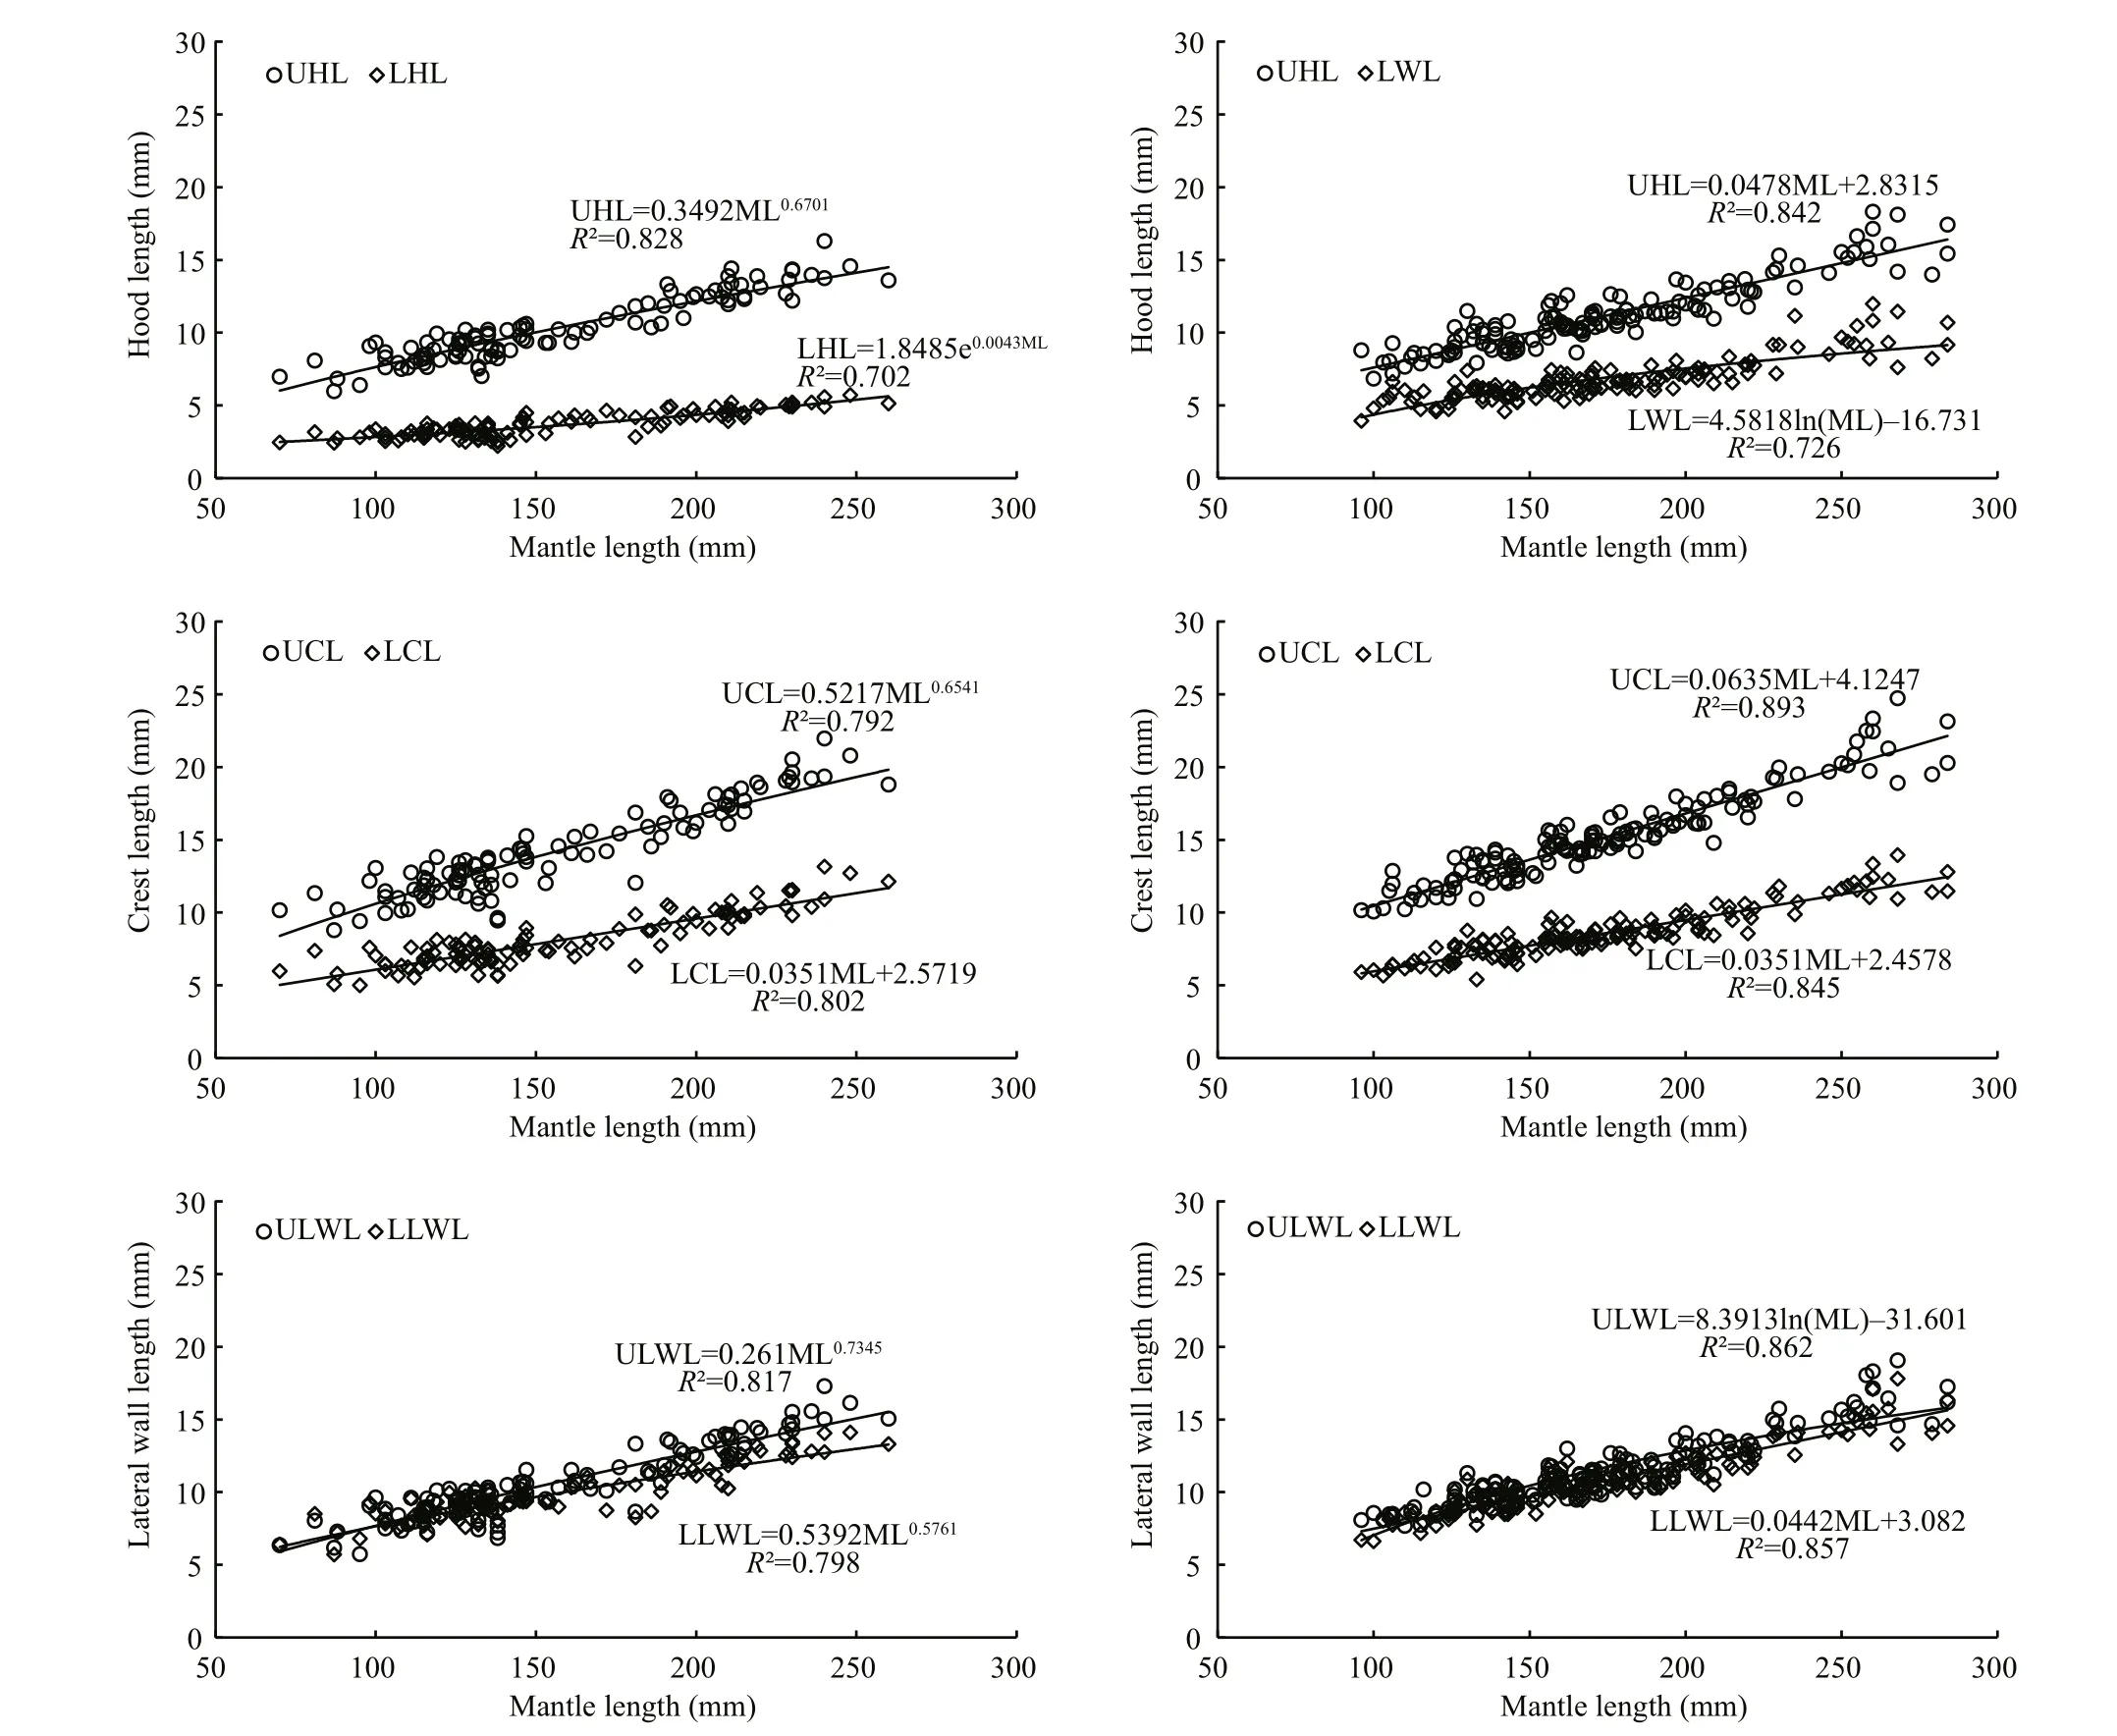
Fig.3 Relationship between beak morphological variable and mantle length for U. chinensis and U. edulis
3.4 Relationships between beak variables and mantle length using different models
Models of beak variables and mantle length relationship were selected based on AIC values andR2. ForU.chinensis(Table 6), the result of AIC values were in disagreement with those ofR2, which means that only one index could be used while choosing best models. The reason for this disparity may have been caused by outliers inU.chinensisbeak measurement.ForU.edulis(Table 7), however, there was no such a problem, and the result of AIC did well to match those ofR2. In this case, AIC value was finally chosen as index selecting best models because it can eliminate the effect of outliers. The AIC values among beak variables varied from 580.4–658.6 forU.chinensisand from 766.7–941.6 forU.edulis.
ForU.chinensis(Table 6 and Fig.3), power function was the best function in UHL, UCL, ULWL,and LLWL, and exponential function was the best in LHL, and linear function was the best in LCL. ForU.edulis(Table 7 and Fig.3), linear function was the best function in UHL, UCL, LCL, and LLWL, and logarithmic function was the best in ULWL and LWL.
3.5 Beak variation among different mantle length groups
Frequency analysis showed that the selected beak variables fit a normal distribution and thatU.edulisfit better thanU.chinensis, UB fit better than LB (Fig.4).Generally, the distributions of each beak variable in two species were severely overlapped, which means that they have similar characters in beaks. The selected upper beak variables had similar value ranges and values of UHL and ULWL had similar distributions, according to frequency analysis. The selected lower beak variables also had similar value ranges, except that LHL, LCL and LLWL had similar distributions, while LWL did not.
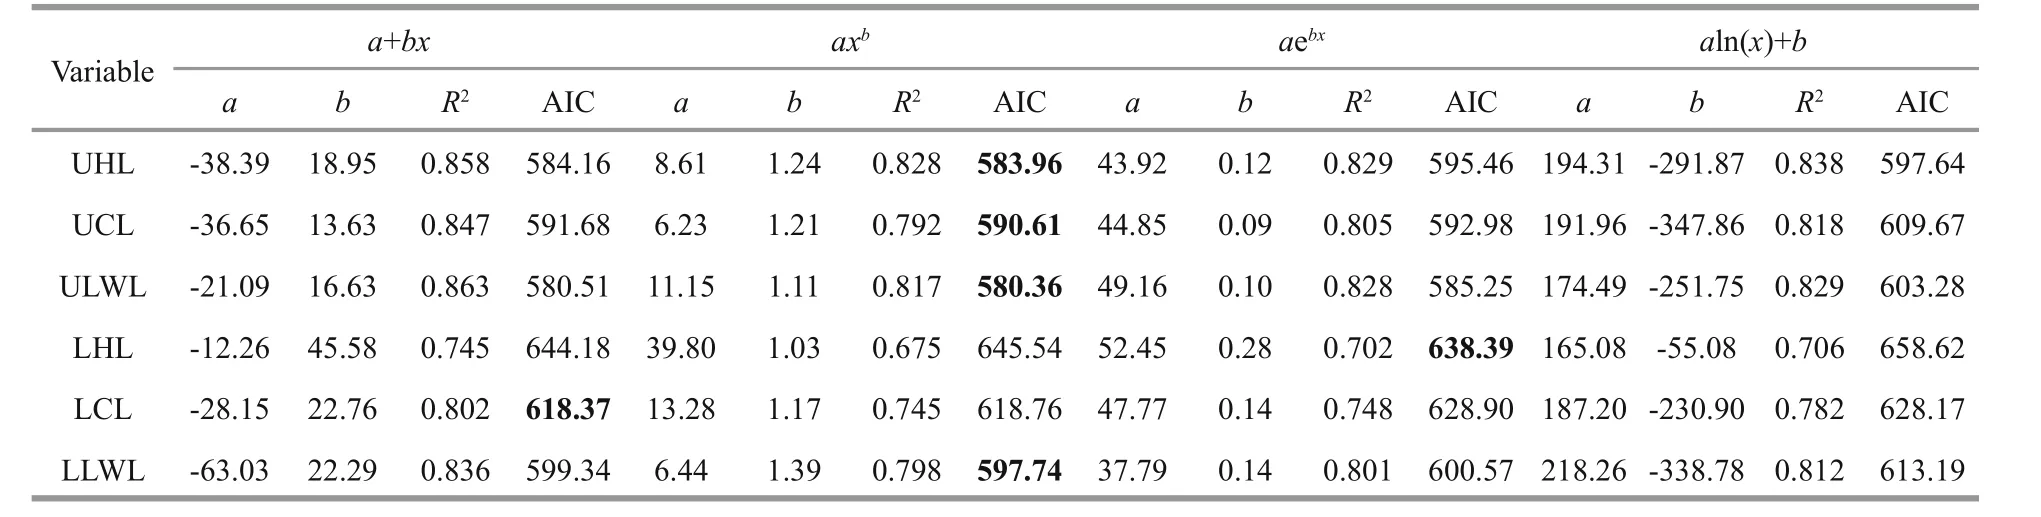
Table 6 Parameters, AIC values and R 2 in mantle length and beak morphological variables relationship models for U. chinensis

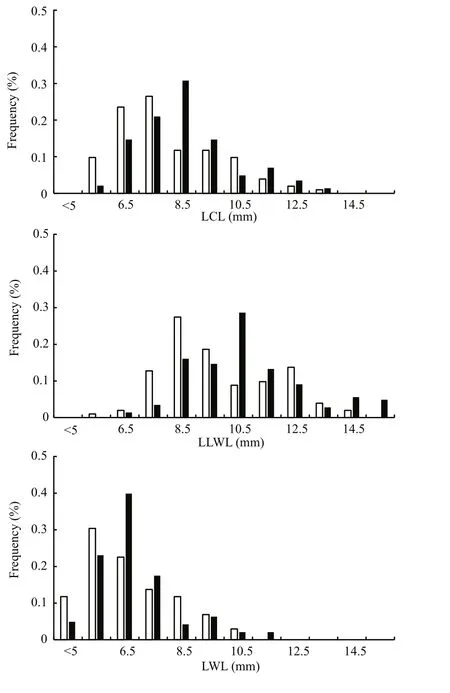
Fig.4 Beak variables length distribution of U. chinensis and U. edulis

Fig.5 Variations of beak variable- mantle length ratio among mantle length groups for U. chinensis and U. edulis

Table 7 Parameters, AIC values and R 2 in mantle length and beak morphological variables relationship models for U. edulis
According to ANOVA and LSD results, all selected beak variables ofU.chinensisfor mantle length groups 80–110 mm and 110–140 mm, except LHL,had significant differences with the other mantle length groups (140–170 mm, 170–200 mm, 200–230 mm and 230–260 mm) (P<0.05). There were no differences among other mantle length groups(P>0.05). InU.edulis, mantle length groups 80–110 mm, 110–140 mm, and 140–170 mm had significant differences with other mantle length groups (170–200 mm, 200–230 mm, 230–260 mm and 260–290 mm) (P<0.05), while there were no differences among other mantle length groups(P>0.05).
According to the beak variable-mantle length ratios(Fig.5), the ratios declined with the increasing of mantle length and declined sharply at the early stage of growth in both beaks and species. The ratio changed quickly after achieving the mantle length of 140 mm forU.chinensis, while the ratio changed quickly after 170 mm forU.edulis.
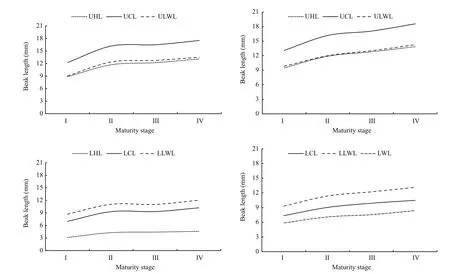
Fig.6 Variations of beak morphological variables in different maturity stages for U. chinensis and U. edulis
3.6 Beak variation among maturity stages
According to ANOVA and LSD results, beak variables ofU.chinensisin maturity stage I had significant differences with that in other maturity stages (II to IV) (P<0.05), while there were no differences among maturity stages II to IV (P>0.05).ForU.edulis, beak variables in maturity stage I also had significant differences with other maturity stages(P<0.05), there was significant difference between maturity stage II and maturity stage IV (P<0.05),there were no significant differences between maturity stage II and maturity stage III and between maturity stage III and maturity stage IV (P>0.05).
Beak measurements differed among maturity stages and had similar pattern in each variable of each species (Fig.6). Beaks (UB and LB) in both species experienced more sharply changes through maturity stage I to II than other maturity stages for both species.ForU.chinensis, beak variable values grew slowly and steadily from maturity stages II to IV. ForU.edulis, beak variable values had a stagnation from maturity stages II to III and then exhibited sharp growth from maturity stages III to IV.
4 DISCUSSION
AlthoughU.chinensishas maximum reported mantle length 490 mm for males and 310 mm for females, 200 mm mantle length is the common size of landed catch (Jereb and Roper, 2010). The common mantle length ofU.chinensis, however, is different in previous studies (Jackson, 1995b; Li and Sun, 2011;Yan et al., 2013). In the tropical nearshore of Townsville, North Queensland, the mantle length range from 40 mm to 180 mm (Jackson, 1995b); in Beibu Gulf of South China Sea, the mantle length ranges from 42 mm to 295 mm in 2006 to 2007 (Li and Sun, 2011) and from 11 mm to 438 mm in 2010 to 2011 (Yan et al., 2013). In this study, the range of mantle length inU.chinensisis from 70 to 260 mm,which is within the range described by Li and Sun(2011) and Yan et al. (2013).
Similarly,U.edulishas maximum reported mantle length 502 mm for males and 410 mm for females,while the common size in commercial catches is 150 mm and 250 mm, respectively (Jereb and Roper,2010). Many studies (Wang et al, 2008, 2010, 2013)have examined the mantle length distribution ofU.edulisin East China Sea. Wang et al. (2008, 2010,2013) described the mantle length which ranges from 23 to 433 mm in a long time series from 2002 to 2010.In this study, the range of mantle length inU.edulisis from 96 to 284 mm, which is also within the range described by previous studies. The differences of mantle range for bothU.chinensisandU.edulisin this study compared with the previous studies, may result from short time series when sampling specimens. This kind of problem should be taken into account especially when exploring population structures in future studies.
According to the parametersaandbdescribed in previous studies (Table 2), body weight-mantle length relationships vary for the two species. These studies can hardly distinguish formulae inU.chinensisfrom those ofU.edulis. This phenomenon also exists within this study. This helps to explain thatU.chinensisandU.edulishave very similar biological characteristics, which easily leads to misidentification(Jereb and Roper, 2010). It also provides an explanation for the overlapping distributions of frequency analysis of each beak variable in the two species (Fig.4).
According to the results of PCA, the variables that represent upper beak growth, including UHL, UCL and ULWL, are consistent for both species.Representative variables, LHL (U.edulis), LCL,LLWL and LWL (U.chinensis), for lower beak growth are more of a mixed bag. This may be related to species-specific feeding habits, as beaks are the feeding organs of squid. As the feeding organ, beak morphology will change as the diets changes during growth (Castro and Hernández-García, 1995). Squid prey mainly on small, soft plankton and crustaceans in early life stage and on big crustaceans, fish and cephalopods in later growth stages (Liu and Chen,2009). The growth of hood, crest and lateral wall of beaks can enlarge the squid mouth, which helps squid adapt to tearing larger prey apart easily (Fang et al.,2014a). According to the loading coefficient of factor 1, the crest and lateral wall play more important roles than the hood in beak growth, which is consistent with previous studies on other squid species (Fang et al., 2014a). It is worth noting that the selected beak variables in PCA are completely consistent with the ones (UHL, UCL, ULWL, LCL, LLWL and LWL)which have higher values than that of the rest of beak variables, except LHL forU.edulis. Although the beak variables are standardized (beak variable/mantle length), it can be inferred that beak growth is related to mantle length (Fig.3).
According to the results of PCA, 7 beak variables,including UHL, UCL, ULWL, LHL (U.edulis), LCL,LLWL and LWL (U.chinensis) were selected to establish the best models. Fang et al. (2015) selected similar beak variables (UHL, UCL, ULWL, LCL,LRL and LLWL) to establish the best models with AIC values for expressing the relationship between beak variables and mantle length (body weight) and Lu et al. (2012) selected UHL, UCL, UWL, LHL,LCL and LWL to establish the best models for expressing the relationship between beak variables and statolith increments. A possible explanation for these selections may be found within measurement variation and accuracy. The variables of higher value usually have a larger range than lower value variables,making them susceptible to significant absolute variation when body size changes. The lower value variables, however, are limited by the accuracy(0.1 mm) of digital vernier calipers (especially for small size beaks), which means the variations in them show subtle body size changes. However, many researchers used URL and LRL only for beak analysis(Jackson and McKinnon, 1996; Jackson et al., 1997;Gröger et al., 2000), which did not compare different models established by different beak variables. Fang et al. (2014a) explained that UHL, UCL, LCL and LWL can be seen as growth symbols of beaks, where UHL and UCL can be seen as horizontal growth symbols of upper beak, LCL can be seen as horizontal growth symbols of lower beak, and LWL can be seen as vertical growth symbols of lower beak.
According to AIC values in this study, a power function is the most suitable model forU.chinensis,except for LHL (exponential function) and LCL(linear function), while a linear function is the most suitable model forU.edulis, except for ULWL and LWL (logarithmic function). Fang et al. (2015) found that a power function and a linear function were the best functions, for establishing mantle length and beak variables model. Also, a linear function was selected in studies of other cephalopods (Ivanovic and Brunetti, 1997; Bolstad, 2006; Liu and Chen,2010). These studies usedR2as the index for model selection while AIC value was added to improve accuracy of model selection and different models and beak variables were also considered in this study. The scatterplots of hood length, crest length and lateral wall length of UB and LB show that the length of UB is longer than that of LB and they have similar height.Fang et al. (2015) found similar phenomena of crest length and lateral wall length ofSthenoeuthis oualaniensis.
Beak variables are correlated with gonad maturity and differences in beak variables occur at different maturity stages (Fang et al., 2015). The results of this study support the case that a similar inference can also be made when referring to different mantle groups. According to the ANOVA and LSD of selected beak variables, the growth of beaks varies in different mantle groups and different maturity stages. Similar conclusions can be drawn according to the changes of beak variable-mantle length ratio among mantle length groups (Fig.5) and changes of beak variable values among maturity stages (Fig.6). ForU.chinensis, the beak variables changed significantly between mantle lengths less than 140 mm and more than 140 mm, and between maturity stage I and those stages that followed. ForU.edulis, the beak variables changed significantly between mantle length less than 170 mm and more than 170 mm, and between maturity stage I and following stages. The differences in the values of beak variables among mantle lengths and maturity stages may be related to changes in diet during the growth of the body size and reproductive system (Fang et al., 2015). Dietary of cephalopods often fluctuate before sexual maturity (maturity stage I and II) that become stable after sexual maturity(maturity stage III–V) (Liu and Chen, 2009). Squid need energy for body size and reproductive organ growth at the beginning of squid growth. Rapid growth of beak can ensure obtaining food that contains enough energy for rapid squid growth. It means the diet of this period tend to be stable with beaks growth.
5 CONCLUSION
Considering the mantle length range is 70 to 260 mm forU.chinensisand 96 to 284 mm forU.edulisin this study, further sampling work should be done to achieve a larger mantle length distribution of specimens. The body weight and mantle length relationship and the beak variable frequency analyses show that the two squid species have similar characteristics. UHL, UCL, ULWL, LCL, LLWL and LWL have higher value than other beak variables.These variables (plus LHL forU.edulis) are also selected to establish the best models according to PCA. According to AIC values, a power function is the most suitable model forU.chinensis, while a linear function is the most suitable model forU.edulis.U.chinensismay shift its food habit and mature earlier thanU.eduliswhich should be confirmed by dietary analysis in future study. Also,geometric morphological methods should be used to characterize morphology features of beaks in the future.
Akaike H. 1974. A new look at the statistical model identification.IEEETransactionsonAutomatControl,19(6): 716-723.
Bolstad K S. 2006. Sexual dimorphism in the beaks ofMoroteuthisingensSmith, 1881 (Cephalopoda:Oegopsida: Onychoteuthidae).NewZealandJournalof Zoology,33(4): 317-327.
Burnham K P, Anderson D R. 2002. Model Selection and Multimodel Inference: A Practical Information-Theoretic Approach. 2ndedn. Springer, New York. 490p.
Castro J J, Hernández-García V. 1995. Ontogenetic changes in mouth structures, foraging behaviour and habitat use ofScomberjaponicusandIllexcoindetii.ScientiaMarina,59(3-4): 347-355.
Chikuni S. 1983. Cephalopod resources in the Indo-Pacific region.In: Caddy J F ed. Advances in Assessment of World Cephalopod Resources. FAO Fisheries Technical Paper 231. FAO, Rome. p.264-305.
Chotiyaputta C. 1993. Cephalopod resources of Thailand.In:Okutani T, O’Dor R K, Kubodera T eds. Recent Advances in Fisheries Biology. Tokai University Press, Tokyo. p.71-80.
Clarke M R. 1962. The identification of cephalopod "beaks"and the relationship between beak size and total body weight.BulletinoftheBritishMuseum(NaturalHistory).Zoological,8(10): 419-480.
Ding T M, Song H T. 2000. Biological characteristics ofLoligo edulishoyle in the East China Sea.JournalofZhejiang OceanUniversity(NaturalScience),19(4): 371-374. (in Chinese)
Dunning M C. 1998. Loliginidae.In: Carpenter K E, Niem V H eds. The Living Marine Resources of the Western Central Pacific. Volume 2. Cephalopods, Crustaceans,Holothurians and Sharks. FAO Species Identification Guide for Fishery Purposes. FAO, Rome. p.764-780.
Fang Z, Chen X J, Lu H J et al. 2012. Morphological differences in statolith and beak between two spawning stocks forIllexargentinus.ActaEcologicaSinica,32(19): 5 986-5 997. (in Chinese with English abstract)
Fang Z, Chen X J, Lu H J et al. 2014a. Morphology and growth of beaks in two cohorts for neon flying squid(Ommastrephesbartramii) in the North Pacific Ocean.ActaEcologicaSinica,34(19): 5 405-5 415. (in Chinese with English abstract)
Fang Z, Liu B L, Li J H et al. 2014b. Stock identification of neon flying squid (Ommastrephesbartramii) in the North Pacific Ocean on the basis of beak and statolith morphology.ScientiaMarina,78(2): 239-248.
Fang Z, Xu L L, Chen X J et al. 2015. Beak growth pattern of purpleback flying squidSthenoteuthisoualaniensisin the eastern tropical Pacific equatorial waters.Fish.Sci.,81(3): 443-452.
Franco-Santos R M, Vidal E A G. 2014. Beak development of early squid paralarvae (Cephalopoda: Teuthoidea) may reflect an adaptation to a specialized feeding mode.Hydrobiologia,725(1): 85-103.
Gröger J, Piatkowski U, Heinemann H. 2000. Beak length analysis of the Southern Ocean squidPsychroteuthis glacialis(Cephalopoda: Psychroteuthidae) and its use for size and biomass estimation.PolarBiol.,23(1): 70-74.
Haddon M. 2001. Modelling and quantitative methods in fisheries. Chapman and Hall/CRC, Boca Raton. 406p.
Ivanovic M L, Brunetti N E. 1997. Description ofIllex argentinusbeaks and rostral length relationships with size and weight of squids.Rev.Invest.Des.Pesq.,11: 135-144.
Jackson G D, Buxton N G, George M J A. 1997. Beak length analysis ofMoroteuthisingens(Cephalopoda:Onychoteuthidae) from the Falkland Islands region of the Patagonian shelf.J.Mar.Biol.Assoc.UK,77(4): 1 235-1 238.
Jackson G D, McKinnon J F. 1996. Beak length analysis of arrow squidNototodarussloanii(Cephalopoda:Ommastrephidae) in southern New Zealand waters.Polar Biol.,16(3): 227-230.
Jackson G D. 1995a. The use of beaks as tools for biomass estimation in the deepwater squidMoroteuthisingens(Cephalopoda: Onychoteuthidae) in New Zealand waters.PolarBiol.,15(1): 9-14.
Jackson G D. 1995b. Seasonal influences on statolith growth in the tropical nearshore loliginid squidLoligochinensis(Cephalopoda: Loliginidae) off Townsville, North Queensland, Australia.FisheryBulletin,93(4): 749-752.
Jereb P, Roper C F E. 2006. Cephalopods of the Indian Ocean.A review. Part I. Inshore squids (Loliginidae) collected during the international Indian Ocean Expedition.ProceedingsoftheBiologicalSocietyofWashington,119(1): 91-136.
Jereb P, Roper C F E. 2010. Cephalopods of the world. An annotated and illustrated catalogue of cephalopod species known to date. Volume 2. Myopsid and Oegopsid squids.FAOSpeciesCatalogueforFisheryPurposes,2(4): 38-117.
Lefkaditou E, Bekas P. 2004. Analysis of beak morphometry of the horned octopusEledonecirrhosa(Cephalopoda:Octopoda) in the Thracian Sea (NE Mediterranean).MediterraneanMarineScience,5(1): 143-149.
Li S L. 2010. Fisheries Biology ofOmmastrephesbartramiiin the North Pacific Ocean. Shanghai Ocean University,Shanghai, China. (in Chinese)
Li Y, Sun D R. 2011. Biological characteristics and stock changes ofLoligochinensisGray in Beibu Gulf, South China Sea.HubeiAgriculturalSciences,50(13): 2 716-2 719, 2 735. (in Chinese with English abstract)
Liu B L, Chen X J. 2009. Review on the research development of beaks in Cephalopoda.JournalofFisheriesofChina,33(1): 157-164. (in Chinese with English abstract)
Liu B L, Chen X J. 2010. Beak length analysis of the purpleback flying squidSthenoeuthisoualaniensisin northwest Indian Ocean.Prog.Fish.Sci.,31(1): 8-14. (in Chinese with English abstract)
Lu C C, Ickeringill R. 2002. Cephalopod beak identification and biomass estimation techniques: tools for dietary studies of southern Australian finfishes.Mus.Vic.Sci.Rep.,6: 1-65.
Lu H J, Chen X J, Fang Z. 2012. Comparison of the beak morphologic growth characteristics between two spawning populations ofIllexargentinusin southwest Atlantic Ocean.PeriodicalofOceanUniversityofChina,42(10): 33-40. (in Chinese with English abstract)
Miserez A, Li Y L, Waite J H, Zok F. 2007. Jumbo squid beaks:inspiration for design of robust organic composites.Acta Biomaterialia,3(1): 139-149.
Natsukari Y, Okutani T. 1975. Taxonomic and morphological studies on the loliginid squids I: identity ofLoligo chinensisGray, 1849, Redescription of the type specimen and taxonomic review (Cephalopoda: Loliginidae).Venus:TheJapaneseJournalofMalacology,34(3): 85-91.
Natsukari Y, Tashiro M. 1991. Neritic squid resources and cuttlefish resources in Japan.MarineBehaviourand Physiology,18(3): 149-226.
Nesis K N. 1987. Cephalopods of the World. TFH Publications,Neptune City, New Jersey. 351p.
Oh D X, Hwang D S. 2013. A biomimetic chitosan composite with improved mechanical properties in wet conditions.Biotechnol.Prog.,29(2): 505-512.
Ou R M. 1983. Preliminary study on the stages of gonad maturity of the squid,LoligochinensisGray.Marine Sciences, (1): 44-46. (in Chinese with English abstract)
Perales-Raya C, Bartolomé A, García-Santamaría M T et al.2010. Age estimation obtained from analysis of octopus(OctopusvulgarisCuvier, 1797) beaks: improvements and comparisons.Fish.Res.,106(2): 171-176.
Sun D R, Li Y, Wang X H et al. 2011. Biological characteristics and stock changes ofLoligoedulisin Beibu Gulf, South China Sea.SouthChinaFisheriesScience,7(2): 8-13. (in Chinese with English abstract)
Tang Q Y, Feng M G. 2006. DPS Data Processing System-Experimental Design, Statistical Analysis and Data Mining. Science Press, Beijing, China. p.635-642. (in Chinese)
Vecchione M, Shea E, Bussarawit S, et al. 2005. Systematics of Indo-West Pacific loliginids.PhuketMar.Biol.Cent.Res.Bull.,66: 23-26.
Voss G L, Williamson G R. 1971. Cephalopods of Hong Kong.Hong Kong Government Press, Hong Kong, China. 138p.
Voss G L. 1963. Cephalopods of the Philippines Islands.BulletinoftheUnitedStatesNationalMuseum,234:1-180.
Voss G L. 1973. Cephalopod Resources of the World. FAO Fisheries Circular 149. FAO, Rome. 75p.
Wang K Y, Chang K Y, Liao C H, et al. 2013. Growth strategies of the swordtip squid,Uroteuthisedulis, in response to environmental changes in the southern East China Sea-a cohort analysis.BulletinofMarineScience,89(3): 677-698.
Wang K Y, Lee K T, Liao C H. 2010. Age, growth and maturation of swordtip squid (Photololigoedulis) in the southern East China Sea.JournalofMarineScienceand Technology,18(1): 99-105.
Wang K Y, Liao C H, Lee K T. 2008. Population and maturation dynamics of the swordtip squid (Photololigoedulis) in the southern East China Sea.Fish.Res.,90(1-3): 178-186.
Wang K Y. 2009. Life history ofUroteuthis(Photololigo)edulis(Hoyle, 1885) in the Shelf Waters off Northeastern Taiwan. National Taiwan Ocean University. (in Chinese with English abstract)
Xavier J C, Cherel Y. 2009. Cephalopod Beak Guide for the Southern Ocean. British Antarctic Survey Press,Cambridge. 129p.
Yan Y R, Li Y Y, Yang S Y, et al. 2013. Biological characteristics and spatial-temporal distribution of mitre squid,Uroteuthischinensis, in the Beibu Gulf, South China Sea.JournalofShellfishResearch,32(3): 835-844.
Yeatman J, Benzie J A H. 1993. Cryptic speciation inLoligofrom northern Australia.In: Okutani T, O’Dor R K,Kubodera T eds. Recent Advances in Cephalopod Fishery Biology. Tokai University Press, Tokyo. p.641-652.
Zhang Z L, Ye S Z, Hong M J et al. 2008. Biological characteristics of the Chinese squid (Loligochinensis) in Minnan-Taiwan Shallow fishing ground.Journalof FujianFisheries, (1): 1-5. (in Chinese with English abstract)
猜你喜欢
农业工程学报(2022年11期)2022-08-22
语数外学习·初中版(2020年5期)2020-09-10
兵团工运(2019年6期)2019-12-13
南风(2019年14期)2019-08-26
汽车观察(2018年12期)2018-12-26
知识经济·中国直销(2017年11期)2017-11-28
知识经济·中国直销(2017年6期)2017-06-13
山海经(2017年7期)2017-05-20
 Journal of Oceanology and Limnology2018年2期
- Journal of Oceanology and Limnology的其它文章
- An aftereffect of global warming on tropical Pacific decadal variability*
- Analysis of monthly variability of thermocline in the South China Sea*
- A numerical study of the South China Sea Warm Current during winter monsoon relaxation*
- Predicting the sinkage of a moving tracked mining vehicle using a new rheological formulation for soft deep-sea sediment*
- Chemical characterization of fractions of dissolved humic substances from a marginal sea—a case from the Southern Yellow Sea*
- The morphological and molecular detection for the presence of toxic Cylindrospermopsis (Nostocales, Cyanobacteria) in Beijing city, China*