
Design of Greenhouse Environment Control System Based on Internet of Things
2018-06-14 08:37ShenWeizhengWangShiyuNagiEltiebBabkerEltiebHouHandanandZhengCheng
Shen Wei-zheng , Wang Shi-yu , Nagi Eltieb Babker Eltieb , Hou Han-dan, and Zheng Cheng
1 College of Electrical and Information, Northeast Agricultural University, Harbin 150030, China
2 Key Laboratory of Pig Breeding Facilities Engineering, Ministry of Agriculture, Harbin 150030, China
3 Computer Department, Harbin Finance University, Harbin 150030, China
4 Heilongjiang Vocational College of Agricultural Engineering, Harbin 150008, China
Introduction
Greenhouse planting is the main way of facility agriculture. It is the most critical that the information perception and intelligent monitoring of the greenhouse environment in order to realize production automation, high efficiency and intellectualization(Peng, 2000). Most of the traditional greenhouse environment monitoring systems are based on wired communication layout. For example, a greenhouse intelligent measurement and control system has been designed based on segmented control strategy(Wanget al., 2009). There are many problems, such as wiring complexity, maintenance difficulties and sensor position fixation in cable communication systems (Wanget al., 2006). The emergence of WSN promotes the development of information acquisition technology and processing technology (Zhang, 2013).WSN has the characteristics of large scale, small volume, low cost and self organizing network (Yanget al., 2010). It can provide an efficient low-cost solution for greenhouse environmental parameters detection by achieving real-time environmental information collection and transmission, and adjust the greenhouse environment in a timely manner to ensure the best growth status (Zhanget al., 2013). In recent years, many researchers have applied the wireless communication technology and automatic control algorithm to the greenhouse area. A greenhouse monitoring system, warning by short message, has been set up based on global system for mobile (GSM)communication technology (Bi and Chen, 2009). A distributed greenhouse monitoring system has been designed by using bluetooth communication technology (Li and Liu, 2006). And a greenhouse temperature system has been designed based on the fuzzy PID control (Lei and Li, 2014). But these wireless communication technologies still have shortcomings, such as high cost, large power consumption and inaccurate control. So they can not be widely applied in the field of greenhouse monitoring. In this paper, a intelligent control system of greenhouse was designed with various technologies, such as ZigBee technology,GPRS technology, embedded technology and internet technology. And the system had been designed with low power consumption, low cost, flexible network structure, excellent control effect, friendly man-machine interface and convenient remote intelligent control.
System Composition
The intelligent management and control system of the greenhouse environment contained three parts:information perception layer, information transmission layer and application layer, as shown in Fig. 1.

Fig. 1 Overall system design
The wireless sensor nodes were developed on the basis of MSP430 chip. The application layer was developed to achieve the collection, transmission,display, control and storage of greenhouse environmental parameters. The wireless sensor network was constructed based on ZigBee protocol. The wireless sensor network was based on tree topology (Ge, 2007).The terminal regulator was connected to the system through the controller area network (CAN) bus to form a control network which made it easy to use, add and delete (Duet al., 2004).
System Design and Implementation
Information perception layer
The sensor node consisted of four modules, sensor module, processor module, wireless communication module and power supply module. The processor module was made up of the 2nd generation of ZigBee chip CC2530. And it supported IEEE 802.15.4 standard which could form wireless communication module through ZigBee. The energy supply module was composed of dry batteries which could be effectively used for more than 30 days (Zhanget al.,2013).
Information transmission layer
CC2530, which integrated RF transceiver and the 8051 microprocessor, had super strong anti-interference(Chenet al., 2014). According to the practical experience of clustered greenhouse, the distance between the two nodes could up to 150 m to meet the actual requirements by using CC2530 chip to build wireless network (Li and Hu, 2011). Network node deployment is shown in Fig. 2.
Management and control module
The application layer collected data of the greenhouse environment and gave the control decision automatically, according to the numerical treatment and analysis. It mainly included the display and preservation of the parameters collected and set the threshold of the parameters. Its functions are shown in Fig. 3.
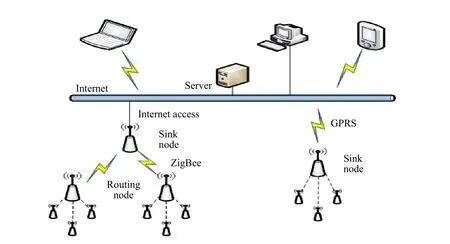
Fig. 2 Network structure diagram
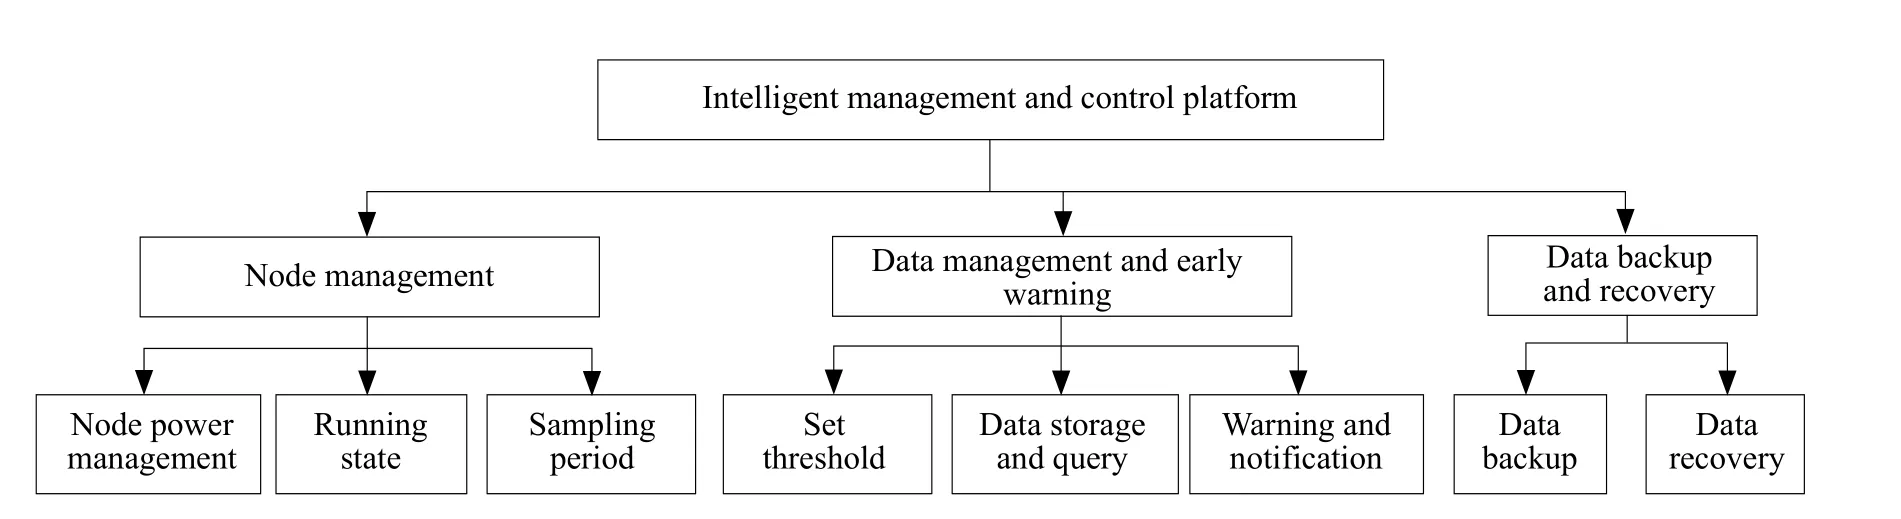
Fig. 3 System function structure diagram
Control Algorithm
Weighted fusion algorithm
In the process of data acquisition, owing to the complexity of the internal environment of the greenhouse,the numerical values of the same environmental factors at the same time might be different. The measured values could not reflect the internal environment of the greenhouse correctly. Therefore, it was necessary to process the collected data to reduce the unnecessary error (Xinget al., 2015). It could obtain the more accurate results and make the control more effective by using the weighted data fusion algorithm to deal with the data (Wanget al., 2001; Liuet al.,2009).
Taking temperature as an example: the observed values of two different temperature sensors were:

Where,vi(i=1, 2) was the random error of observation values, then setvi-N(0,), the two observation values of sensors were independent of each other. It was assumed thatwas unbiased estimate ofxand was linearly related to the observed valuesTi(i=1, 2) :

Ω=(ω1,ω2) was the weight of the measurement values of each sensor.
So the cost function was written as:

In order to getJminimum, computed Ω derivative of optimal weight, obtained:

So the optimal estimator was:

It showed that the most effective estimation value could be obtained from the observed values.Extended this conclusion to the case of multiple sensors, the variances of multi-sensor group wereσi(i=1, 2, …,n), and the measured values were independent. The true value of the estimated value wasTi(i=1, 2, …,n), which was an unbiased estimate ofxand the weighting factors of sensors wereωi(i=1, 2, …,n). According to the multiple function extremum theory, the optimal estimator of the system was obtained:

Fuzzy PID control
Fuzzy PID control was the combination of fuzzy control and PID control. The fuzzy control method was used to realize the selection of PID controller parameters which were used to realize the requirements for accurate control of the complex greenhouse internal environment (Tian and Jiang, 2003). The regulation of the greenhouse environment was a complex process. In actual processing, the data of greenhouse environment was usually compared with the threshold which was set according to existing experience. Then, the corresponding outputs were generated. It was easy to cause constant temperature fluctuations in the greenhouse by using the traditional control. Took temperature control as an example to introduce fuzzy PID control process.
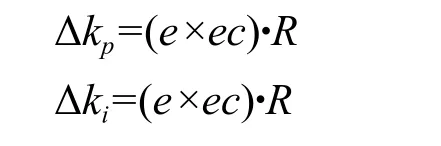
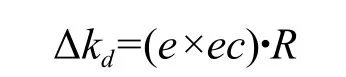
In this system, in(x) was the target value of temperature,cwas the actual measurement of temperature,out(y) was the final output of fuzzy PID controller.The inputs of the fuzzy PID controller were the erroreand error rateec. The fuzzy control outputs were Δkp,Δkiand Δkd.kp,kiandkdwere the parameters which input to PID controller. The control outputs were calculated and output by combining the fuzzy rule and adjusting PID parameters online. The structure of the fuzzy PID controller is shown in Fig. 4.
The outputs of fuzzy controller in fuzzy PID control were the increment of PID parameters. Based on the resultseandec, the fuzzy control rules were used to continuously modify the increments of the three parameters. PID controller obtained appropriate parameters under different environmental conditions to ensure that the controlled object reached an ideal state.In the choice of membership function, it was decided to use the membership function which was shown in Fig. 5 for the input and output of the fuzzy controller.This membership function combined the features of the normal-type function with the accuracy of the ambiguity and the trigonometric function. The normal membership function curve, which could ensure the stability of the system, was relatively stable. The triangular membership function curve, which could be more accurately converted into a fuzzy quantity with a higher resolution, was relatively steep.
The choice of PID control parameters would affect the control system's effect. In addition, it not only needed to consider the current state of the control system, but also took into account the role of the three parameters and their mutual influence. While the fuzzy PID control adjusted PID control parameters,it not only depended on the currenteandec, but also combined the fuzzy rule table. Therefore, the fuzzy rules table was also the core of fuzzy PID control.According to the existing control experience, the fuzzy control tables of Δkp, Δkiand Δkdwere designed, as shown in Tables 1, 2, and 3.
In the fuzzy inference, according to the existing rule base, the fuzzy values ofeandecin the fuzzy universe were respectively taken and combined to obtain the corresponding expressions. According to the expressions, the fuzzy quantities of the outputs were obtained and then the final outputs could be obtained after deblurring.
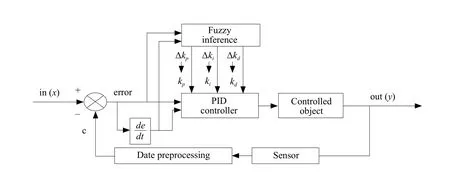
Fig. 4 Fuzzy PID control structure diagram

Fig. 5 Membership function diagram

Table 1 Fuzzy control of Δkp

Table 2 Fuzzy control of Δki
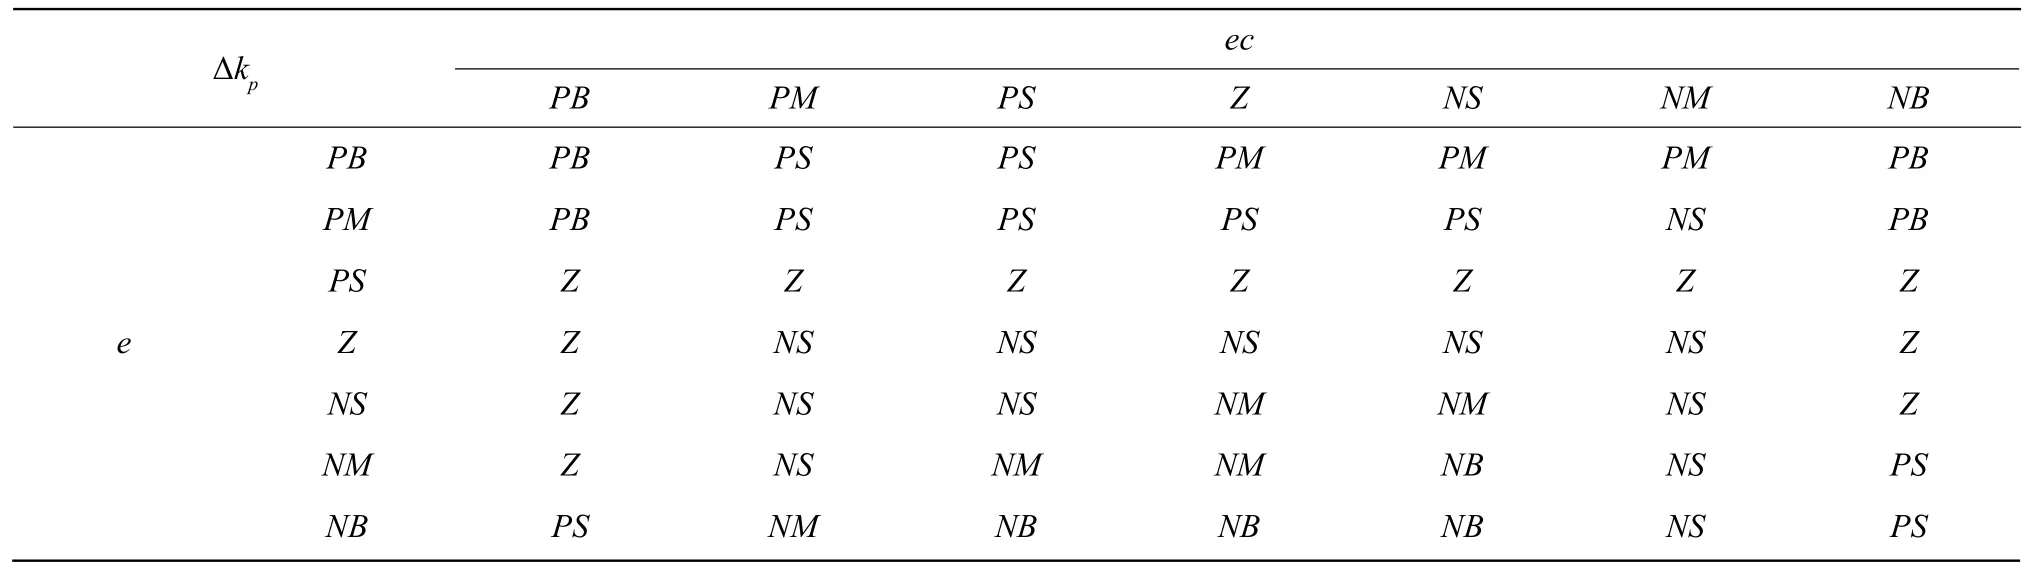
Table 3 Fuzzy control of Δkd
According to Tables 1, 2 and 3, the expressions of the output quantities Δkp, Δkiand Δkdwere generated:
1. IfewasNBandecwasNB, thenkpwasPBandkiwasNBandkdwasPS.
2. IfewasNBandecwasNM, thenkpwasPBandkiwasNBandkdwasPS.
……
49. IfewasPBandecwasPB, thenkpwasNBandkiwasPBandkdwasPB.
The 49 fuzzy quantity expressions obtained from the fuzzy rule base were merged into a fuzzy PID control fuzzy expression setR. In combination with the Mamdani reasoning method, the output blurring amounts of Δkp, Δkiand Δkdwere calculated based on the input blur amountse,ec:
Because the results were fuzzy quantity, the weighted average method was used to solve the ambiguity.
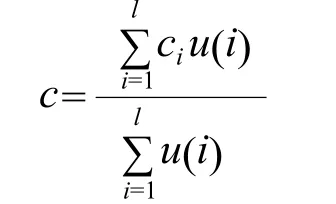
Where,cwas the output of fuzzy control,ciwas the output fuzzy field value, andu(i) was the membership degree corresponding tocifuzzy sub sets. The amounts after ambiguity were transferred to the basic domain of PID parameter. By multiplying the output of the fuzzy controller with the scale factor, the required adjustment amount could be obtained. The ratio factor was expressed inG, which was defined as:

The input parameters of PID controller were expressed as the followings:

kp,kiandkdwere the input parameters of PID controller.kp0,ki0andkd0were the initial parameter values of PID controller.Gp,GiandGdwere ratio factors.
In order to verify the fuzzy PID control algorithm used in this paper was superior to fuzzy control and classical PID control, the fuzzy control, traditional PID and fuzzy PID control were compared by using MATLAB (Liu, 2003). According to Tables 1, 2 and 3, the corresponding fuzzy rules were set up. Figs. 6,7 and 8 were fuzzy rule 3D surface maps used to simulate. The simulation step response results are shown in Fig.9. In the constructed model, a 20%disturbance was added at 15 s to test the system's antijamming capability. The simulation results are shown in Fig. 10.

Fig. 6 Output Δkp surface map

Fig. 7 Output Δki surface map

Fig. 8 Output Δkd surface map
From the simulation results of step response in Fig. 9,the overshoot of fuzzy PID control was smaller than traditional PID control and there was no overshoot in fuzzy control. Although fuzzy control had no overshoot and adjusted smoother, the corresponding speed was not fast enough. If amplified the simulation results,there was static error in fuzzy control. Compared to the classical PID control and fuzzy control, the fuzzy PID control could quickly and accurately adjust the corresponding parameters to the set target. And the overshoot was also relatively small. The simulation results in Fig. 10 were after adding disturbance. From the results, fuzzy PID had strong anti-interference and good robustness.
System Test and Analysis
Test of ZigBee
Communication quality and distance of WSN played an important role in the whole system. Communication quality determined the experimental data could be collected smoothly or not. Only the experimental data were collected normally, the whole system worked properly. The communication distance determined the distance of the sensor nodes in the solar greenhouse.This section tested the communication distance of the WSN in the system. Generally, weather environment,surrounding obstacles, housing construction and nearby communication facilities would affect the length of the communication distance. This part of the test occurred in the greenhouse in order to accurately test the communication distance. The whole test process used the way of point to point and chose the communication module base on CC2530. In order to improve the accuracy of the test, 100 packets were sent at different distances.
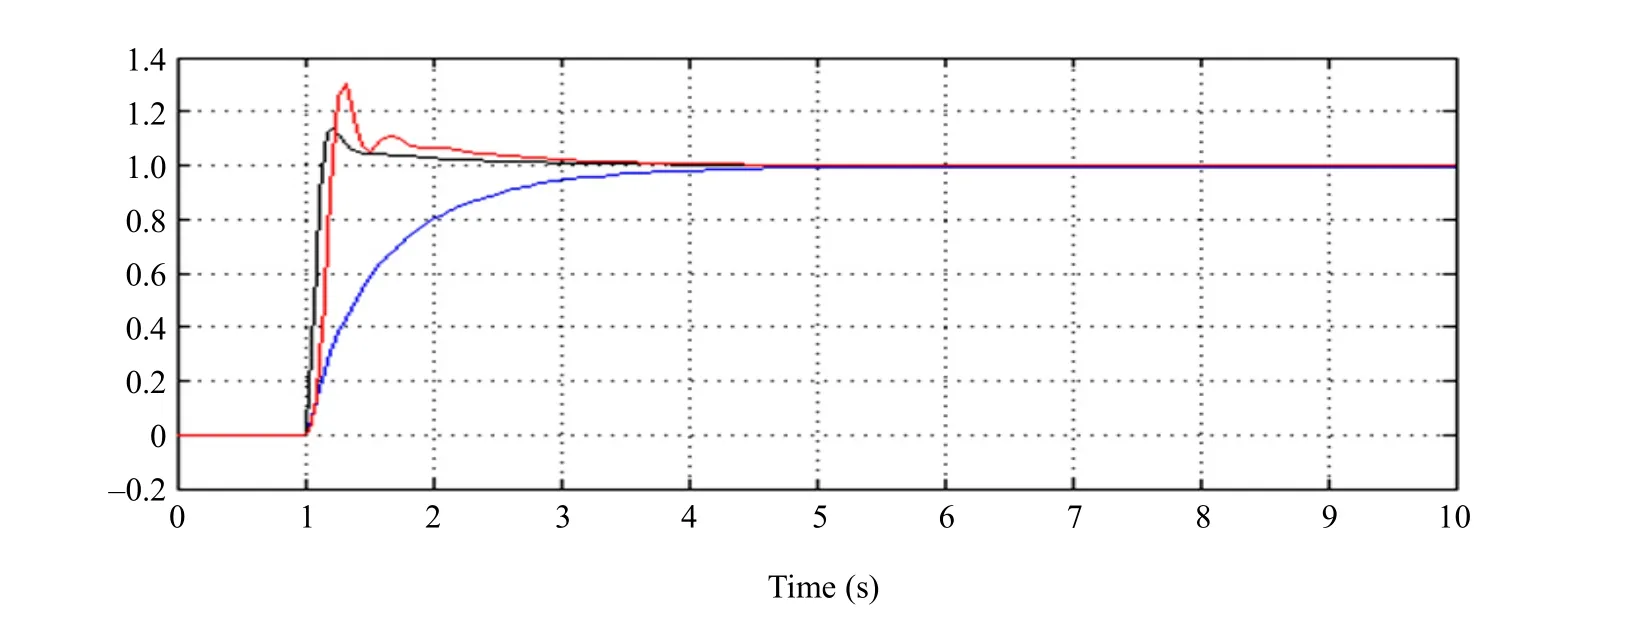
Fig. 9 Simulation results

Fig. 10 Simulation results with adding interference
As shown in Table 4, the security distance of the system wireless transmission was in 90 m. The packet loss rate had increased with the increasing distance.The packet loss rate was within 10% and met the actual demand within 100 m. The communication ability of wireless sensors could meet the requirements in the actual situation of sunlight greenhouse.
System integrity test
The whole system was tested in the glass greenhouse of the Horticulture Engineering Center of Northeast Agricultural University. Horticulture Engineering Center glass solar greenhouse was scale of 40 m×40 m, growing vegetables, no large obstacles. The test environment is shown in Fig. 11.
This test took place in July 2016 and lasted for a week. There was a adjacent glass greenhouse as reference which did not be controlled. Temperature and humidity sensors were about 2 m from the ground.Exhaust fans and water curtains were located in both sides of the greenhouse. The complementary lights were located about 2 m above the plant. The data,which were collected every 10 min, were stored in the database. The collected data were processed and compared with SPSS22.0.0.0 data statistics software.
As shown in Fig. 12, temperature difference was obvious between the two environments from 8:00 a.m.-12:00 p.m. There was no much difference from 0:00 a.m.-8:00 a.m. When the temperature was adjusted, it needed to achieve the optimum growth by referring to the threshold which set different constant values for different time periods. For example,the threshold was set the range between 25-27℃from 8:00 a.m. to 6:00 p.m. Because plants did not perform photosynthesis at night, reducing indoor temperature could reduce the energy consumption of respiration. But taking into account the cost, it should not be adjusted too low. The daytime was the period of plant growth and photosynthesis. So suitable temperature would make the plant grow better.
As shown in Fig. 13, requirement of humidity for crop growth was relatively loose. But diseases occurred easily in an over wet or dry environment.Photosynthesis would be weakened if humidity was not suitable for plant. So the threshold was set the range between 55%-60%, from 8:30 a.m. to 4:30 p.m.A suitable humidity reduced diseases or pests and increased photosynthesis. It was more conducive to plant growth through the proper adjustment.
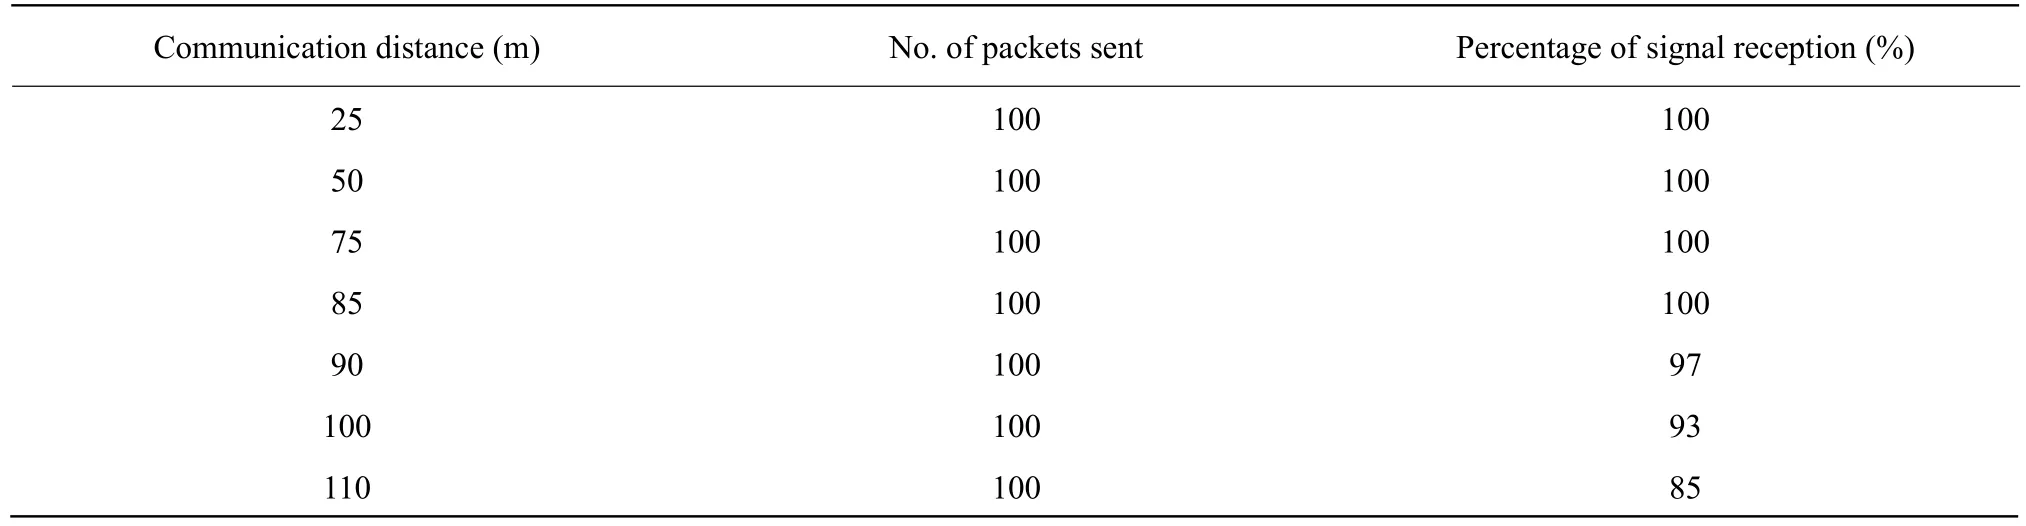
Table 4 ZigBee network communication test
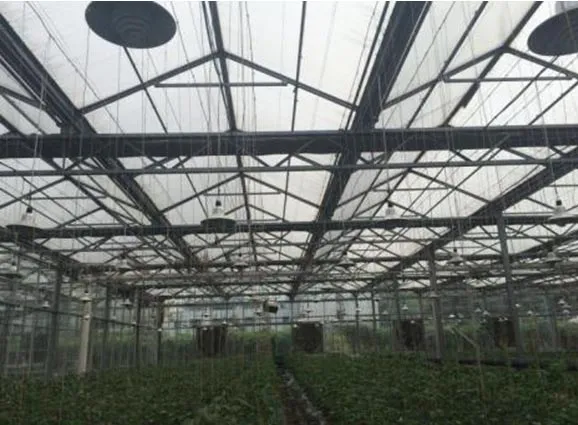
Fig. 11 Greenhouse internal test environment
As shown in Fig. 14, the need for light intensity of crops was closely related to the temperature.When the temperature did not elevate, the strong light would not conducive to the growth of crops. It should be ensured the occurrence of photosynthesis by supplementing light in the weak light. The regulation of light mainly occurred from 7:00 a.m. to 5:00 p.m.The threshold was set the range between 17 000-22 000 lx. The regulation of high intensity light was more effective than low intensity light. Because the effect was obvious by using the shading plate, the light illumination supplement effect was not useful.The main reason was that the light intensity of the artificial light source was not powerful enough. Taking into account cost, the method to supplement the light intensity should be further studied.

Fig. 12 Temperature change chart
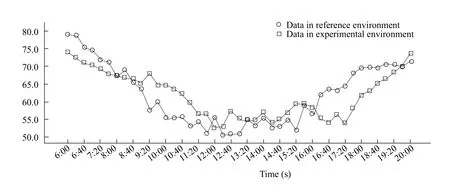
Fig. 13 Relative humidity change chart
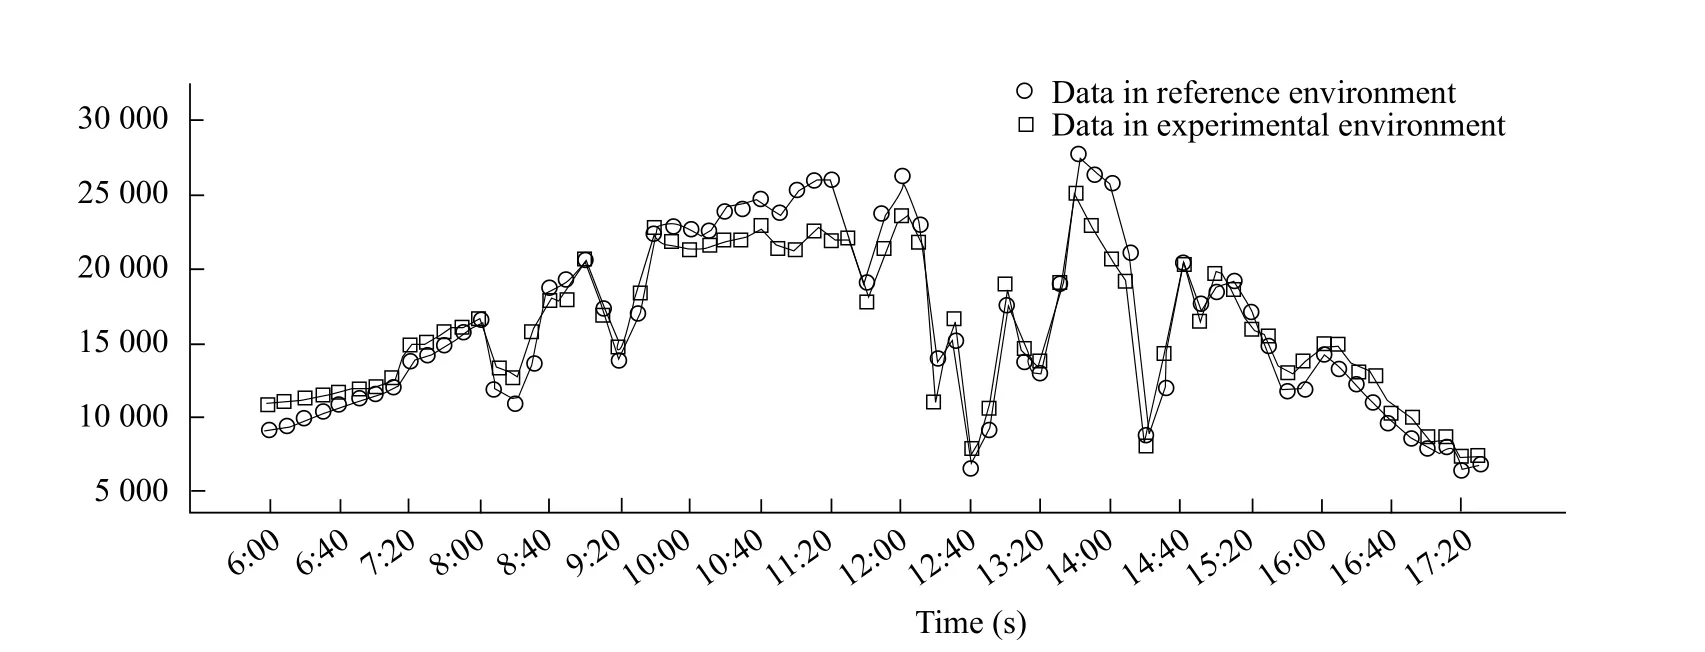
Fig. 14 Variation of light intensity
Conclusions
It was a new system that on the basis of understanding the requirement of the greenhouse monitoring system and analyzing the existing problems of the existing monitoring system. Based on technology of WSN,a greenhouse monitoring system had been designed and implemented. Greenhouse environment affected plant growth process and also be affected by plants,such as photosynthesis and transpiration. Therefore,greenhouse environment control was very complex.In this paper, the fuzzy reasoning was applied to the environmental control system of greenhouse by fuzzy control rules which combined the expert experience.In order to eliminate static error in fuzzy control system and improve system response speed, fuzzy control combined with PID control was adopted.The application of fuzzy PID control strategy in the greenhouse environment control system overcame the problems of long adjustment time and poor antiinterference ability in greenhouse environment. The system had realized the fast ad hoc network of sensor nodes and the real-time collection, transmission and adjustment of various greenhouse environmental factors. And the test verified that the algorithm could effectively control the greenhouse environment after the analysis of the results. In the future, the development direction of the intelligent control of greenhouse will be the fusion technology of many control algorithms. The combination of multiple algorithms will become the development direction of greenhouse intelligent control.
Bi W H, Chen X. 2009. Intelligent greenhouse monitoring system based on GSM.Electronic Measurement Technology, 32(3): 114-116.
Chen K T, Zhang H H, Zhang Y M,et al.2014. Design of wireless sensor network gateway node based on CC2530.Journal of Northwest Agriculture and Forestry University, 42(5): 183-188.
Du H, Xu F, Chen J K. 2004. Design of the greenhouse control system based on CAN bus network technology.Machine Tool and Hydraulic, 10(6): 117-118, 136.
Ge J. 2007.Research on tree topology algorithm of wireless ad hoc network. University of electronics technology, Chengdu.
Lei Y, Li Z T. 2014. Adaptive fuzzy PID control.Control Engineering for Greenhouse Temperature System, 21(S1): 23-27.
Li J B, Hu Y Z. 2011. The application of CC2530 based ZigBee communication network design.Electronic Design Engineering, 19(16): 108-111.
Li L, Liu G. 2006. Design of greenhouse environment monitoring system based on Bluetooth technology.Journal of Agricultural Machinery, 10: 97-100.
Liu J K. 2003.Advanced PID control and MATLAB simulation.Publishing House of electronics industry, Beijing.
Liu T M, Xia Z X, Xie H C. 2009.Data fusion technology and its application. National Defense Industry Press, Beijing. pp. 18-21.
Peng L. 2000. Research on the detection and control system of the greenhouse.Computer Engineering, 26(12): 194-195.
Tian S H, Jiang L J. 2003. A parameter self tuning fuzzy PID controller is studied.Electric Drive Automation, 6: 28-30.
Wang F, Liu Y, Shao J P. 2001. Multi sensor data fusion technology and its application.Journal of Harbin University of Science and Technology, 1: 81-84.
Wang F Y, Zhao Y M, Zhang X Y,et al. 2009. Design of intelligent measurement and control system of greenhouse based on piecewise control strategy.Journal of Agricultural Machinery, 40(5): 178-181.
Wang N, Zhang N Q, Wang M H. 2006. Wireless sensors in agriculture and food industry recent development and future perspective.Computers and Electronics in Agriculture, 50(1): 1-14.
Xing X C, Cai Y W, Jiang T,et al.2015. A data adaptive weighted fusion algorithm.Telecommunication Technology Considering Sensor Precision, 55(10): 1079-1086.
Yang W, Lv K, Zhang D,et al.2010. The development of the greenhouse wireless intelligent control terminal based on ZigBee technology.Journal of Agricultural Engineering, 26(3): 198-202.
Zhang J, Yang Q L, Ge Z Y,et al.2013. Monitoring system construction and CC2530 transmission characteristic analysis of greenhouse environmental parameters wireless sensor network.Acta Agri Engineering, 29(7): 139-147.
Zhang W. 2013.Research on the key technology of wireless sensor network for fine agriculture. Zhejiang University, Hangzhou.
Zhang X W, Dai H P, Xu L J,et al.2013. Mobile assisted data collection strategy in wireless sensor networks.Software Journal, 24(2): 198-214.
 Journal of Northeast Agricultural University(English Edition)2018年2期
- Journal of Northeast Agricultural University(English Edition)的其它文章
- Development of High Efficient in vitro Regeneration and Transformation System in Strawberry
- Effects of Low Temperature on Physiological Responses of Two White Clover Cultivars
- Risk Assessment of Maize Cold Damage in Heilongjiang Province in Recent 30 Years
- Evaluation of Post-operative Anti-stress Response of Dexmedetomidine in Dogs
- Effect of Lactobacillus acidophilus as a Dietary Supplement on Nonspecific Immune Response and Disease Resistance in Juvenile Common carp, Cyprinos carpio
- Identification and Genetic Diversity Analysis of Chinese Mitten Crab(Eriocheir sinensis) in the Liao River Area