
Comparison of hydrodynamic influence between different types of bay reclamations *
2018-09-28 05:34XuefengXu许雪峰QiqiHe何齐齐DanSong宋丹ZhongliangYang杨忠良LiangliangYu俞亮亮
水动力学研究与进展 B辑 2018年4期
Xue-feng Xu (许雪峰), Qi-qi He (何齐齐), Dan Song , (宋丹), Zhong-liang Yang (杨忠良),Liang-liang Yu (俞亮亮)
1. Key Laboratory of Engineering Oceanography, Second Institute of Oceanography, State Oceanic Administration, Hangzhou 310012, China
2. Institute of Physical Oceanography, Ocean College, Zhejiang University, Zhoushan 316021, China
3. State Key Laboratory of Satellite Ocean Environment Dynamics, Second Institute of Oceanography, State Oceanic Administration, Hangzhou 310012, China
Abstract: Different reclamation types to be used for the tidal flat have different hydrodynamic influences on the bay. Numerical experiments based on the land reclamation (LR) and the mariculture reclamation (MR), respectively, are conducted for the same reclamation project in the Shuangpantu, for quantitative comparisons. Results show that the MR has less influence on the hydrodynamic environment than the LR. The difference is more than 50%.
Key words: Hydrodynamic influence, land reclamation (LR), mariculture reclamation (MR), numerical modeling, tidal flat
Introduction
With the growth of population in estuarial and coastal areas, the lack of land resource becomes more and more a severe issue. Comparably abundant tidal flats, therefore, are always considered to be significant reserves of the land resource. For farming, in particular, there are commonly two ways to use these tidal flats: one is by the land reclamation (LR), through which the land can be obtained by filling soil, sand, or rocks into the sea, the other is by the mariculture reclamation (MR), through which the enclosed bay is used for the aquaculture and the water exchanges can be achieved by intake and outlet sluices.
Reclamation projects, however, are shown to have hydrodynamic effects on the coastal environment[1-3]. Newly-built sea dikes will change the local landform, and in turns, the characteristics of the tide and the tidal current[4-7]. And the sediment transport near the reclamation region will be adjusted to reach a new balance in erosion and deposition[8-11]. Furthermore, the effects of reclamation projects on tide, tidal current, and sediment transport will sometimes diffuse to the far-field[12-13]. Finally, the river regime, the flood control and the storm surge forecast all need to be reconsidered after the reclamation[14-16]. In a word,the tidal flats must be rationally exploited to avoid unexpected hydrodynamic influences.
The two different types of farming reclamations mentioned above, the LR and the MR, will of course have different hydrodynamic influences. And the latter is supposed to have a less influence, since it will not change very much the nature of the tidal flat. But no quantitative comparison has yet been presented in literature. In this paper, we have established 2-D numerical models of the tidal current in the Sanmen Bay, based on the LR and MR types, respectively, in the Shuangpantu project, to estimate their influence on the hydrodynamic environment.
1. Model description
1.1 Research Area
The Sanmen Bay, located in the eastern part of Zhejiang province in China, is selected in this paper as an example to carry out numerical analyses. It is a macro-tide semi-enclosed bay with many ports on the tidal flat connected by channels. Massive reclamation projects have greatly reduced the capacity of the tidal forces in the Sanmen Bay, as well as the hydrodynamic environment, by decreasing the tidal velocity and the sediment transport. However, with the demand of the social development in the coastal area, new reclamation projects are to be carried out, which may further deteriorate the environment. Therefore, it is of great importance to study the hydrodynamic effects of different reclamation types in the Sanmen bay.
In the model, the water column is set to be vertically well mixed. The tidal current flows are unsteady under the influence of the topography and the river runoffs. The shallow-water tidal-current equations with the horizontal eddy viscosity terms obtained through the vertical integration are applied as the governing equations[17-18]. For the sake of easily determining the boundary conditions, we take the Ketangshan and the Jinqi as the south boundary, and the Shipu as the eastern boundary to form the research area. The total size of the model domain is about 900 km2and the computational grids are shown in Fig. 1.

Fig. 1 (Color online) Computational grids
In the numerical model, a curvilinear grid is applied to divide the computational domain[19-20],which can fit the boundary curve better than the ordinary rectangular grid, so that the flow state at the boundary could be better simulated to reduce the influence of the boundary. A grid model in the large scale and the local refinement is established in this paper. The computational domain is divided into 300×300 patterns with a total of 90 000 grids, with the maximum grid length of about 150 m, and the grid scale near the reclamation area controlled within the range of 30 m, and the computational time step is 1 min.The density distribution of grids is designed to realize the 2-D simulation with consideration of the whole model region and a high precision.
1.2 Governing equations
It is assumed that from (x, y) to (ξ ,)η is a transformation from the rectangular coordinates to the curvilinear coordinates. Without considering the influence of the wind-stress, under the orthogonal curvilinear coordinate system, the 2-D hydrodynamic governing equations obtained through the vertical integration are[21]:

where ζ is the tidal level, gξand gηare the transformation coefficients, g is the gravitational acceleration, Aξand Aηare the eddy viscosity coefficients, u and v are the velocity components in the direction of ξ and η , h is the depth of the still water, H=h+ζ is the total depth, t is the time, C=1/nH1/6is the Chezy coefficient, n is the roughness coefficient, f=2π sinφ is the Coriolis coefficient, ω is the rotation velocity of the Earth and φ is the latitude.
Since the governing equations under an orthogonal curvilinear grid have a structure similar to that under the rectangular coordinate system, we use the traditional ADI numerical method to solve the dispersion of the hydrodynamic equation.
1.3 Boundary conditions
The open boundary conditions are obtained through the water level control, that is, the method of the tidal level forecast[16]

where A0is the mean sea level, Fi, (v0+u)iare the astronomical factors and Hi, giare the harmonic constants. Eleven partial tides are chosen for the harmonic constants, including 4 diurnal constituents (Q1, O1, P1, K1), 4 semidiurnal constituents (N2,M2, S2, K2) and 3 shallow water constituents (M4, MS4,M6). We use the floodplain processing technology of the flood and ebb method in this paper[17].
1.4 Initialization and parameters
The tidal level is set to a constant and the velocities are set to zero in the model initialization.The Coriolis force f=2π sin(29.1°), the coefficient of the viscosity A=20-60 m2/s , the seawater density ρ=1 020 kg/m3, the roughness coefficient n=0.02.
The model simulation time is from 0:00 May 15,2003 to 0:00 May 25, 2003, which is the same as in the observation station data.
2. Verifications
Between May 15, 2003 and May 25th, 3 tidal stations, W0, W2 and W6 (in positions as shown in Fig. 2), were set up in Sanmen Bay. The tidal observations at these 3 tidal stations were carried out for 10 consecutive days, from the May 15th 0:00 to May 25th 0:00.

Fig. 2 Verification points of tidal level and current
At the same time, two tidal stations, Station 6 and Station 9 (in positions as shown in Fig. 2), were set up from May 16th 9:00 to May 17th 12:00 for 28 h of continuous flow observation, measuring in a hourly interval. The modeled tidal level is compared with the observations at stations W0/2/6, while the tidal current is compared at stations 6/9.
2.1 Tidal level verification
During the hydrologic survey period, the tidal level verification is carried out and the results are shown in Fig. 3, from which we can see that the simulation results agree well with the observations.Generally, the simulation error of the highest and the lowest tidal levels is within the range of 0.1 m.
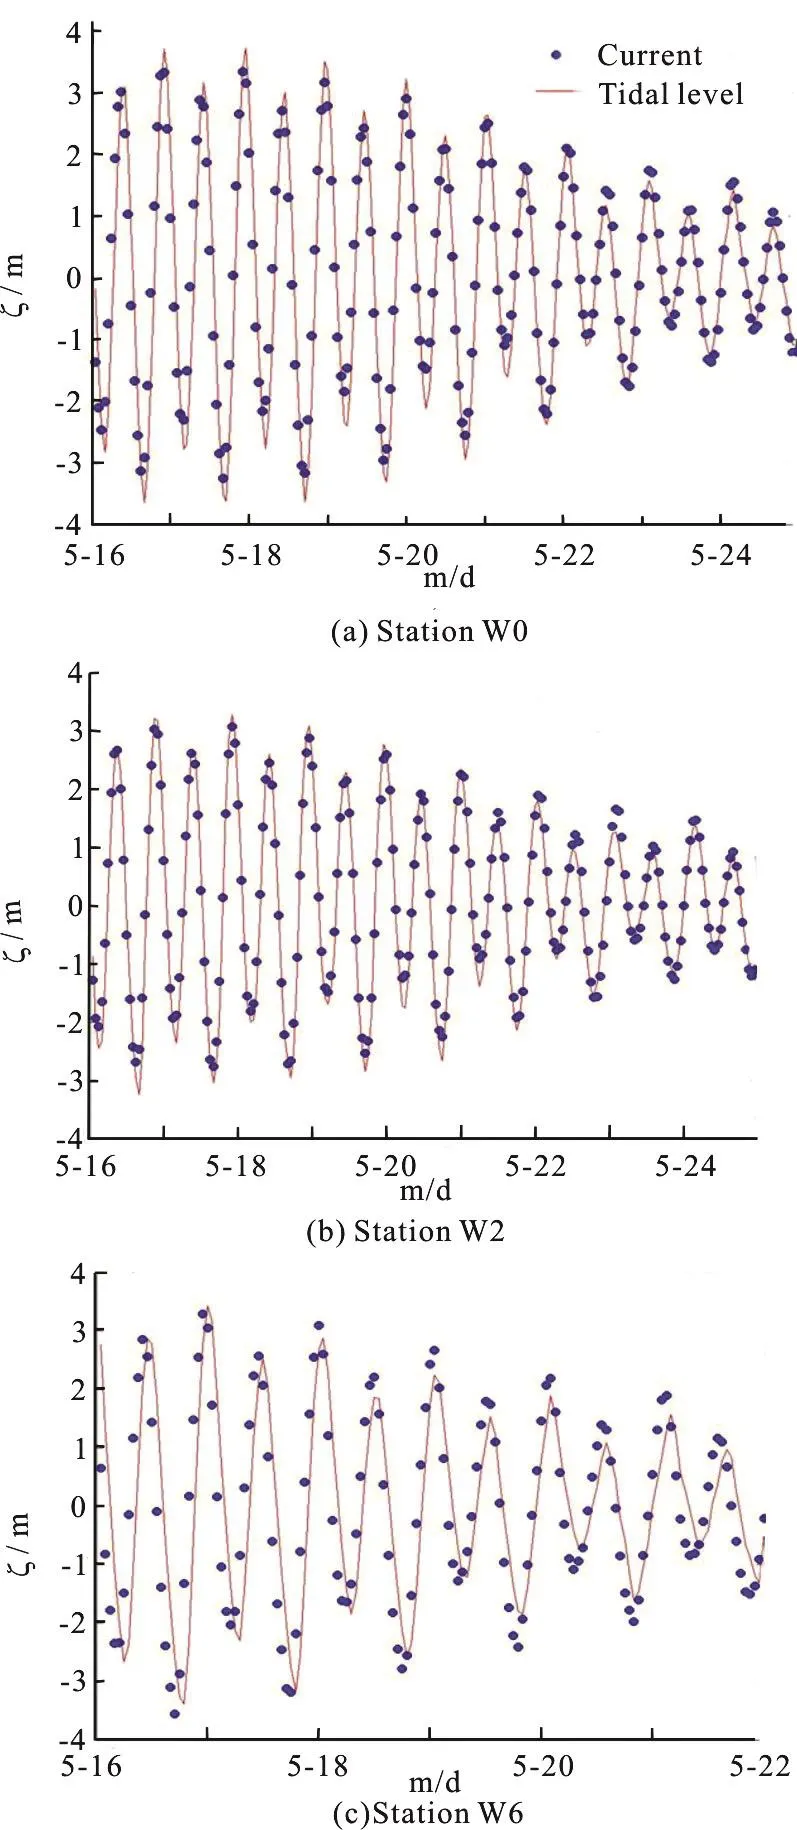
Fig. 3 (Color online) Tidal level verifications
2.2 Tidal current verification
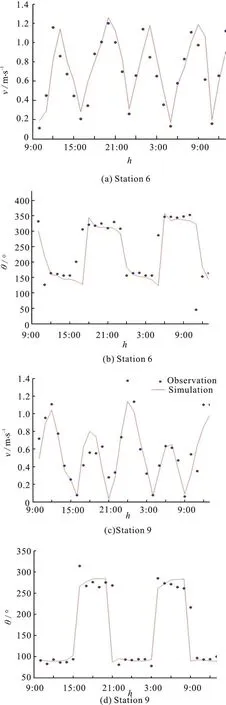
Fig. 4 (Color online) Verifications of tide velocity and direction
For the tide velocity and direction in the engineering area, we make spring tide verifications at the two current stations in this paper, and the results are shown in Fig. 4. Generally, the difference between the simulation results and the measured results at a single station in the flood tide and ebb tide rapid direction is within 10°. The mean velocity difference between the flood tide and ebb tide rapids is within 10%. Generally speaking, the simulation results of the tide velocity and direction at a single station are satisfactory and the model could be applied to the post forecasting work of the project.
3. Results and discussions
3.1 Tidal current before reclamation
The results of the tide simulation verification at a single station within the computational domain are quite satisfactory and basically reflect the actual changes of the tidal current in the project area. The flow field distribution of the study area (in positions as shown in black box, Fig. 1) is shown in Fig. 5.

Fig. 5 Vector charts of flood tide and ebb tide maxima near Shuangpantu before the implementation of reclamation
The wide tidal flat around the Sanmen Bay involves a part of the tidal water storage capacity.When the tide rises, the tidal water covers the bank at a small flow velocity, while at the low tide, the flow velocity increases from the bay top to the mouth. Thus,the flow velocity of the ebb tide is greater than that of the rising tide under the influence of the narrowing channel and the maximum flow velocity is found near the entrance and has the tendency of decreasing from outside to inside gradually. The Maotou and Manshan tidal inlets have major impacts on the nearby water area of the research area. The analysis and the calculation show that the Sanmen Bay has significant tides and the maximum flow velocity in the Liyanggang is 1.42 m/s, the maximum flow velocity in the Qingshangang is 1.30 m/s, the maximum flow velocity in the Shepan water channel is 1.40 m/s.
3.2 Reclamation schemes
The LR scheme: with the project, 37.6 km2land and 11.66 km seawall could be obtained through construction (Fig. 6). The MR scheme: the project reclamation area is 37.6 km2. The seawall is 11.66 km,and 6 sluices are set with width in the range from 15 m-50 m, as shown in Fig. 6, the reclamation area of two schemes is the same, but with different sea application methods, sluices are set to keep water changes.

Fig. 6 Dam and sluice arrangement in reclamation project
The width of each sluice: Sluice1-15 m, Sluice2-50 m, Sluice3-50 m, Sluice4-50 m, Sluice5-30 m,Sluice6-30 m.
3.3 Influence of LR on tidal current
The tidal currents after the implementation of the LR project are shown in Fig. 7.
Flood current: the LR project scheme has blocked most mud flat of the Qingshangang and all crossroads in the port. This scheme has reduced the most capacity of the tidal water storage in the Qingshangang. The original floodplain tide near the mud flat is large, and the floodplain tide in the Qingshangang almost disappears after the implementation of this project. The Qingshangang is left with a limited area without reclamation, the flow regime in the remained water area becomes disordered, and the flow velocity is decreased significantly.
Ebb current: quite similar to the flood current,less water area is left in the Qingshangang, the dynamics of the ebb tide are weakened significantly,and the flow regime becomes more disordered after the project.
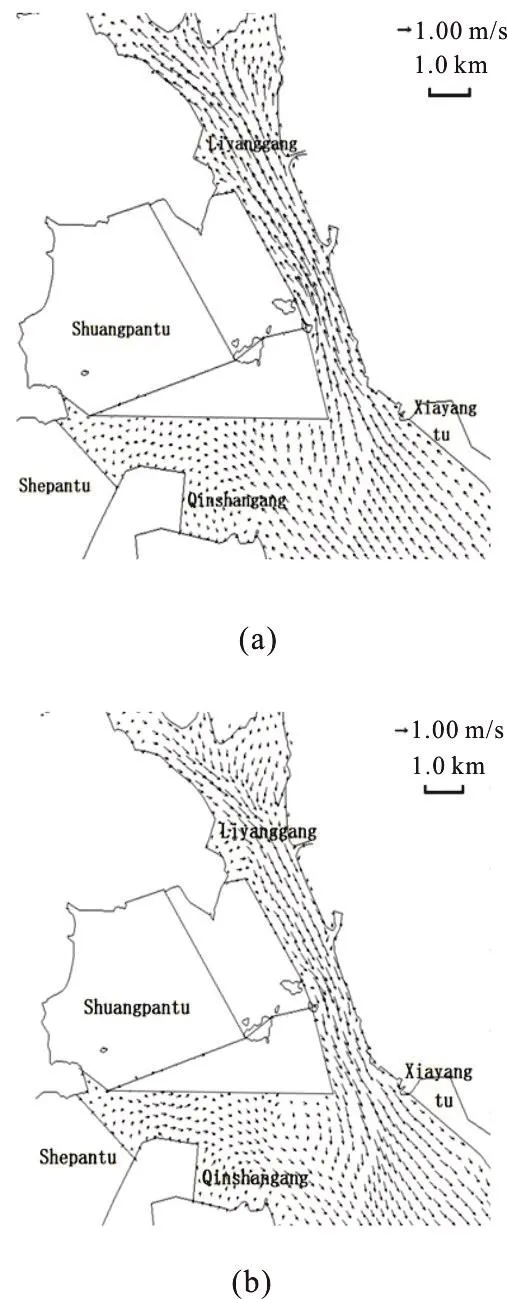
Fig. 7 Vector charts of flood tide and ebb tide maxima after LR
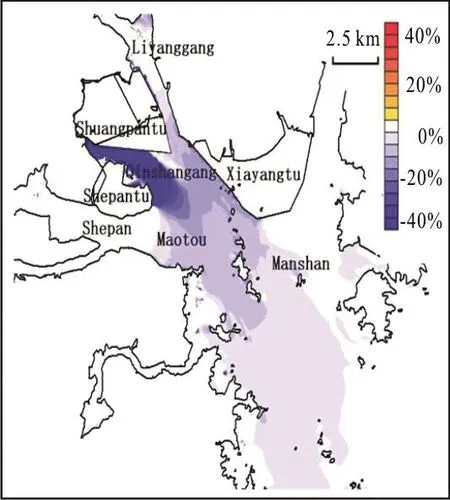
Fig. 8 (Color online) Change rate of mean flow velocity after LR
The forecast of the flow velocity change after the project is shown in Fig. 8. It could be seen from the figure that the tidal currents are decreased in the water channels of the Manshan, the Qingshan and the Maotou (see Fig. 1). The flow velocity in the Manshan water channel is reduced by 8%-20%, in the Qingshangang, the reduction reaches almost 50%, in the Maotou water channel, the reduction is about 11%-15%, while the flow velocity changes little in the Liyanggang and Shepan water channels. This scheme weakens almost all dynamics of the tidal current of the Qingshangang, so it influences the Manshan and Maotou water channels.
3.4 Influence of MR on tidal current
The tidal currents after the implementation of the MR project are shown in Fig. 9.
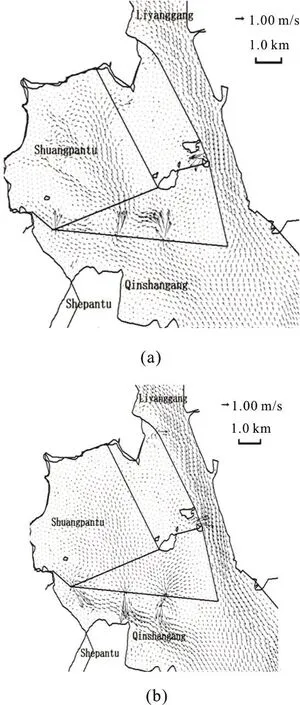
Fig. 9 Vector charts of flood tide and ebb tide maxima after MR
Flood current: the farming area is 56 400 Mu,and 6 sluices are set with the maximum width of 50 m.This scheme reduces a part of the capacity of the tidal water storage of the Qingshangang. After the implementation of the scheme, although the tidal current crossroads within the port are kept, the floodplain tidal currents are reduced significantly. From the drainage effect of the sluices, the tidal current dynamics of the crossroads on the south side of the port are well reserved. The intake and the drainage of the water of the sluices have a certain effect on maintaining the tidal current dynamics.
Ebb current: quite similar to the flood current, for the intake and the drainage of the water of the sluices,the tidal current dynamics of the crossroads on the south side of the port are reserved. Although the reclamation area is large and the tidal capacity is greatly reduced, certain tidal current dynamics of the port have remained by setting the sluices.
The forecast of the flow velocity change after the project is shown in Fig. 10. It could be seen from the figure that the tidal currents are decreased in the water channels of the Manshan, the Qingshan and the Maotou (see Fig. 1). The flow velocity in the Manshan is reduced by about 5%-11%, in the Qingshangang,the reduction reaches almost 10%-25%, in the Maotou water channel, the reduction is about 5%-7%, the flow velocity changes little in the Liyanggang and Shepan water channels. In this scheme, the flow velocity near the sluice is increased significantly and the flow velocity within 1 000 m upstream and downstream of the sluice on the side of the Qingshangang is increased where it is increased several times at the sluice, with the maximum flow velocity of 5 m/s.
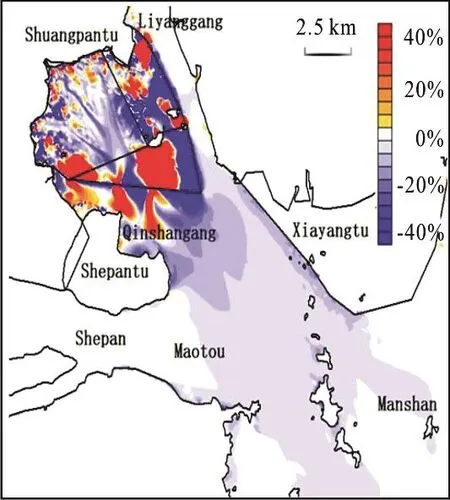
Fig. 10 (Color online) Change rate of mean velocity after MR
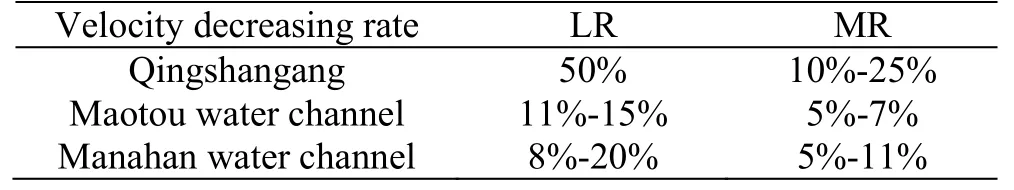
Table 1 Influence of different reclamation types on tidal current
4. Conclusions
The numerical simulations are carried out for the hydrodynamic influence of different reclamation types used in the Shuangpantu project in the Sanmen Bay.The land and mariculture reclamations are simulated in the model. The results show that compared with the mariculture reclamation, the land reclamation has a greater influence on the hydrodynamic environment.In the same sensitive area, the difference between these two types can reach more than 50%. For example, the difference of the tidal current velocity reduction in the Qingshangang and Maotou water channels between the two schemes is more than 200 %(Table 1). To sum up, different types of bay reclamations in the same project have quite different hydrodynamic influences. In particular, the LR plays a very significant role in reducing the tidal prism. Therefore,it should be cautious in carrying out construction of the LR project.
Acknowledgements
This work was supported by the Scientific Research Fund of the SIO, SOA (Grant No. JT1308).The authors would like to thank the editor, the reviewers, Prof. Xue-en Chen, Drs. Jia-wang Chen and Xi-zeng Zhao for remarkable suggestions.
猜你喜欢
红领巾·成长(2022年6期)2022-07-23
杂文月刊(2019年19期)2019-12-04
当代小说(2018年2期)2018-07-28
妇女生活(2018年7期)2018-07-14
中学生博览(2017年20期)2017-11-07
广东第二课堂·小学(2017年4期)2017-04-22
试题与研究·教学论坛(2017年6期)2017-02-28
中国三峡(2016年5期)2017-01-15
歌海(2016年1期)2016-03-28
- 水动力学研究与进展 B辑的其它文章
- Call For Papers The 3rd International Symposium of Cavitation and Multiphase Flow(ISCM 2019)
- Investigation of the hydrodynamic performance of crablike robot swimming leg *
- Determination of epsilon for Omega vortex identification method *
- Transient curvilinear-coordinate based fully nonlinear model for wave propagation and interactions with curved boundaries *
- Tracer advection in a pair of adjacent side-wall cavities, and in a rectangular channel containing two groynes in series *
- Numerical simulation of transient turbulent cavitating flows with special emphasis on shock wave dynamics considering the water/vapor compressibility *