
Analyzing the Structure and Connectivity of Continent-Level Internet Topology
2019-06-12 01:23XionglveLiJunhuaXiZhipingCaiTaoYangandChakFongCheang
Computers Materials&Continua 2019年6期
Xionglve Li,Junhua Xi,Zhiping Cai, ,Tao Yang and Chak Fong Cheang
Abstract:The research and analysis of Internet topology is hot in the field of network measurement,which have important applications in network security,traffic scheduling and many other fields.Most of the existing works are focused on the AS-level and routerlevel topology,but few works are about the IP-level topology.In fact,obtaining the topology of each continent and knowing how the topologies of the continents are connected to each other can help us understanding the Internet around the world more thoroughly.In this paper,we obtained data sets from RIPE,constructed and analyzed network topologies of all the continents.By analyzing the topological connections between continents,we found out that most of the junctions of inter-continent traces are located in a few countries.
Keywords:Topology,IP-level,connectivity,continent.
1 Introduction
Internet topology [Faloutsos,Faloutsos and Faloutsos (1999);Chen,Chang,Govindan et al.(2002);Tangmunarunkit,Govindan,Jamin et al.(2002);Akgun and Gunes (2013)] identification is a key component of network measurement and the basis of Internet management.It is important for network protocol design,network modeling,cyber security,simulation and network algorithm performance optimization [Cai,Yin,Liu et al.(2005);Zhang,Cai,Liu et al.(2018);Li,Cai and Xu (2018);Cheng,Xu,Tang et al.(2018)].Network topology measurement uses different methods and techniques [Motamedi,Rejaie and Willinger (2015)] to speculate and identify the logical topology of the target network and get the geographic information about it.
There are two main types of topology measurement methods nowadays.One is passive measurement based on BGP,by collecting AS path information recorded in routing table to construct AS-level topology and improve the completeness of topology by information recorded in different management organizations;Another method is active detection based on traceroute.Probe agencies deploy multiple probes around the world to detect different target IP addresses through traceroute,thus we can obtain IP-Level topology.In order to get the Router-Level topology,we also need a kind of technique called IP Alias Resolution [Gunes and Sarac (2009);Keys (2010);Keys,Hyun,Luckie et al.(2013)] to identify router interfaces belong to the same router.
As we all know,the level of Internet development in all continents and countries are uneven,in order to clarify the differences,a feasible method is measuring the topological structure of administrative divisions.The characteristics of network traffic presents when pass through continents and countries are also interesting questions,these characteristics can also reflect the status of the administrative divisions in the Internet world.
Canbaz et al.[Canbaz,Bakhshaliyev and Gunes (2018)] analyzed Router-Level Topologies of Autonomous Systems and got the characteristics of the ASes,and analyzed the topranked ASes in detail.Huffaker et al.[Huffaker,Fomenkov and claffy (2016)] used both BGP and traceroute data to build the AS-Level topology and found it contributed to get a more completely AS-Level topology.
In this study,we construct a IP-Level topology based on public traceroute data set and mapped all the IP addresses in the topology into administrative divisions with commercial IP address location databases and the boundary data,then we constructed IPLevel topologies for all the continents,obtained the number of nodes,maximum degree,average node degree,average of average neighbor degree,mean local clustering of the topologies.Through further analysis,we find that most of the junctions of the intercontinent traces usually located in a few countries.
2 Data sources
2.1 Traceroute data
Traceroute creates a path from the source address to the destination address by sending multiple packets to the same destination address,increasing the TTL value of each packet in turn,and recording the IP address of each ICMP time-exceeded message.Most of the traceroute technologies use ICMP protocol packets,but there are also traceroute technologies using UDP and TCP packets [Luckie,Hyun and Huffaker (2008)].However,there are some problems with traceroute,for example,due to traffic scheduling and other reasons,the path returned by different TTL values may change.Paris traceroute [Augustin,Cuvellier,Orgogozo et al.(2006)] can effectively solve this problem.
In this paper,we used public traceroute data from Ripe NCC Atlas [Ripe (2018)],Ripe NCC is a measurement platform deployed in Jan 2013 by the RIPE Network Coordination Centre which located in Amsterdam.Until October 19,2018,the RIPE measurement platform consists 10,163 available probes distributed in 183 countries and regions around the world capable of performing RTT,ping,traceroute,DNS,SSL,NTP and HTTP measurements.Every day the available traceroute traces are more than 1000M,including about 1.6 M links and 0.6 M unique nodes.
2.2 IP geolocation database
To build a topology graph based on administrative divisions,get the location of a router interface address is an indispensable step.There are many commercial databases can be used to accomplish this work,what we use is the GeoLite [MaxMind (2018)],according to the statement of MaxMind,they got 99.8% accuracy on the country level [GeoLite Accuracy (2018)],and in the research of Gharaibeh et al.[Gharaibeh,Shah,Huffaker et al.(2017)],the accuracy of the country level of GeoLite is over 80%,and the main incorrect occurs in some countries with small number of IP addresses appeared in our topologies (less than 1%),so we think GeoLite is acceptable.
2.3 Administrative division boundary data
The website http://gadm.org regularly organizes the boundaries of global administrative divisions [Wikipedia-administrative (2018)] according to the data on Wikipedia with the OpenStreetMap [OpenStreeMap (2018)],through processing,we obtained the boundary data of the national,state (province)and city levels.
3 Methodology
3.1 Construct topology
The IP-Level topology graph is constructed by extracting each adjacent address from the traceroute traces to form a directed edge.The data provided by the Ripe is obtained through Paris traceroute.We can directly use it to build the topology,however,in the data provided,nonresponsive hops,loops,private [Rekhter,Moskowitz,Karrenberg et al.(1996)] or bogon [Bogonlist (2018)] addresses are inevitable.
In response to the above situations,we have designed algorithm 1 in Fig.1 to deal with them.If a hop is a nonresponsive hop or private address or bogon address,we call it invalid hop,we drop the invalid hop from the trace and divide the trace into two,and keep the new traces owns no less than two hops.
In order to strike a balance between getting more router interface addresses and ensuring the activity of the addresses,the time span of the data we selected to build the topology is one week.For this paper,we use the data from October 15th to 21st,2018,which including 327,160,480 traceroute records.Through the above methods,we got 3,278,306 pairs of links and 754,467 unique router interface addresses.
3.2 Mapping router interfaces to administrative division
Based on the latitude and longitude obtained from the GeoLite,we use the Ray casting algorithm [Shimrat (1962)] to identify which country the router interface address belongs to,then compare the result with the database and discard the inconsistent addresses.
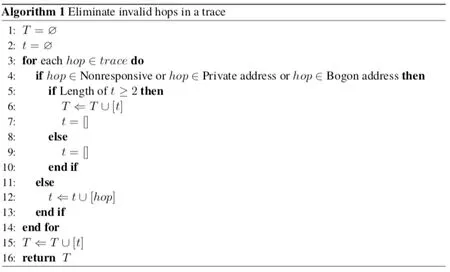
Figure 1:Algorithm to eliminate invalid hops in a trace
4 Topology analysis of continents
4.1 Basic statistic analysis
In this section,we will analyze the IP-level topologies of each continent in detail to evaluate their Internet development level.
Tab.1 compares some basic statistics of the topologies of the six continents.The GDP per capita data [Wikipedia-GDP (2018)] in Tab.2 comes from the Wikipedia in October 2018.
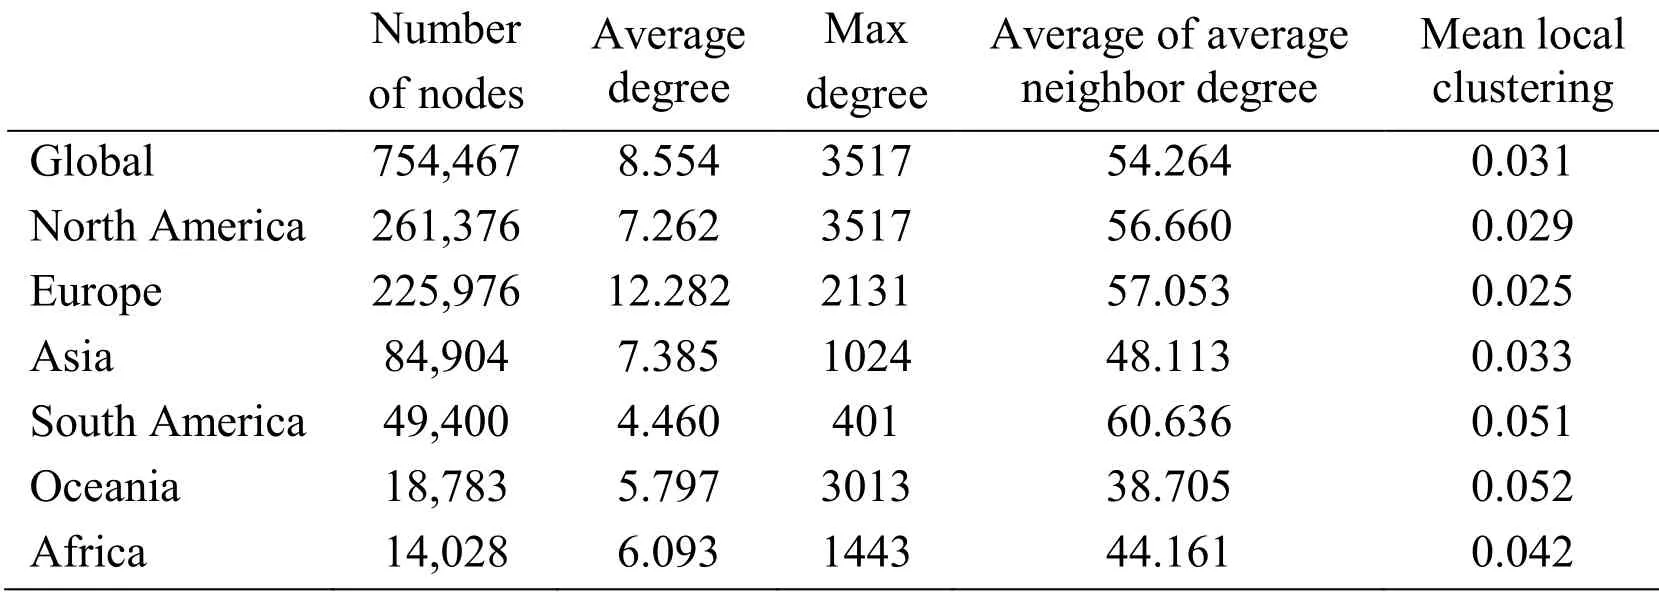
Table 1:Basic statistics of IP-Level topology graphs

Table 2:Capita statistics
The number of nodes in North America,Europe and Asia is in a clear leading position,which is consistent with the current position of these three continents in GDP,routers play a role as a transportation hub in the Internet,the three continents occupy 89.1% nodes of the world’s total,so we think that these three continents play a very important position in the Internet world.The left continents have fewer nodes than these three continents,especially for Africa,the number of nodes compared to the North America’s is only 5.36%,which fully demonstrates that the development of the Internet in the world today is extremely uneven and the future growth potential is still huge.We think the reason of the Oceania owns poor nodes is constrained by its large area compared to its small population,while South America and Africa are affected by their underdeveloped economic.In terms of the number of nodes per capita,North America and Europe are much higher than the world average,South America is also higher than the world average.The ranking order of all the continents is exactly the same as per capita GDP,except for Oceania,therefore,we have reason to believe that the level of development of the Internet is greatly affected by the level of economic development.
The average node degree of Europe is the only continent that higher than the world average,its mean local clustering coefficient is also the lowest among all continents,both the maximum average,node degree and the average of average neighbor node degree are both at a high level,from all the above,we can conclude that the Internet structure in Europe is highly dense and extremely balanced,it is a low centralization structure and has strong ability to resist risks.The Internet structure in North America is similar to Europe,the only difference is its average node degree is far below than the Europe’s.The statistical of network topology in Asia is similar to global topology,what shows that Asia’s Internet structure is relatively balanced but the density is lower than those in Europe and North America.The mean local clustering coefficient of Oceania is the highest,and its maximum node degree ranks 2 in all the continents,but the average node degree is the second-to-last and the average of the average neighbor degree is the last one,far lower than the world average,these statistics reflect that the topology in Oceania is a network with high local density but low in global.All the statistics in South America and Africa are lower than the world average.
Fig.2 is the relationship between the node degree and the average neighbor degree,which reflects the interconnection of nodes of different degrees.From the Fig.2,we can find that in a topology,nodes with low degree tend to connect nodes with high degree,while nodes with high degree are opposite,nodes with degree at intermediate positions are more likely to connect with nodes close to their own degree.Fig.3 is the relationship between the node degree and the local clustering coefficient.It is not difficult to observe that the nodes with low degree usually get high local clustering coefficient,which consistent with the phenomenon appears in Tab.1 that continents with low average node degree usually get high mean local clustering coefficient.
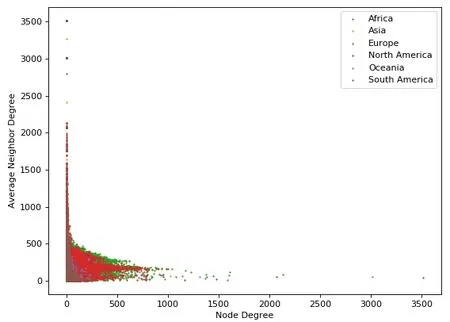
Figure 2:Average neighbor degree
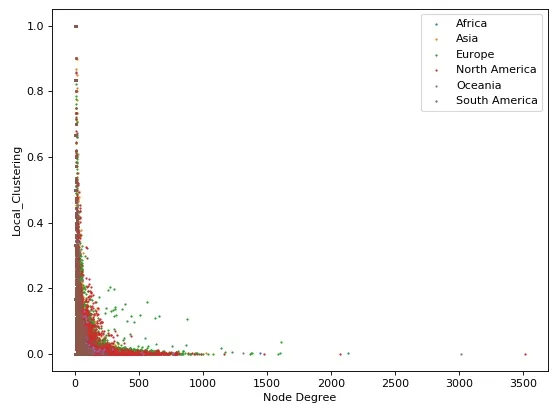
Figure 3:Local clustering coefficient
4.2 Continent connectivity analysis
We analyzed topologies of all the continents above,how do they connect to each other is also a meaningful question,we will analyze it at country level in this part.
If the source and target node of an edge in the global topology graph belong to two different continents,we call this kind of edges as intercontinental-edge and the source of an intercontinental-edge as export-node.Tab.3 presents the countries whose number of export-node ranked top five in continents.Fig.4 shows the number of countries that own export-node of any two continents.Fig.5 shows ratio of the sum of the number of exportnode in the top five countries and the total number of export-node between two continents,we call it as top-5 ratio.The highest top-5 ratio is 99.9%,the ratio of North America to Asia,and the lowest is 54.2%,Asia to Europe.
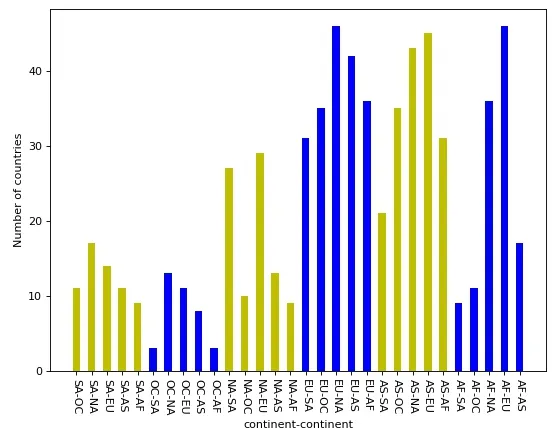
Figure 4:Number of countries that own export-node of any two continents
From Fig.5,we observed that the top-5 ratio from North America,South America and Oceania to any other continents are over 90%,that means the distribution of export- node is very concentrated at the country level,the distribution of export-nodes in Europe,Asia and Africa to other continents is relatively dispersed,we can observe this both form the number of countries and the top-5 ratio,but there are still some high top-5 ratios in these three continents:Europe to South America is 91.5%,Asia to Oceania is 89.5% and Africa to Asia is 93.7%.We think the geographical position of continents and unbalanced development cause for the export-nodes concentrate in few countries,because of the oceans,communication among these continents is mainly through the submarine optical cable,but it is so expensive to build a submarine optical cable that few countries are rich enough to afford it,actually,the United States occupies over 95% export-nodes of North America to any other continents.Asia and Europe are the nearest continents in geographical,many countries have the ability to build optical cable on land,so the top-5 ratio 54.2% among these two continents is the lowest,but Europe to Asia is 72.9%,higher than 54.2% a lot,we think this mainly because the European Integration.
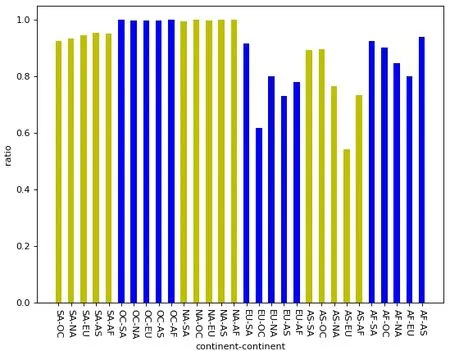
Figure 5:Top-5 ratio of any two continents
5 Conclusions
Researchers need to know the topology graph based on Administrative division to analyze the Internet Structure,companies are interesting with it to improve their services and be more efficiently,governments should know it to protect their information security.Unfortunately,we didnot see previous studies focus on administrative division based topology analyze.In this paper,we first collected traceroute data from the RIPE NCC and then screened out the invalid router interface addresses,with the remain traces we build an IP-Level topology graph and located each node to countries and got the IP-Level topology of continents.Second,we analyzed the basic metric of each continent topology and find that North America owns the most nodes and the node with the highest degree,Europe’s average degree is the highest and mean local clustering is the lowest,South America’s average of average neighbor degree is the highest,we have conclusions that the Internet structure of Europe and North America is the most balanced and highest in density,Oceania owns a concentrated structure,South America and Africa’s Internet development are both at a low level and extreme imbalance,Asia is the medium level similar to the world average.At last,we analyzed the connectivity of continents and find that continents separated by oceans trend to connect each other through fewer countries and get 5 most important export countries in each continent.
 Computers Materials&Continua2019年6期
- Computers Materials&Continua的其它文章
- Development of Cloud Based Air Pollution Information System Using Visualization
- A Learning Based Brain Tumor Detection System
- Shape,Color and Texture Based CBIR System Using Fuzzy Logic Classifier
- LRV:A Tool for Academic Text Visualization to Support the Literature Review Process
- Application of Image Compression to Multiple-Shot Pictures Using Similarity Norms With Three Level Blurring
- On Harmonic and Ev-Degree Molecular Topological Properties of DOX,RTOX and DSL Networks