样本量估计及其在nQuery和SAS软件上的实现*——均数比较(十)
2019-07-10 07:01南方医科大学生物统计学系510515
中国卫生统计 2019年3期
南方医科大学生物统计学系(510515)
高培纯 徐笑寒 徐 莹 陈平雁△
1.2.2.8 基于均差高阶交叉设计的等效性检验
Schuirmann’s(1987)[1],Phillip(1990)[2]和Chen(1997)[3]给出的高阶交叉设计的样本量估计方法是建立在近似服从自由度为vk的t分布上,其检验效能的计算公式为:

(1-55)
在计算样本量时,一般先设定样本量初始值,然后迭代样本量直到所得的检验效能满足条件为止。此时的样本量,即研究所需的样本量。
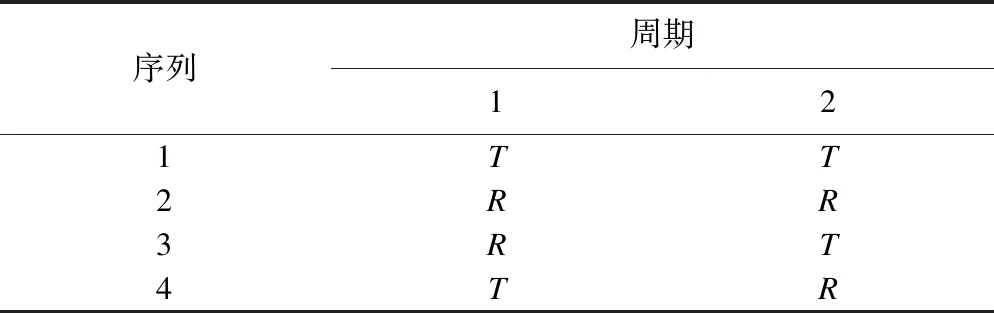
①4×2设计(Balaam's design),v1=4n-3,b1=2
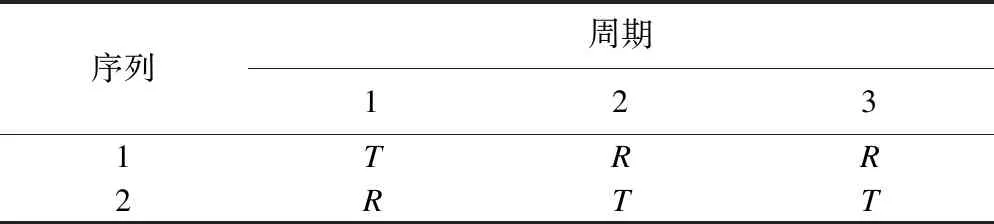
②2×3设计(the two-sequence dual design),v2=4n-4,b2=3/4
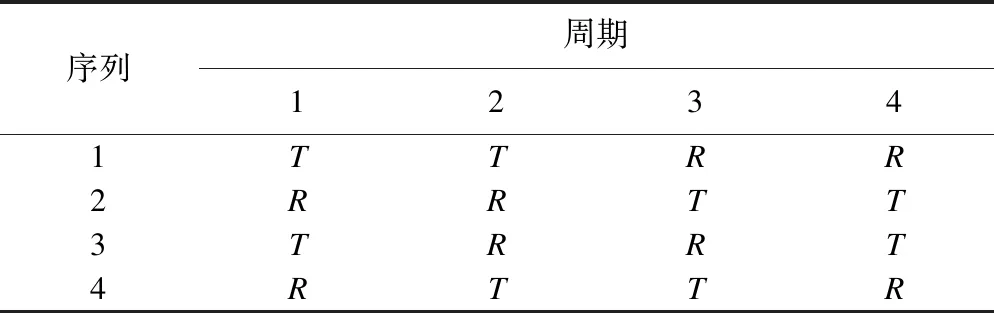
④4×4设计(the four-period with four sequences),v4=12n-5,b4=1/4
【例1-29】欲比较两种降压药物对舒张压的降压效果。根据以往研究,患者使用对照药后平均舒张压为96mmHg,研究者认为使用新药后患者平均舒张压能降到92mmHg。已知均方误为324。新药均值与对照药均值差值置信区间在对照药均值±20%之内可认为两种药物等效,本研究等效性界值设定为-19.2和19.2。试验设计采用2×3设计,检验水准为0.05,欲估计检验效能为90%的样本量。
nQuery Advanced 8.2 实现:设定检验水准为α=0.05,检验效能取90%。由题意知,μ2-μ1=-4,LEL=-19.2,UEL=19.2,Sw=18。在nQuery Advanced 8.2主菜单选择:
Goal:Make conclusion Using:⊙Means
Number of Groups:⊙Two
Analysis Method:⊙Equivalence
方法框中选择:Higher-order Cross-Over Design for Two Means- Equivalence-using Differences
在弹出的样本量计算窗口将各参数键入,如图1-69所示,结果为N=20。

图1-69 nQuery Advanced 8.2 关于例1-29样本量估计的参数设置与计算结果
SAS 9.4软件实现:
proc IML;
start MTE51(Designtype,a,Delta,UEL,LEL,Sw,power);
error=0;
if(Designtype=1|Designtype=2|Designtype=3|Designtype=4)then do;
error=0;end;
else do;error=1;print"error" "Designtype must be 1 or 2 or 3 or 4";end;
if( a>0.2 | a<0) then do;
error=1;print"error" "Test significance level must be in 0-0.2";end;
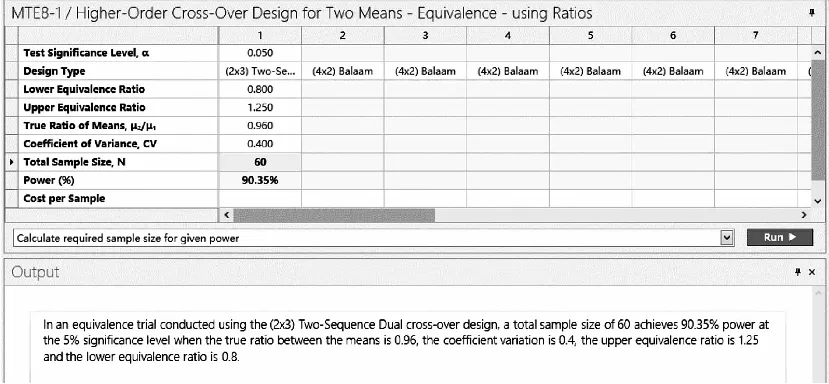
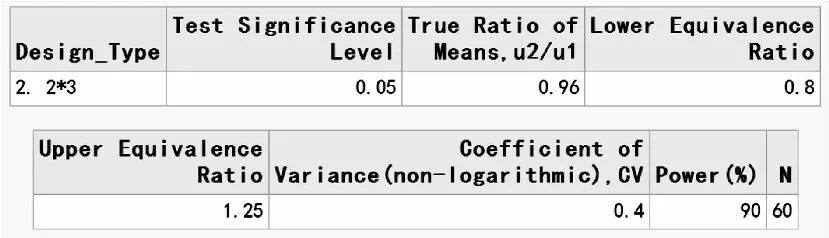
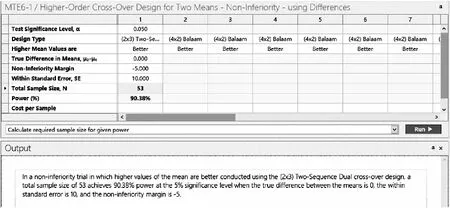
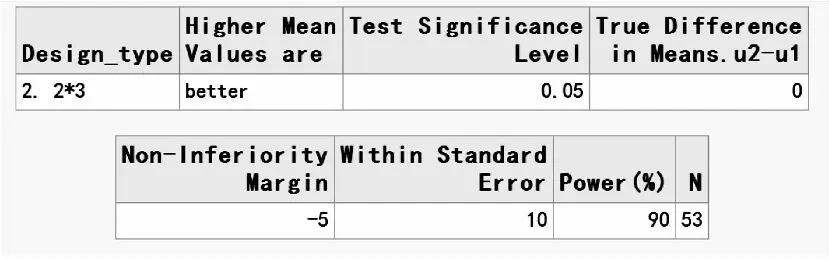
if( Delta>UEL | Delta error=1;print"error" "True difference in means set between upper and lower limits";end; if(UEL<0 ) then do; error=1;print"error" "Upper equivalence limit difference must be>0 ";end; if(LEL>0 ) then do; error=1;print"error" "Lower equivalence limit difference must be<0 ";end; if(Sw<0) then do; error=1;print"error" "Within standard error must be>=0"; end; if(power>100 | power<1) then do; error=1;print"error" "Power(%) must be in 1-100";end; if(error=1) then stop; if(error=0) then do; if(Designtype=1) then do;n=1;b=2;end; if(Designtype=2) then do;n=2;b=3/4;end; if(Designtype=3) then do;n=1;b=11/20;end; if(Designtype=4) then do;n=1;b=1/4;end; do until(pw>=power/100); if(Designtype=1) then do;df=4*n-3;end; if(Designtype=2) then do;df=4*n-4;end; if(Designtype=3) then do;df=6*n-5;end; if(Designtype=4) then do;df=12*n-5;end; tU=(-Delta+UEL)/(Sw*sqrt(b/n))-tinv(1-a,df); tL=tinv(1-a,df)-(Delta-LEL)/(Sw*sqrt(b/n)); pw1=1-probt(tU,df); pw2=1-probt(tL,df); pw=pw2-pw1;n=n+0.01; end; if(Designtype=1) then do;N=ceil((n-0.01)*4);end; if(Designtype=2) then do;N=ceil((n-0.01)*2);end; if(Designtype=3) then do;N=ceil((n-0.01)*2);end; if(Designtype=4) then do;N=ceil((n-0.01)*4);end; if(Designtype=1) then do;Design_type="1. 4*2";end; if(Designtype=2) then do;Design_type="2. 2*3";end; if(Designtype=3) then do;Design_type="3. 2*4";end; if(Designtype=4) then do;Design_type="4. 4*4";end; print Design_type a[label="Test Significance Level"] Delta[label="True Difference in Means.u2-u1"] LEL[label="Lower Equivalence Limit"] UEL[label="Upper Equivalence Limit"] Sw[label="Within Standard Error(Sw)"] power[label="Power(%)"] N[label="N"];end; finish MTE51; run MTE51(2,0.05,-4,19.2,-19.2,18,90); quit; SAS 9.4运行结果: 图1-70 SAS 9.4关于例1-29样本量估计的参数设置与计算结果 1.2.2.9 基于比值高阶交叉设计的等效性检验 Schuirmann’s (1987)[1],Phillip(1990)[2]和Chen(1997)[3]给出的高阶交叉设计的样本量估计方法是建立在近似服从自由度为vk的t分布上,其检验效能的计算公式为: (1-56) 在计算样本量时,一般先设定样本量初始值,然后迭代样本量直到所得的检验效能满足条件为止。此时的样本量,即研究所需的样本量。 【例1-30】某公司欲验证新开工厂生产的药物与旧工厂生产的药物是否等效。根据以往研究数据,旧工厂生产药物CV为0.4。假定新旧工厂生产药物均值比值为0.96。根据指导原则,新工厂生产的药物与旧工厂生产的药物的均值比不低于0.8且不高于1.25可认为等效。若采用2×3设计,试估计检验效能为90%的样本量。 nQuery Advanced 8.2实现:设定检验水准为α=0.05,检验效能取90%。由题意知,μ2/μ1=0.96,LER=0.8,UER=1.25,CV=0.4。在nQuery Advanced 8.2主菜单选择: 方法框中选择:Higher-order Cross-Over Design for Two Means- Equivalence-using Ratio 在弹出的样本量计算窗口将各参数键入,如图1-71所示,结果为N=60。 图1-71 nQuery Advanced 8.2 关于例1-30样本量估计的参数设置与计算结果 SAS9.4软件实现: proc IML; start MTE81(Designtype,a,Ratio,UER,LER,CV,power); error=0; if(Designtype=1|Designtype=2|Designtype=3|Designtype=4)then do; error=0;end; else do; error=1;print"error" "Designtype must be 1 or 2 or 3 or 4";end; if( a>0.2 | a<0) then do; error=1;print"error" "Test significance level must be in 0-0.2";end; if( Ratio>UER | Ratio error=1;print"error" "True ratio of means set between upper and lower equivalence ratio limits";end; if( UER<1 ) then do; error=1;print"error" "Upper equivalence limit ratio must be>= 1";end; if( LER>= 1 | LER<= 0) then do; error=1;print"error" "Lower equivalence limit ratio must be in 0-1";end; if( Ratio>UER | Ratio error=1;print"error" "Ture ratio must be set between Upper and Lower equivalence ratio limit";end; if( CV<0) then do; error=1;print"error" "Coefficient of variance must be>= 0";end; if(power>100 | power<1) then do; error=1;print"error" "Power(%) must be in 1 - 100";end; if(error=1) then stop; if(error=0) then do; if(Designtype=1) then do;n=1;b=2;end; if(Designtype=2) then do;n=2;b=3/4;end; if(Designtype=3) then do;n=1;b=11/20;end; if(Designtype=4) then do;n=1;b=1/4;end; CVm=sqrt(log(CV**2+1)); do until(pw>=power/100); if(Designtype=1) then do;df=4*n-3;end; if(Designtype=2) then do;df=4*n-4;end; if(Designtype=3) then do;df=6*n-5;end; if(Designtype=4) then do;df=12*n-5;end; tU=(-abs(log(Ratio))+log(UER))/(CVm*sqrt(b/n))-tinv(1-a,df); tL=tinv(1-a,df)-(abs(log(Ratio))-log(LER))/(CVm*sqrt(b/n)); pw1=1-probt(tU,df); pw2=1-probt(tL,df); pw=pw2-pw1;n=n+0.01; end; if(Designtype=1) then do;N=ceil((n-0.01)*4);end; if(Designtype=2) then do;N=ceil((n-0.01)*2);end; if(Designtype=3) then do;N=ceil((n-0.01)*2);end; if(Designtype=4) then do;N=ceil((n-0.01)*4);end; if(Designtype=1) then do;Design_Type="1.4*2";end; if(Designtype=2) then do;Design_Type="2.2*3";end; if(Designtype=3) then do;Design_Type="3.2*4";end; if(Designtype=4) then do;Design_Type="4.4*4";end; print Design_Type a[label="Test Significance Level"] Ratio[label="True Ratio of Means,u2/u1"] LER[label="Lower Equivalence Ratio"] UER[label="Upper Equivalence Ratio"] CV[label="Coefficient of Variance(non-logarithmic),CV"] power[label="Power(%)"] N[label="N"];end; finish MTE81; run MTE81(2,0.05,0.96,1.25,0.8,0.4,90); quit; SAS运行结果; 图1-72 SAS 9.4 关于例1-30样本量估计的参数设置与计算结果 1.2.2.10 基于均差高阶交叉设计的非劣效性检验 Chen(1997)[3]和Chow and Liu (2009)[4]给出的高阶交叉设计的样本量估计方法是建立在近似服从自由度为vk的t分布上,当指标为高优指标时,其检验效能计算公式为: (1-57) 当指标为低优指标时,对应的检验效能计算公式为: (1-58) 在计算样本量时,一般先设定样本量初始值,然后迭代样本量直到所得的检验效能满足条件为止。此时的样本量,即研究所需的样本量。 【例1-31】某公司欲验证一种治疗风湿病的仿制药非劣于标准药,拟采用2×3设计。研究者决定将非劣界值设置为-5。根据以往类似研究,已知均方误为100。假设仿制药与标准药真实差值为0。检验水准设置为0.05,试估计检验效能为90%所需的样本量。 nQuery Advanced 8.2 实现:设定检验水准为α=0.05,检验效能取90%。由题意知,μ2-μ1=0,NIM=-5,Sw=10。在nQuery Advanced 8.2主菜单选择: 方法框中选择:Higher-order Cross-Over Design for Two Means- Non-Inferiority-using Differences 在弹出的样本量计算窗口将各参数键入,如图1-73所示,结果为N=53。 图1-73 nQuery Advanced 8.2 关于例1-31样本量估计的参数设置与计算结果 SAS 9.4软件实现: proc IML; start MTE61(Designtype,Better,a,Delta,NIM,Sw,power); error=0; if(Designtype=1|Designtype=2|Designtype=3|Designtype=4)then do; error=0;end; else do; error=1;print"error" "Designtype must be 1 or 2 or 3 or 4";end; if( a>0.2 | a<0) then do; error=1;print"error" "Test significance level must be in 0-0.2";end; if( Better=1 | Better=0)then do; error=0;end; else do; error=1;print"error" "Higher means better(1)/worse(0)";end; if( Better=1 ) then do; if( Delta<= -abs(NIM))then do; error=1;print"error" "True difference in means must>Non-Inferiority margin if higher means better";end; end; if( Better=0 ) then do; if( Delta>= abs(NIM) )then do; error=1;print"error" "True difference in means must end; if(Sw<0) then do; error=1;print"error" "Within standard error must be>=0";end; if(power>100 | power<1) then do; error=1;print"error" "Power(%) must be in 1-100";end; if(error=1) then stop; if(error=0) then do; if(Designtype=1) then do;n=1;b=2;end; if(Designtype=2) then do;n=2;b=3/4;end; if(Designtype=3) then do;n=1;b=11/20;end; if(Designtype=4) then do;n=1;b=1/4;end; if(Better=1) then do; do until(pw>=power/100); if(Designtype=1) then do;df=4*n-3;end; if(Designtype=2) then do;df=4*n-4;end; if(Designtype=3) then do;df=6*n-5;end; if(Designtype=4) then do;df=12*n-5;end; t=(Delta+abs(NIM))/(Sw*sqrt(b/n))-tinv(1-a,df); pw=probt(t,df);n=n+0.01; end; end; if(Better=0) then do; do until(pw>=power/100); if(Designtype=1) then do;df=4*n-3;end; if(Designtype=2) then do;df=4*n-4;end; if(Designtype=3) then do;df=6*n-5;end; if(Designtype=4) then do;df=12*n-5;end; t=tinv(1-a,df)-(-Delta+abs(NIM))/(Sw*sqrt(b/n)); pw=probt(t,df);n=n+0.01; end; end; if(Designtype=1) then do;N=ceil((n-0.01)*4);end; if(Designtype=2) then do;N=ceil((n-0.01)*2);end; if(Designtype=3) then do;N=ceil((n-0.01)*2);end; if(Designtype=4) then do;N=ceil((n-0.01)*4);end; if(Designtype=1) then do;Design_type="1. 4*2";end; if(Designtype=2) then do;Design_type="2. 2*3";end; if(Designtype=3) then do;Design_type="3. 2*4";end; if(Designtype=4) then do;Design_type="4. 4*4";end; if better=1 then Better_="better";else Better_="worse"; print Design_type Better_[label="Higher Mean Values are"] a[label="Test Significance Level"] Delta[label="True Difference in Means.u2-u1"] NIM[label="Non-Inferiority Margin"] Sw[label="Within Standard Error"] power[label="Power(%)"] N[label="N"]; end; finish MTE61; run MTE61(2,1,0.05,0,-5,10,90); quit; SAS运行结果: 图1-74 SAS 9.4 关于例1-31样本量估计的参数设置与计算结果


 猜你喜欢
心理学报(2022年10期)2022-10-12福建农林大学学报(自然科学版)(2022年5期)2022-10-08内蒙古统计(2021年4期)2021-12-06哈尔滨轴承(2020年1期)2020-11-03北京航空航天大学学报(2019年9期)2019-10-26福建基础教育研究(2019年7期)2019-05-28中国医学伦理学(2019年6期)2019-01-16科技与创新(2017年3期)2017-03-17北京航空航天大学学报(2016年7期)2016-11-16电脑知识与技术(2016年22期)2016-10-31
猜你喜欢
心理学报(2022年10期)2022-10-12福建农林大学学报(自然科学版)(2022年5期)2022-10-08内蒙古统计(2021年4期)2021-12-06哈尔滨轴承(2020年1期)2020-11-03北京航空航天大学学报(2019年9期)2019-10-26福建基础教育研究(2019年7期)2019-05-28中国医学伦理学(2019年6期)2019-01-16科技与创新(2017年3期)2017-03-17北京航空航天大学学报(2016年7期)2016-11-16电脑知识与技术(2016年22期)2016-10-31