
Meta-analysis of QTL for Fusarium head blight resistance in Chinese wheat landraces
2019-12-20 06:40JinCaiShanWangZhenqiSuTaoLiXianghuiZhangGuihuaBai
The Crop Journal 2019年6期
Jin Cai,Shan Wang, Zhenqi Su,c, Tao Li,d, Xianghui Zhang,e,Guihua Bai,f,*
aInstitute of Germplasm Resources and Biotechnology and Jiangsu Provincial Key Laboratory of Agrobiology,Jiangsu Academy of Agricultural Sciences,Nanjing 210014,Jiangsu,China
bDepartment of Agronomy,Kansas State University,Manhattan,KS 66506,USA
cInstitute of Cereal and Oil Crops,Hebei Academy of Agricultural and Forestry Sciences,Shijiazhuang 050035,Hebei,China
dJiangsu Provincial Key Laboratory of Crop Genetics and Physiology,Yangzhou University,Yangzhou 225009,Jiangsu,China
eCollege of Plant Science,Jilin University,Changchun 130062,Jilin,China
fUnited State Department of Agriculture-Agricultural Research Service, Hard Winter Wheat Genetics Research Unit, Manhattan, KS 66506,USA
Keywords:Genotyping-by-sequencing FHB resistance KASP Meta-analysis of QTL Single nucleotide polymorphism Triticum aestivum
ABSTRACT Epidemics of Fusarium head blight (FHB), incited by Fusarium graminearum Schwabe, in wheat cause significant reductions in grain yield and quality. Numerous quantitative trait loci (QTL) for FHB resistance have been reported from Chinese sources. However, the relationships among QTL from different landraces have not been characterized. We earlier mapped QTL for FHB resistance using low-density maps developed from five recombinant inbred line (RIL) populations involving Chinese landraces ‘Haiyanzhong' (HYZ),‘Wangshuibai' (WSB), ‘Baishanyuehuang' (BSYH), ‘Huangfangzhu' (HFZ), and‘Huangcandou' (HCD) as FHB resistant parents. In this study, we used maps of single nucleotide polymorphisms(SNP)developed from the five populations and identified 31 QTL on 16 chromosomes;10 QTL were new.We constructed a consensus map and identified six meta-QTL(MQTL)and SNP within the MQTL regions using meta-analysis.Two of the MQTL were on chromosome 3BS (3BSd and 3BSc), and one on each of chromosomes 3A, 2D, 3D,and 4D. Twenty-two SNP closely linked to MQTL were converted into breeder friendly Kompetitive Allele Specific Polymerase Chain Reaction (KASP) assays, which should be useful for marker-assisted selection in breeding programs.
1. Introduction
Fusarium head blight (FHB), mainly caused by Fusarium graminearum Schwabe,is one of the most destructive diseases in wheat(Triticum aestivum L.)and other cereal crops[1,2].FHB is a serious threat to worldwide wheat production causing significant yield losses, poor grain quality and mycotoxin contamination [1,3]. Although much effort has been made in managing FHB in past decades, FHB and deoxynevalenol(DON)continue to cause significant economic losses in the U.S. and many other countries [4]. FHB damage can be partially reduced by fungicides and other cultural practices, but FHB-resistant cultivars are a more effective and environmentally safe strategy to minimize FHB damage in wheat production.
To date, >50 quantitative trait loci (QTL) associated with FHB resistance have been reported on all 21 wheat chromosomes [5-7]. Several QTL have been repeatedly mapped on chromosomes 3BS,5AS,6BS,3A,4B,2D,1B,7A,and 5B[6],and seven have been formally designated with gene names from Fhb1 to Fhb7[8-15].
Meta-analysis of QTL has been used to estimate the confidence intervals (CI) of QTL for many traits in many crops [6,16-20]. Löffler et al. [16]summarized QTL mapping results from 30 wheat populations and reported 19 MQTL on 12 chromosomes,and Liu et al.[6]analyzed QTL data from 45 studies and reported the same number of repeatable QTL.However,those meta-analyses were based on QTL previously identified using low-density maps.A high-density consensus map is critical to the identification of additional QTL and markers tightly linked to those QTL for marker-assisted breeding. Genotyping-by-sequencing (GBS) is an effective marker platform for discovery of single nucleotide polymorphism (SNP) markers in diverse species [21], and is thus a powerful platform for construction of high-density linkage maps for QTL analysis. Meta-analysis using a new highdensity consensus map developed from different populations will identify more precise positions for MQTL, and better markers for marker-assisted selection (MAS) of those QTL in breeding programs.
FHB resistant germplasms have been identified in U.S.A.,Asia, Europe, and South America [1]. Chinese sources,especially Chinese landraces, showed a high level of FHB resistance [1,22,23]and QTL for FHB resistance were previously mapped in some landraces including Haiyanzhong(HYZ) [24], Huangcandou (HCD) [25], Baishanyuehuang(BSYH) [26], Huangfangzhu (HFZ) [27], and Wangshuibai(WSB) [28]. However, the relationships among QTL identified in different landraces have not been established. The objectives of this study were to (1) remap QTL for FHB resistance using newly developed SNP linkage maps for the five populations developed from these Chinese resistant landraces, (2) construct a consensus map by combined analysis of the newly developed maps, (3) conduct metaanalysis to identify MQTL for FHB resistance, and (4) convert GBS-SNP closely linked to the MQTL into Kompetitive Allele Specific Polymerase Chain Reaction(KASP)assays for MAS.
2. Materials and methods
2.1. Plant materials and FHB evaluation
Five recombinant inbred line (RIL) populations were developed by crossing Chinese landraces HYZ, HCD, BSYH, HFZ,and WSB, to FHB susceptible U.S. wheat cultivars, Jagger or Wheaton (Table 1). Type II FHB resistance (resistance to FHB spread within a spike) in those populations was evaluated in both the field and greenhouse at Kansas State University as previously described [25-28]. Phenotypic data from previous studies[25-28]were used for re-analysis of QTL except for the HYZ × Wheaton population that was evaluated for type II FHB resistance in spring and autumn 2012, and spring 2013. The method and experimental design used in phenotyping this population was as described in Cai and Bai [25]. Line means from each experiment were used for individual QTL analysis and line means over all experiments in each population were used for both individual and meta-QTL analyses.
2.2. Genotyping-by-sequencing library construction and SNP analysis
Genomic DNA was isolated using a modified CTAB protocol[29]. GBS libraries were generated for all five RIL populations as previously described [21]. In brief, DNA samples were digested with HF-PstI and MspI restriction enzymes (New England BioLabs Inc., Ipswich, MA, USA), and ligated to barcoded adaptors and a Y common adaptor using T4 ligase(New England BioLabs Inc.).Ligated products were pooled and purified using a QIAquick PCR Purification Kit (Qiagen Inc.,Valencia, CA, USA). Primers complementary to both adaptors were used for PCR, products of which were again purified using a QIAquick PCR Purification Kit and size-selected for 250-300 bp fragments in an E-gel system (Life Technologies Inc., Carlsbad, CA). DNA concentration was estimated in aQubit 2.0 fluorometer using a Qubit dsDNA HS Assay Kit (Life Technologies Inc.). The size-selected library was sequenced on an Ion Proton system (Life Technologies Inc.). GBS data were analyzed using a Universal Network Enabled Analysis Kit (UNEAK) pipeline, a reference-independent pipeline of TASSEL [21,30]. Poly-As were added to these short read sequences to ensure all reads were 64 bp.

Table 1-Previously and currently mapped QTL for type II Fusarium head blight (FHB) resistance in the five mapping populations involving Chinese landraces Haiyanzhong (HYZ), Wangshuibai (WSB), Baishanyuehuang (BSYH),Huangfangzhu (HFZ),and Huangcandou (HCD)as resistant parents.
2.3. Construction of genetic linkage maps
Linkage maps were constructed using both SSR and GBS-SNP markers. Genetic distance was calculated using the Kosambi mapping function [31]and ‘regression' mapping algorithm in JoinMap version 4.0 [32]. QTL for low FHB severity were identified using Inclusive Composite Interval Mapping (ICIM)in QTL IciMapping V4.0 [33]. Markers in chromosomes with QTL mapped in two or more populations were used to construct a consensus map. The ‘Regression' mapping algorithm was used for map integration. Generally, ‘weighted least square'was used to merge multiple genetic maps into a single consensus map by investigating heterogeneity of recombination rates between different populations [32]. The consensus map and comparative linkage maps with common markers from different studies were displayed using MapChart [34].
2.4. QTL projection and meta-analysis
QTL from different populations were projected onto the consensus maps by referring the initial QTL positions, CI,and r2values from individual maps using QTLProj command in MetaQTL V1.0 [35]. The Gaussian mixture model was used to fit the distribution of the ‘projected QTL' onto a chromosome, and to cluster them to determine the number of QTL underlying the distribution of the observed QTL using the QTLClust command. The predicted MQTL positions and CI were extracted using the QTLClustInfo command in Meta-QTL V1.0 [35]. The final consensus map with MQTL at 95% CI was drawn using MapChart[34].
2.5. Conversion of GBS-SNP into KASP assays and validation of the KASP assays on a germplasm panel
Accuracy of some GBS-SNP data was validated using KASP assays designed from their corresponding GBS read sequences harboring the SNP that were mapped to MQTL regions (Table S1). KASP assay was performed in a 6 μL PCR mix that consisted of 2.9 μL of reaction mix (LGC Genomics,Beverly,MA,USA),0.1 μL of primer assay mix,and 3 μL of DNA at a concentration of 15 ng μL-1.PCR were identified following the manufacturer's instructions (LGC Genomics, 2007) using an ABI 7900HT Real-Time PCR System(Life Technology,Grand Island,NY,USA).KASP-SNP were compared to corresponding GBS-SNP to determine the number of mismatches. The converted KASP-SNP were also validated on a population of 96 U.S. elite breeding lines and cultivars that were predominantly susceptible to FHB (Table S2). The allele frequency of KASP-SNP in the association mapping panel was analyzed to evaluate usefulness of those KASP-SNP in marker-assisted selection.
3. Results
3.1. GBS-SNP linkage maps
GBS reads from all five populations were combined for SNP calling. A total of 17,277 GBS-SNP was identified with <50%missing data; 3429 GBS-SNP that had <20% missing data across the five populations were used for construction of the consensus map and MQTL analysis. The SNP ranged from 1945 to 2060 in individual populations with an average of 1977 SNP per population (Table 2). After removal of co-segregating markers, the numbers of mapped markers per population ranged from 1604 in the WSB × Wheaton population to 1776 in the HFZ × Wheaton population. The marker density was highest in the HFZ × Wheaton population(1.14 markers cM-1),and lowest in the HCD × Jagger population (0.67 markers cM-1). The HYZ × Wheaton population had the most markers in the A genome,but all four other populations had the most markers in the B genome(Table 2).Thus,overall the B genome(45.5%) had the most markers and the D genome had the fewest(15.5%).
3.2. QTL for FHB resistance
Among 31 QTL identified from the five RIL populations, 19 were mapped independently on 16 chromosomes(1A,2B,2D,3A, 3B, 3D, 4A, 4B, 4D, 5A, 5D, 6A, 6B, 6D, 7A, and 7D), with eight mapped in at least two populations and 11 in singlepopulations (Tables 1, S3). The QTL on chromosome arm 3AS(3AS QTL)and at the distal end of chromosome 3BS(3BSd QTL)were mapped in four of the five populations, with the populations BSYH × Wheaton, HCD × Jagger, and HFZ ×Wheaton carrying both QTL,and WSB × Wheaton and HYZ ×Wheaton carrying one of the QTL(Fig.1,Table 1).The QTL on chromosomes 1A,2D,3D,4B,4D,and in the centromere region of chromosome arm 3BS(3BSc QTL)were each mapped in two populations,with the 3BSc QTL identified in the BSYH×Jagger and HFZ × Wheaton populations, the 3D QTL in the HFZ ×Wheaton and WSB × Wheaton populations, the 2D QTL in the HCD × Jagger and HYZ × Wheaton populations; the 4D QTL in the BSYH×Wheaton and HYZ × Wheaton populations,the 1A QTL in the HCD × Jagger and HFZ × Wheaton populations,and the 4B QTL in HYZ × Wheaton and HFZ × Wheaton populations (Fig. 1, Table 1). These eight QTL that were mapped in at least two populations were used for further MQTL analysis.
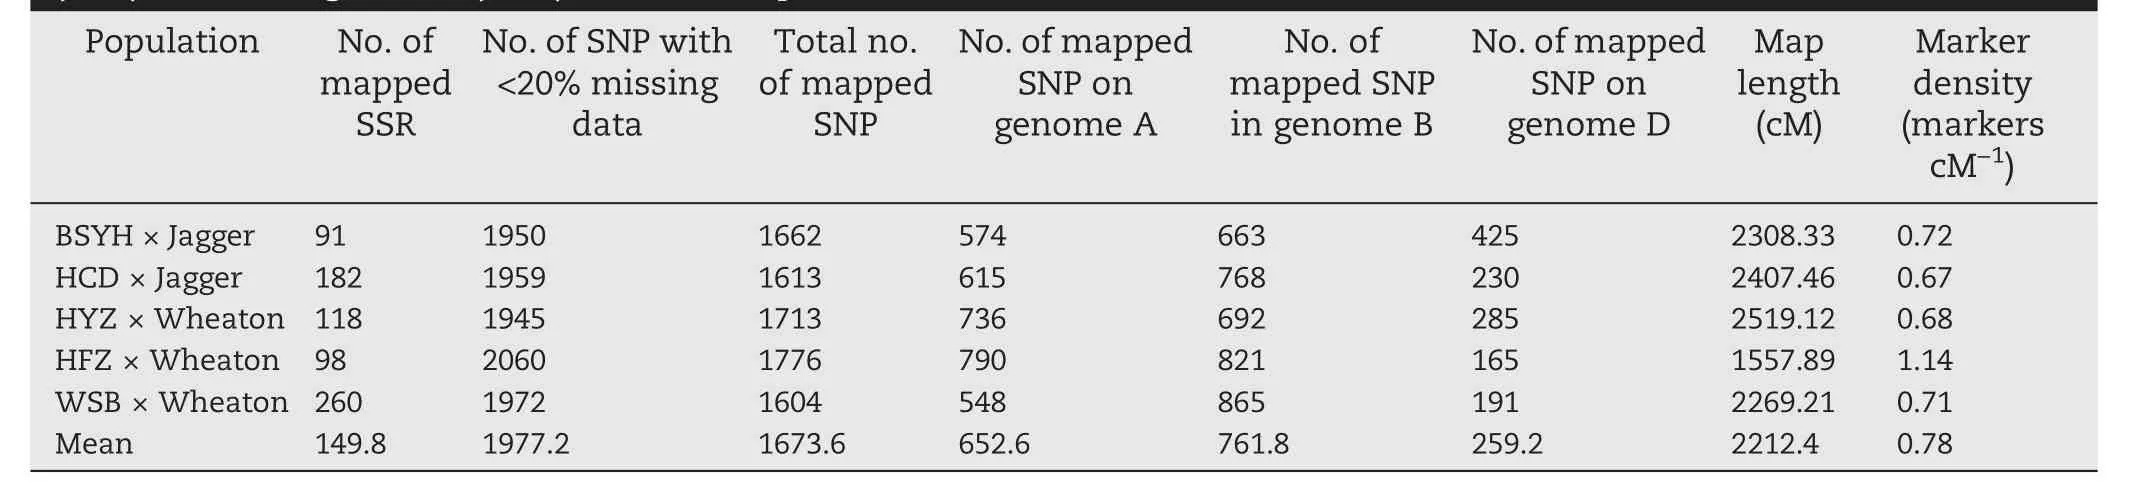
Table 2-Numbers of SSR or STS markers, from previous maps and newly added SNP used for construction of individual maps for the five populations involving Haiyanzhong(HYZ),Wangshuibai(WSB),Baishanyuehuang(BSYH),Huangfangzhu(HFZ),and Huangcandou(HCD)as resistant parents.
3.3. Identification of MQTL for FHB resistance using a consensus map
Consensus maps were constructed for chromosomes 1A, 3A,3BS, 4B, 2D, 3D, and 4D using the marker data from all five populations to conduct MQTL analysis. The consensus maps consisted of seven linkage groups with genetic lengths ranging from 31.98 (4D) to 184.90 (3A) cM per linkage group(Fig. 1). The marker density for individual linkage groups was the highest for chromosome 3BS (1.85 markers cM-1) and the lowest for chromosome 2D(0.48 markers cM-1).Meta-analysis of the eight repeatable QTL resulted in six MQTL (Fig. 2). QTL on chromosomes 1A and 4B were not clustered into a MQTL.The confidence intervals of the mapped MQTL ranged from 0.33 cM for the 3BSc QTL to 3.50 cM for the 2D QTL with an average CI of 1.90 cM (Table 3). The mapped MQTL had significantly narrower CI than the mean CI for QTL identified in the individual populations(Table 3).
Six individual QTL on chromosome 3BS in four of the five populations were clustered into two MQTL (3BSd and 3BSc).The peak positions of initially mapped 3BSd QTL in the four populations ranged from 19.6 cM in the HFZ population to 22.2 cM in the HCD population distributed near the MQTL position (21.6 cM). The 3BSd MQTL had a lower CI of 3.3 cM than those of the individual populations that ranged from 4.4 for WSB to 10.4 cM for HCD(Table 3).Seven markers,including one SSR (Xbarc133), one STS (Xumn10) and five GBS-SNP(GBS1663, GBS1100, GBS0800, GBS2377, and GBS1989), mapped within the CI of the 3BSd MQTL (Fig. 2). The other 3BS MQTL clustered at 80.4 cM near the centromeric region of 3BS and had the narrowest CI(0.53 cM)among all MQTL(Table 3).The two initial QTL were located at 79.4 and 80.7 cM with CI of 4.7 and 2.6 cM, respectively (Table 3). Six GBS-SNP (GBS2385,GBS0672, GBS0725, GBS2882, GBS2285, and GBS2312) mapped within the 3BSc MQTL region (Fig. 2) covered a 120.3 Mb physical distance based on the Chinese Spring reference genome(IWGSC RefSeq v1.0)(Table 3).
QTL from four populations clustered into the 3AS MQTL at 113.8 cM with a CI of 1.4 cM that was equivalent to 4.7 Mb(Table 3). Three of the initial four QTL mapped close to the MQTL position, and the other QTL in WSB was located 6.1 cM away from the 3AS MQTL region, but still aggregated to the 3AS MQTL due to the relatively broad CI (11.8 cM). Seven markers (Xgwm2, Xwmc651, Xwmc527, Xgwm674, Xbarc306,GBS2002, and GBS0782) mapped within the MQTL region, and four other GBS-SNP(GBS3080,GBS2600,GBS0940,and GBS0340)mapped close to the 3AS MQTL region (<2 cM away). Those SNP were used for conversion to KASP assays(Table S1).
QTL in two populations were clustered to the MQTL at 31.2 cM on the chromosome arm 3DL with a narrow CI of 1.6 cM or 1.4 Mb(Table 3).The individual QTL that formed the 3D MQTL had much larger CI than that for the MQTL with 7.6 cM for WSB and 6.5 cM for HFZ (Table 3, Fig. 2). One SSR marker(Xgwm114)and three GBS-SNP(GBS1480,GBS2389,and GBS1203) were located within the MQTL region(Fig.2).
Two QTL clustered into the MQTL at 49.8 cM on chromosome 2D, with a CI of 3.50 cM or ~3.8 Mb (Table 3). The initial QTL that formed 2D MQTL were located at 46.0 cM in HYZ and 51.1 cM in HCD with CIs of 14.46 and 8.5 cM,respectively(Fig.2, Table 3). The individual QTL mapped ~5.0 cM apart in the two populations, but both were aggregated to the 2D MQTL because of the broad CI in HYZ. Five GBS-SNP (GBS2554,GBS0096, GBS0097,GBS1487,and GBS1572) mapped within the MQTL region(Fig. 2,Table 3).
Two QTL were clustered to an MQTL at 16.9 cM on chromosome 4D,with a CI of 1.4 cM(Table 3).The initial QTL that formed the 4D MQTL were from HYZ and BSYH, and located at 11.3 cM and 18.0 cM with CIs of 5.1 and 11.6 cM,respectively (Fig. 2, Table 3). The initial QTL from the two populations were ~6.0 cM apart, but aggregated to the 4D MQTL. Five SSR markers (Xcfd23, Xbarc288, Xwmc52, Xbarc98,Xgwm194)were located within the 4D MQTL region(Fig.2),but no GBS-SNP was mapped in the region.
3.4. Conversion and validation of KASP assays
GBS-SNP mapping within all the MQTL regions were selected for conversion to KASP assays to fill up the missing data of the GBS-SNP and to verify the accuracy of GBS-SNP data in those MQTL regions. Twenty six KASP assays were designed using the corresponding GBS tag sequences that harbored the SNP in the MQTL regions and 22 KASP SNP segregated in at least one of the five populations(Table S1,Fig.3).Twenty-one were remapped to the five corresponding MQTL regions with five SNP for each of the MQTL 3BSd, 3BSc, and 3A, one for MQTL 2D,three for MQTL 3D and two for MQTL 4D.Those KASP-SNP had identical allele calls with their corresponding GBS-SNP across RIL in the corresponding populations. Only one KASP marker mapped outside the MQTL region.
Eleven of the 22 KASP assays (three on 3BSd, one each on 2D and 3A,and two each for MQTL on 3BSc,3DL,and 4D)were validated in the association mapping (AM) panel of 96 U.S.elite breeding lines and cultivars (Table S2, Fig. 3). KASP-SNP GBS1836 showed almost equal clusters for the two alleles,whereas seven KASPs developed from GBS1989, GBS2882,GBS2285, GBS1487, GBS2600, GBS0781, and GBS2377 showed unequal clusters with more lines in the ‘Wheaton' or ‘Jagger'allele clusters. Three KASP-SNP (GBS1100, GBS2710 and GBS3012) showed unequal clusters with fewer lines in the‘Wheaton'or‘Jagger'allele cluster.KASP GBS0781 on 3DL(Fig.3-d) had only five lines in the Chinese landrace cluster with most lines in either the ‘Wheaton' or ‘Jagger' clusters in the AM population.
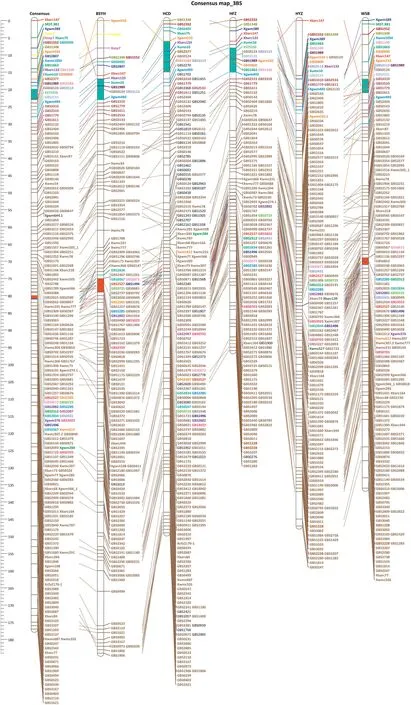
Fig.1-Consensus and individual maps for chromosomes 3BS,3A,2D,3D,and 4D constructed using the SSR and SNP markers mapped in the five recombinant inbred populations that involved Haiyanzhong(HYZ),Wangshuibai(WSB),Baishanyuehuang(BSYH),Huangfangzhu(HFZ),and Huangcandou(HCD)as one parent.Markers within or close to MQTL regions(blue bars)were labeled with distinctive colors that can be traced across populations.
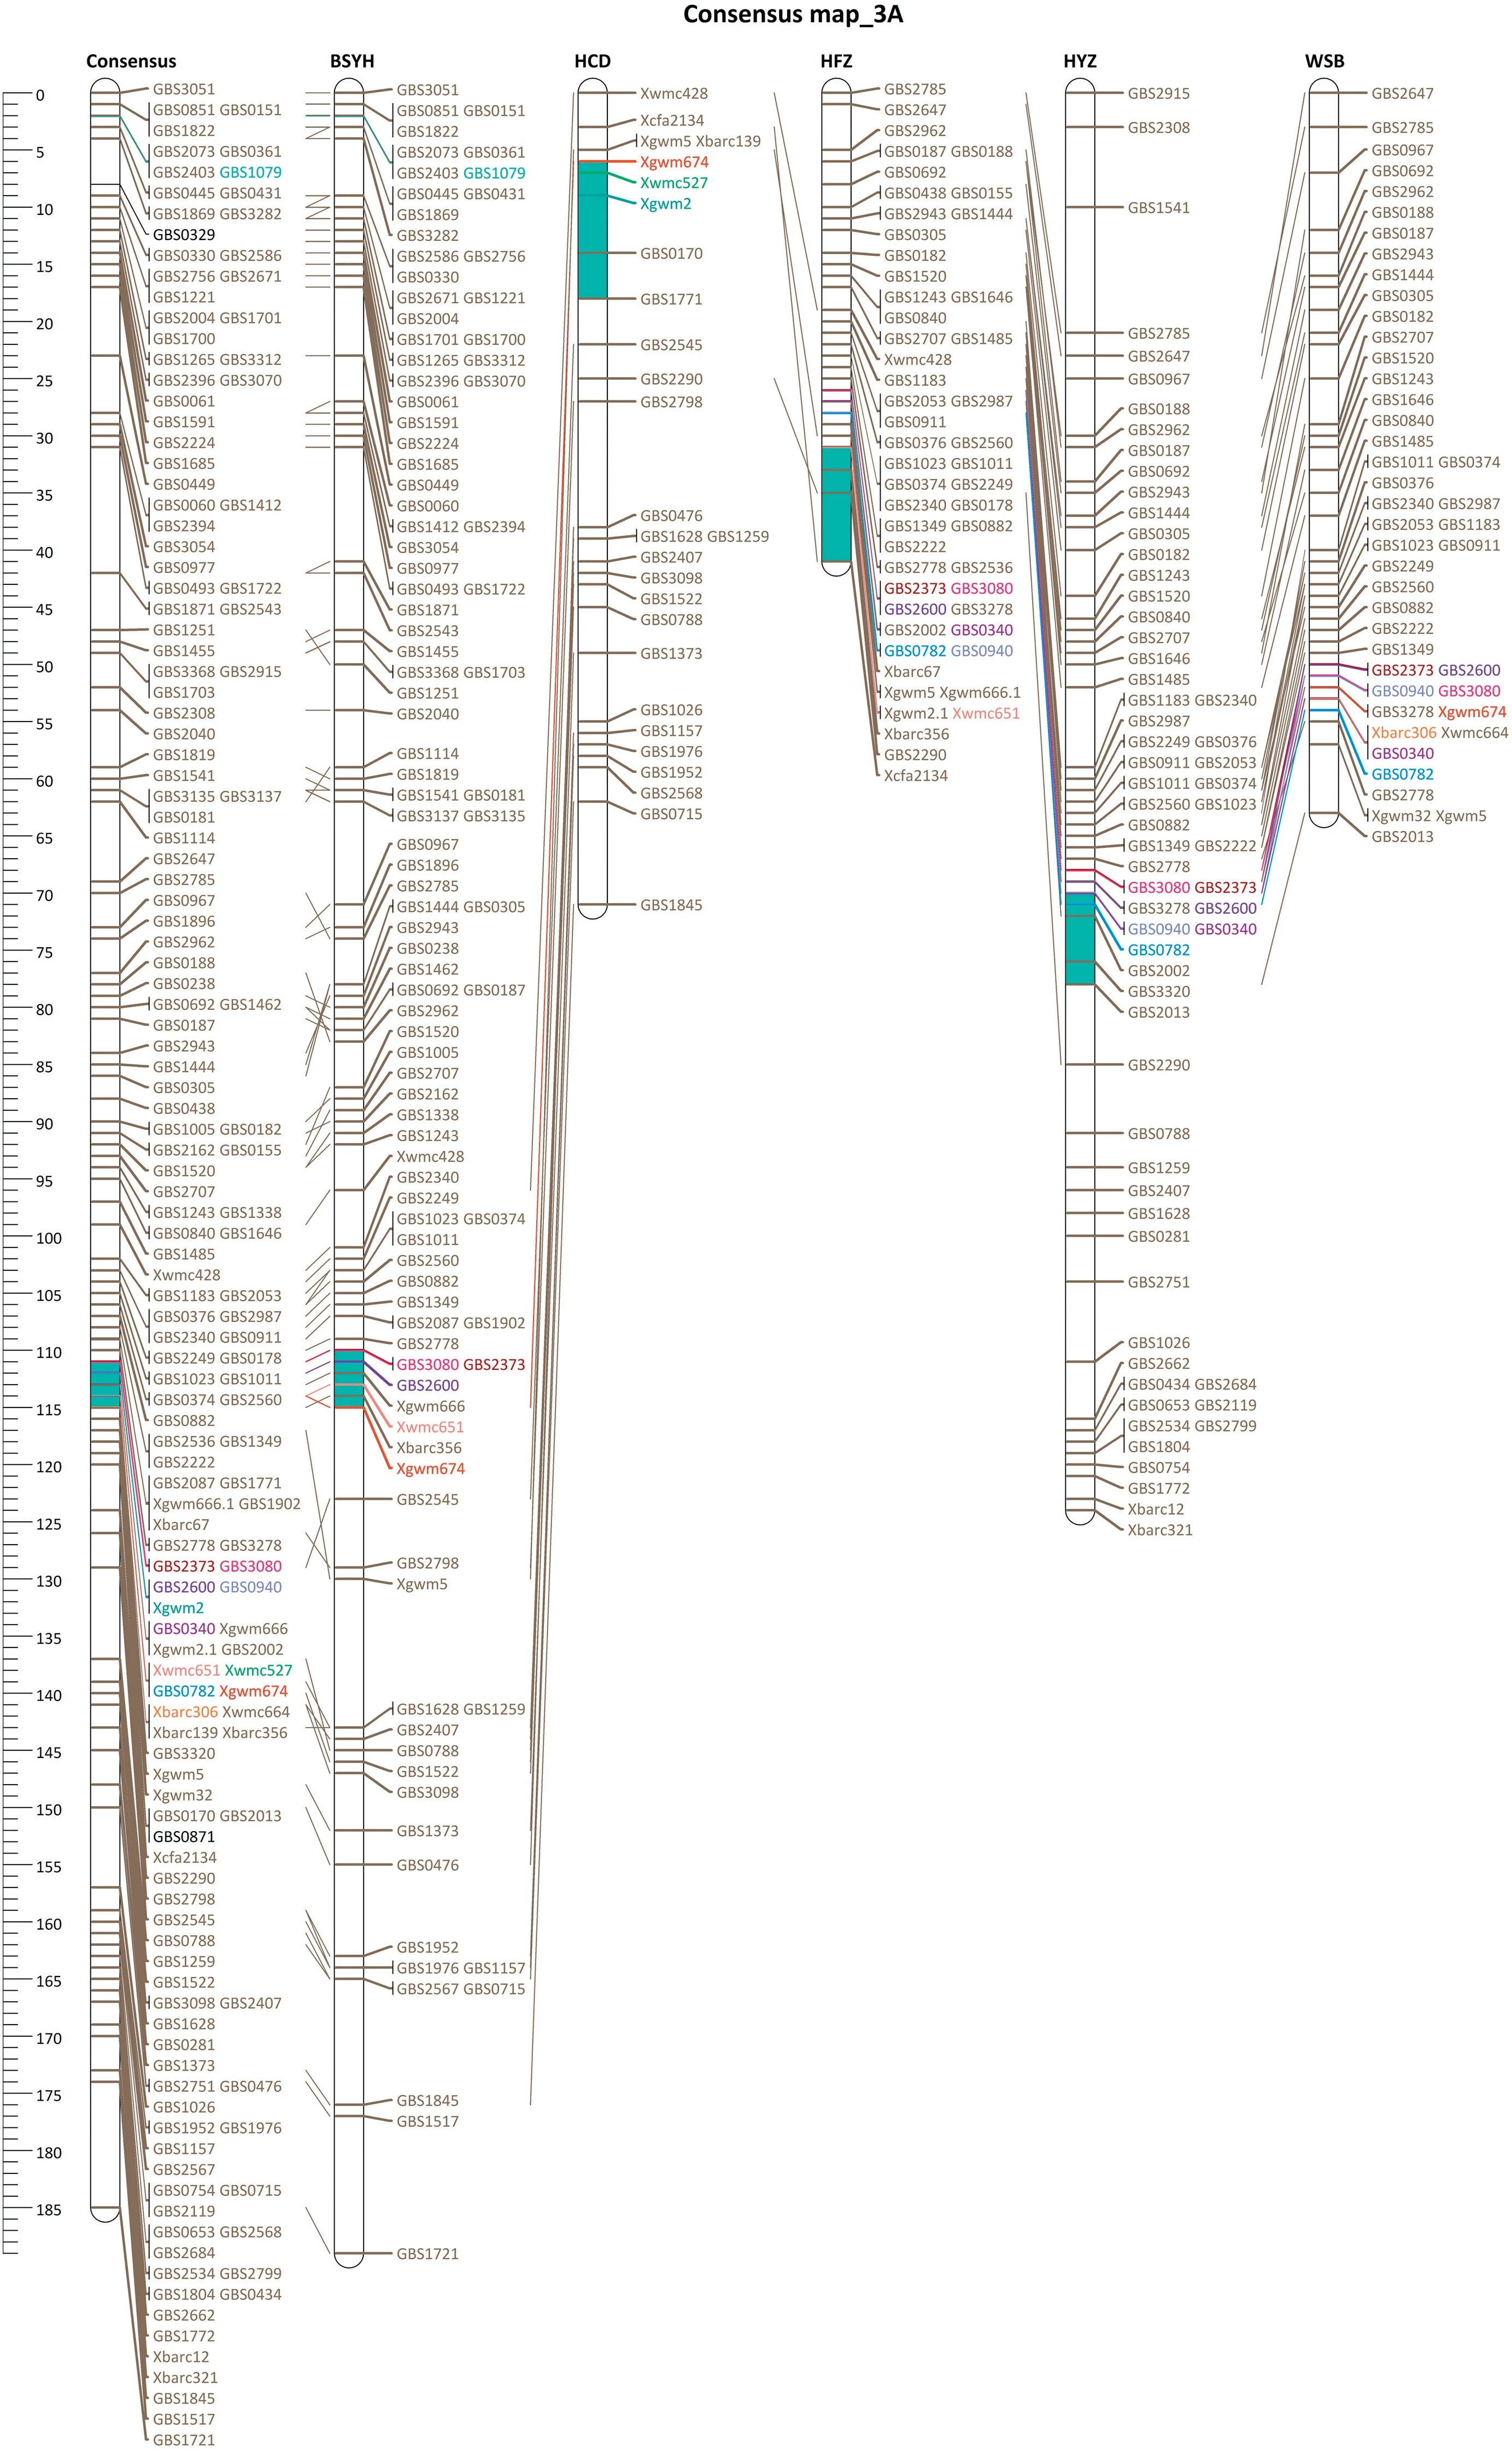
Fig.1 (continued).

Fig.1 (continued).
4. Discussion
4.1. Improved GBS-SNP maps identified new QTL
Previous QTL mapping studies using low-density SSR maps identified 27 QTL for type II FHB resistance on 14 chromosomes in the same five populations used in this study(Table 1). After SNP were added into new maps, most QTL with relatively large and stable effects were remapped, and several minor QTL disappeared.However,ten new QTL were identified on chromosomes 1A,2B,2D,3A,3D,4B,4D,6A,and 7A (Table 1). This was attributed to newly developed SNP maps that significantly increased map coverage and resolution by adding an average 1673 new SNP to each population(Table 2).
4.2. MQTL for FHB resistance in the five Chinese landraces
Meta-analysis of QTL is used to integrate multiple QTL from different studies and to investigate the congruence of these QTL among studies[35].In the current study,we identified six MQTL by remapping QTL using newly constructed SSR and SNP maps from the five populations. Those MQTL significantly narrowed CI compared to those in the original maps.
Among the six identified MQTL, 3BSd MQTL was centered at Xumn10,a near diagnostic marker for Fhb1[8,36],in the HCD and BSYH populations, SNP GBS1663 in the HFZ population and SNP GBS0800 in the WSB population. In the consensus map, the three markers were mapped to a 2.47 cM interval.Meta-analysis showed Xumn10 at the peak of the 3BSd MQTL,coinciding with the chromosome locations in the original maps because GBS-SNP, GBS0800 and GBS166, were located within the CI of Fhb1. However, meta-analysis greatly shortened the CI of Fhb1 (3.25 cM) compared to the originally reported narrowest CI of 4.43 cM (WSB) among the four populations with Fhb1 and improved accuracy of the MQTL location.Fhb1 from Sumai 3 and its derivatives has a large and stable effect on type II FHB resistance [9,37,38]. In the current study, Fhb1 was mapped in four of the five Chinese wheat landraces [25-28], but with variable effects on FHB response,ranging from 15.0% in BSYH to 30.3% in WSB. The large variation in the QTL effect may be due to seasonal differences in FHB phenotyping,genetic backgrounds of populations,and population size. Although several candidate genes have been reported for Fhb1 [39-41], a histidine-rich calcium binding protein(TaHRC)gene was recently confirmed as a causal gene[42]and diagnostic markers for Fhb1 were developed based on it [40].This gene is within the CI predicted in this study,demonstrating the efficacy of meta-QTL analysis in prediction of flanking regions of candidate genes.
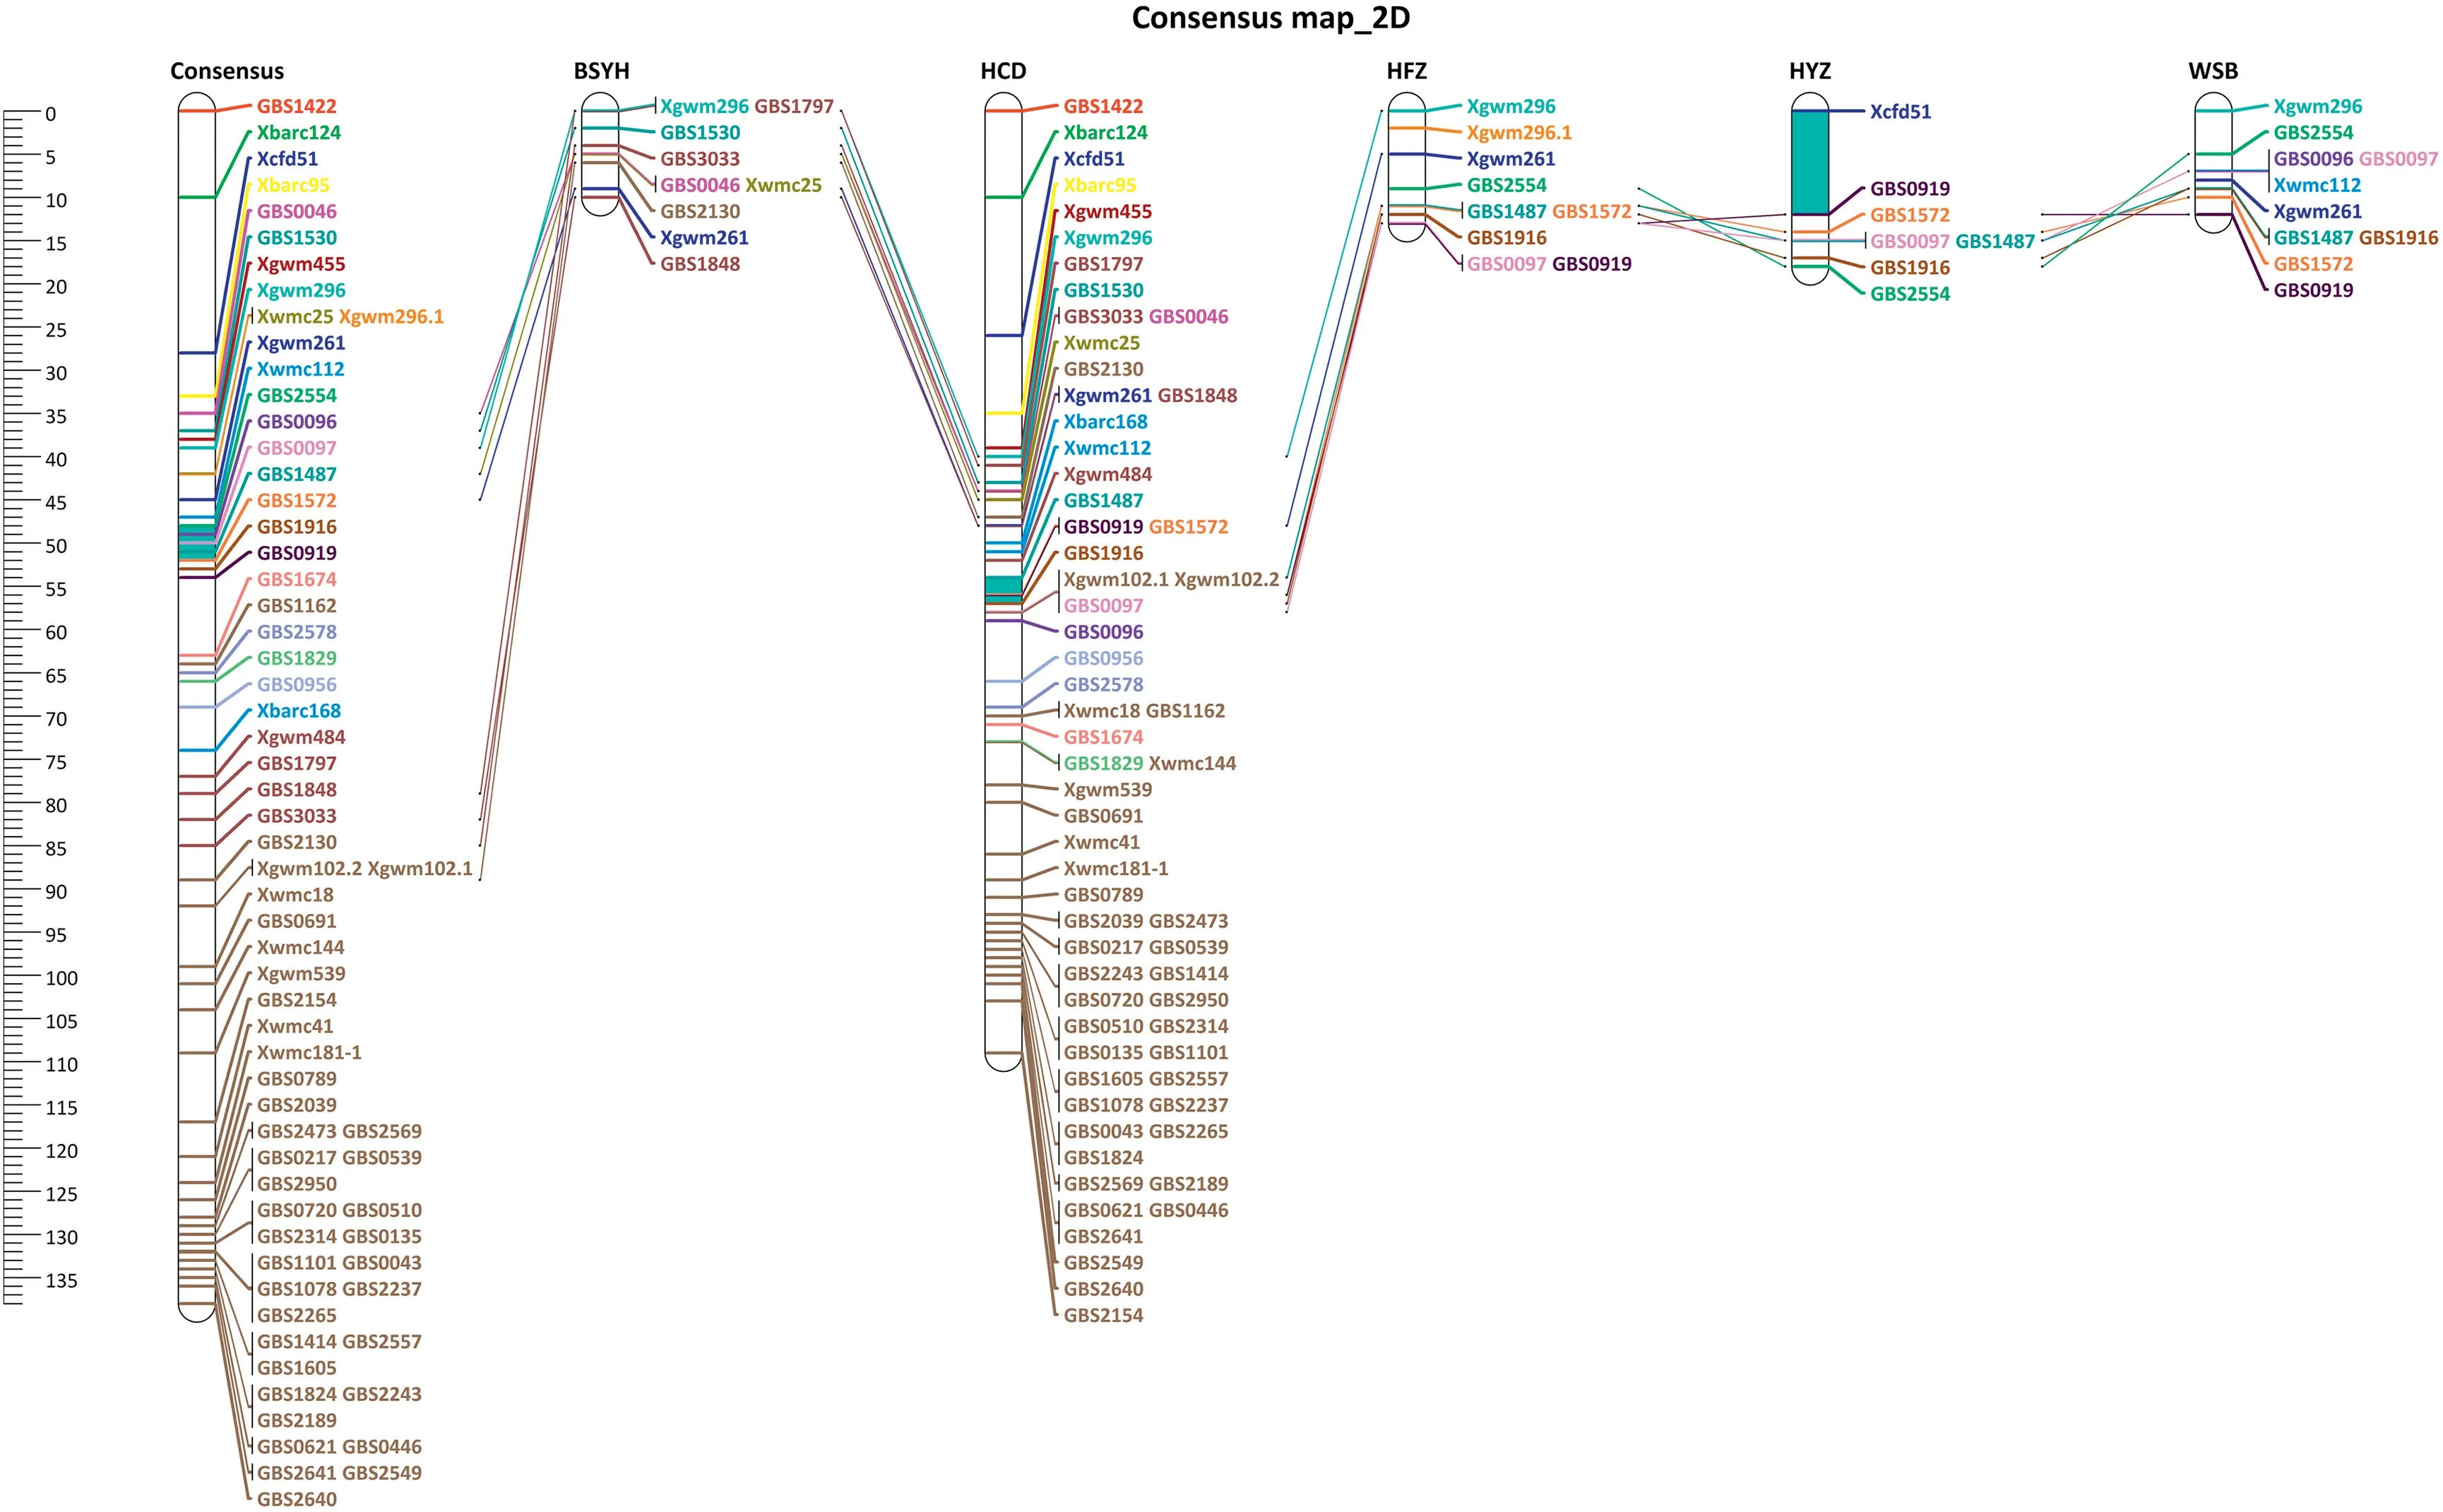
Fig.1 (continued).
The second MQTL on 3BS was the 3BSc MQTL reported in several other studies on Chinese and Japanese landraces[28,43-45], and some U.S. wheat accessions [46,47]. Although this MQTL showed a much smaller effect on FHB response than Fhb1 its presence in both Chinese and U.S. wheat cultivars and elite breeding lines indicates an important role in improving FHB resistance.Liu et al.[6]located this QTL to a Xgwm566 - Xbarc344 interval using a meta-analysis, in agreement with the current study. However, the current study identified more tightly linked markers, and narrowed the QTL interval GBS2385-GBS2285 to 0.53 cM,much smaller than the previous 4.7 cM for BSYH and 2.6 cM for WSB. The small CI in genetic distance is translated into a large interval of 119.7 Mb (257.5 to 377.2 Mb) in physical distance based on Chinese Spring reference genome, indicative of the low recombination rate near the centromere region. Markers in that region should be useful for MAS. Among the five SNP in the MQTL region, GBS2285 and GBS2882 showed the best correlation with PSS (r = 0.26-0.42, P <0.05) and thus should be good markers for selecting this MQTL.
The 3A MQTL was present in BSYH, HFZ, HYZ, and HCD.The original QTL were mapped to a 9 cM interval (110.78 to 119.85 cM) whereas the MQTL was mapped to a 1.4 cM interval, flanked by SSR markers Xgwm2.1 and Xbarc306. Two SNP and five SSR markers were mapped within the CI of the MQTL.SNP GBS2002 and GBS0782 in the MQTL region showed significant correlations of 0.28 and 0.27, but both were less than that of SSR marker Xgwm674 (r = 0.22-0.39). We then tried SNP GSB3080,GBS2600,and GBS0340 that were 0.2-2.0 cM from the MQTL region, and found that they all had slightly lower correlations, ranging from 0.21 to 0.35 (P <0.05). Other markers outside of the MQTL region did not show significant marker-trait associations, confirming that the 3A MQTL was mapped in a correct region. The QTL previously reported in both North and South American germplasm[48-52].Since this MQTL is frequently detected in Chinese landraces it is a good candidate for pyramiding with QTL from other sources.
The 3DL MQTL was from WSB and HFZ. The two original QTL were located to the same region at 31.2 cM with CI of 6.5 and 7.6, respectively. The MQTL narrowed the CI to 1.6 cM,centered at GBS2389 with Xgwm114-1 and GBS1203 as flanking markers.Several QTL have been reported on chromosome 3D,but to the short arm of 3D in Patterson [48]and Cansas [53],and are obviously different from the MQTL identified in this study.A QTL in Forno[54]did not have common markers with the MQTL in the current study. Therefore, the 3DL MQTL is likely a unique QTL from the Chinese landraces. Using metaanalysis and SNP maps, more tightly linked markers for the MQTL were identified,and will be useful for MAS.

Fig.2-Meta-QTL(MQTL)for type II FHB resistance mapped on consensus maps consisting of chromosomes 3BS(2 MQTL),3A,2D,3D,and 4D with 95%confidence intervals.The maps were developed from the five populations with Haiyanzhong(HYZ),Wangshuibai(WSB),Baishanyuehuang(BSYH),Huangfangzhu(HFZ),and Huangcandou (HCD)as the FHB resistant parents.Blue bars represent positions of MQTL;a pink bar represents a position of a second MQTL in a chromosome.
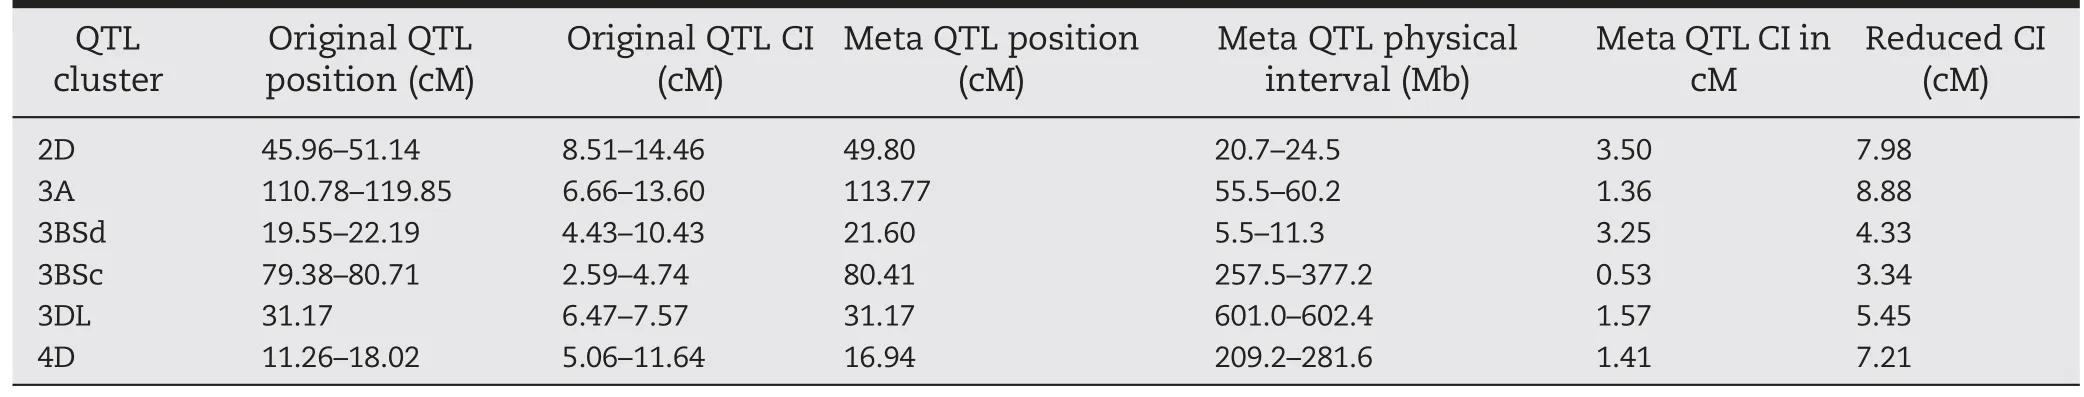
Table 3-Original QTL and meta-QTL(MQTL)positions and confidence intervals(CI)of MQTL clusters(95%)constructed from the five mapping populations involved Haiyanzhong(HYZ),Wangshuibai(WSB),Baishanyuehuang(BSYH),Huangfangzhu(HFZ),and Huangcandou(HCD)as resistant parents using MetaQTL V1.0.
The 2D MQTL centered at GBS0097 was from Jagger and Wheaton,and flanked by GBS2554 and GBS1572.This MQTL is close to Rht8,a height-reducing gene[55]on chromosome 2DS.The MQTL might be the same as a QTL mapped in Alondra[56], Wuhan 1 [42], Gamenya [55], WSB [57], and Jagger [25]based on the common SSR markers Xwmc25, Xgwm261, and Xgwm296. Handa et al. [55]identified a multidrug resistanceassociated protein (MRP) as a candidate gene for this QTL,which is present in moderately susceptible cultivars from different countries,suggesting that it may be a common gene in many commercial cultivars. Further screening of locally adapted cultivars might identify more adapted parents as a donor of the QTL for gene pyramiding with other QTL in breeding programs.The current study identified closely linked markers, GBS0096, GBS0097, and GBS1487, to the QTL with GBS1487, the last being successfully converted to KASP assay for MAS(Fig. 3-e).
The 4D MQTL from HYZ and BSYH was originally mapped to an interval between 11.3 and 18.0 cM. Two QTL have been reported on chromosome 4D with one near Rht-D1, a semidwarfing gene on 4DS[58,59]and the other on 4DL[44,60].The MQTL in the current study was the same as the one mapped on 4DL with the common marker Xwmc457 mapping 0.46 cM from the MQTL. Four SSR markers were mapped within the MQTL region with Xwmc52 as the closest. Lack of SNP in this region may be due to the low polymorphism of the D genome.Since new SNP were not identified in the MQTL region, KASP assays were designed using GBS-SNP GBS1498, GBS3012, and GBS1836 that were a few cM from the MQTL region. The derived KASP markers showed slightly lower, but significant,associations with FHB resistance (r = 0.21-0.30, P <0.05) than the SSR markers, and thus they can also be used for MAS if closely linked SSR markers are not polymorphic between parents.
Two QTL, one from HFZ and HYZ on chromosome 4B and the other from HCD and HFZ on 1A,could not be clustered into MQTL because the initial QTL lacked common markers. The 4B QTL from HYZ corresponded to Fhb4 which was centered on Xgwm6 and flanked by GBS2746 and GBS1303 whereas the 4B QTL from HFZ,centered on GBS2125,was about 25 cM from Xgwm6 in the HYZ map and 41 cM from GBS2746 in the 4B consensus map.Hence,they were unlikely to be the same QTL and could not be combined into one MQTL. The 1A QTL centered at GBS2817 in HCD and at GBS1402 and GBS1707 in HFZ, and the two QTL were about 40 cM apart in the 1A consensus map and could not be combined into a single MQTL.
4.3. Unique QTL in the five populations
Besides six MQTL,we also identified QTL on chromosomes 1A,2B, 3BL, 4B, 5AS, 5DL, 6A, 6BS, 6D, 7A, and 7DL that were mapped in single populations.QTL on chromosomes 5AS,6BS,4B, 1A and 7A were previously mapped in multiple studies[5,6], whereas QTL on chromosomes 3BL, 6A and 6D were unique to this study. The QTL on 6BS mapped in HYZ ×Wheaton population coincided with the previously mapped Fhb2 based on common markers Xgwm88 and Xwmc397 [10].The 4B QTL in HYZ is more likely Fhb4 [61]. The 5AS QTL was mapped as a major QTL in HYZ, and is likely Fhb5 [12]. In previous QTL mapping with SSR markers the 5A QTL was significant in three of five populations (Table S4) [26-28];however, further analysis of the QTL data indicated that this QTL showed only minor effects with marginal significance on type II resistance in one or two experiments [5,26-28]. When the new SNP maps were used for QTL reanalysis, none was significant (Table S3). However, this QTL was reported to affect mainly type I resistance [28,44,62-64], perhaps explaining the differing results between the current and previous studies. Although the 5A QTL was significant in the newly phenotyped HYZ × Wheaton population a MQTL was not detected on 5AS because of non-significance in the other four populations.
4.4. KASP assays for breeding selection
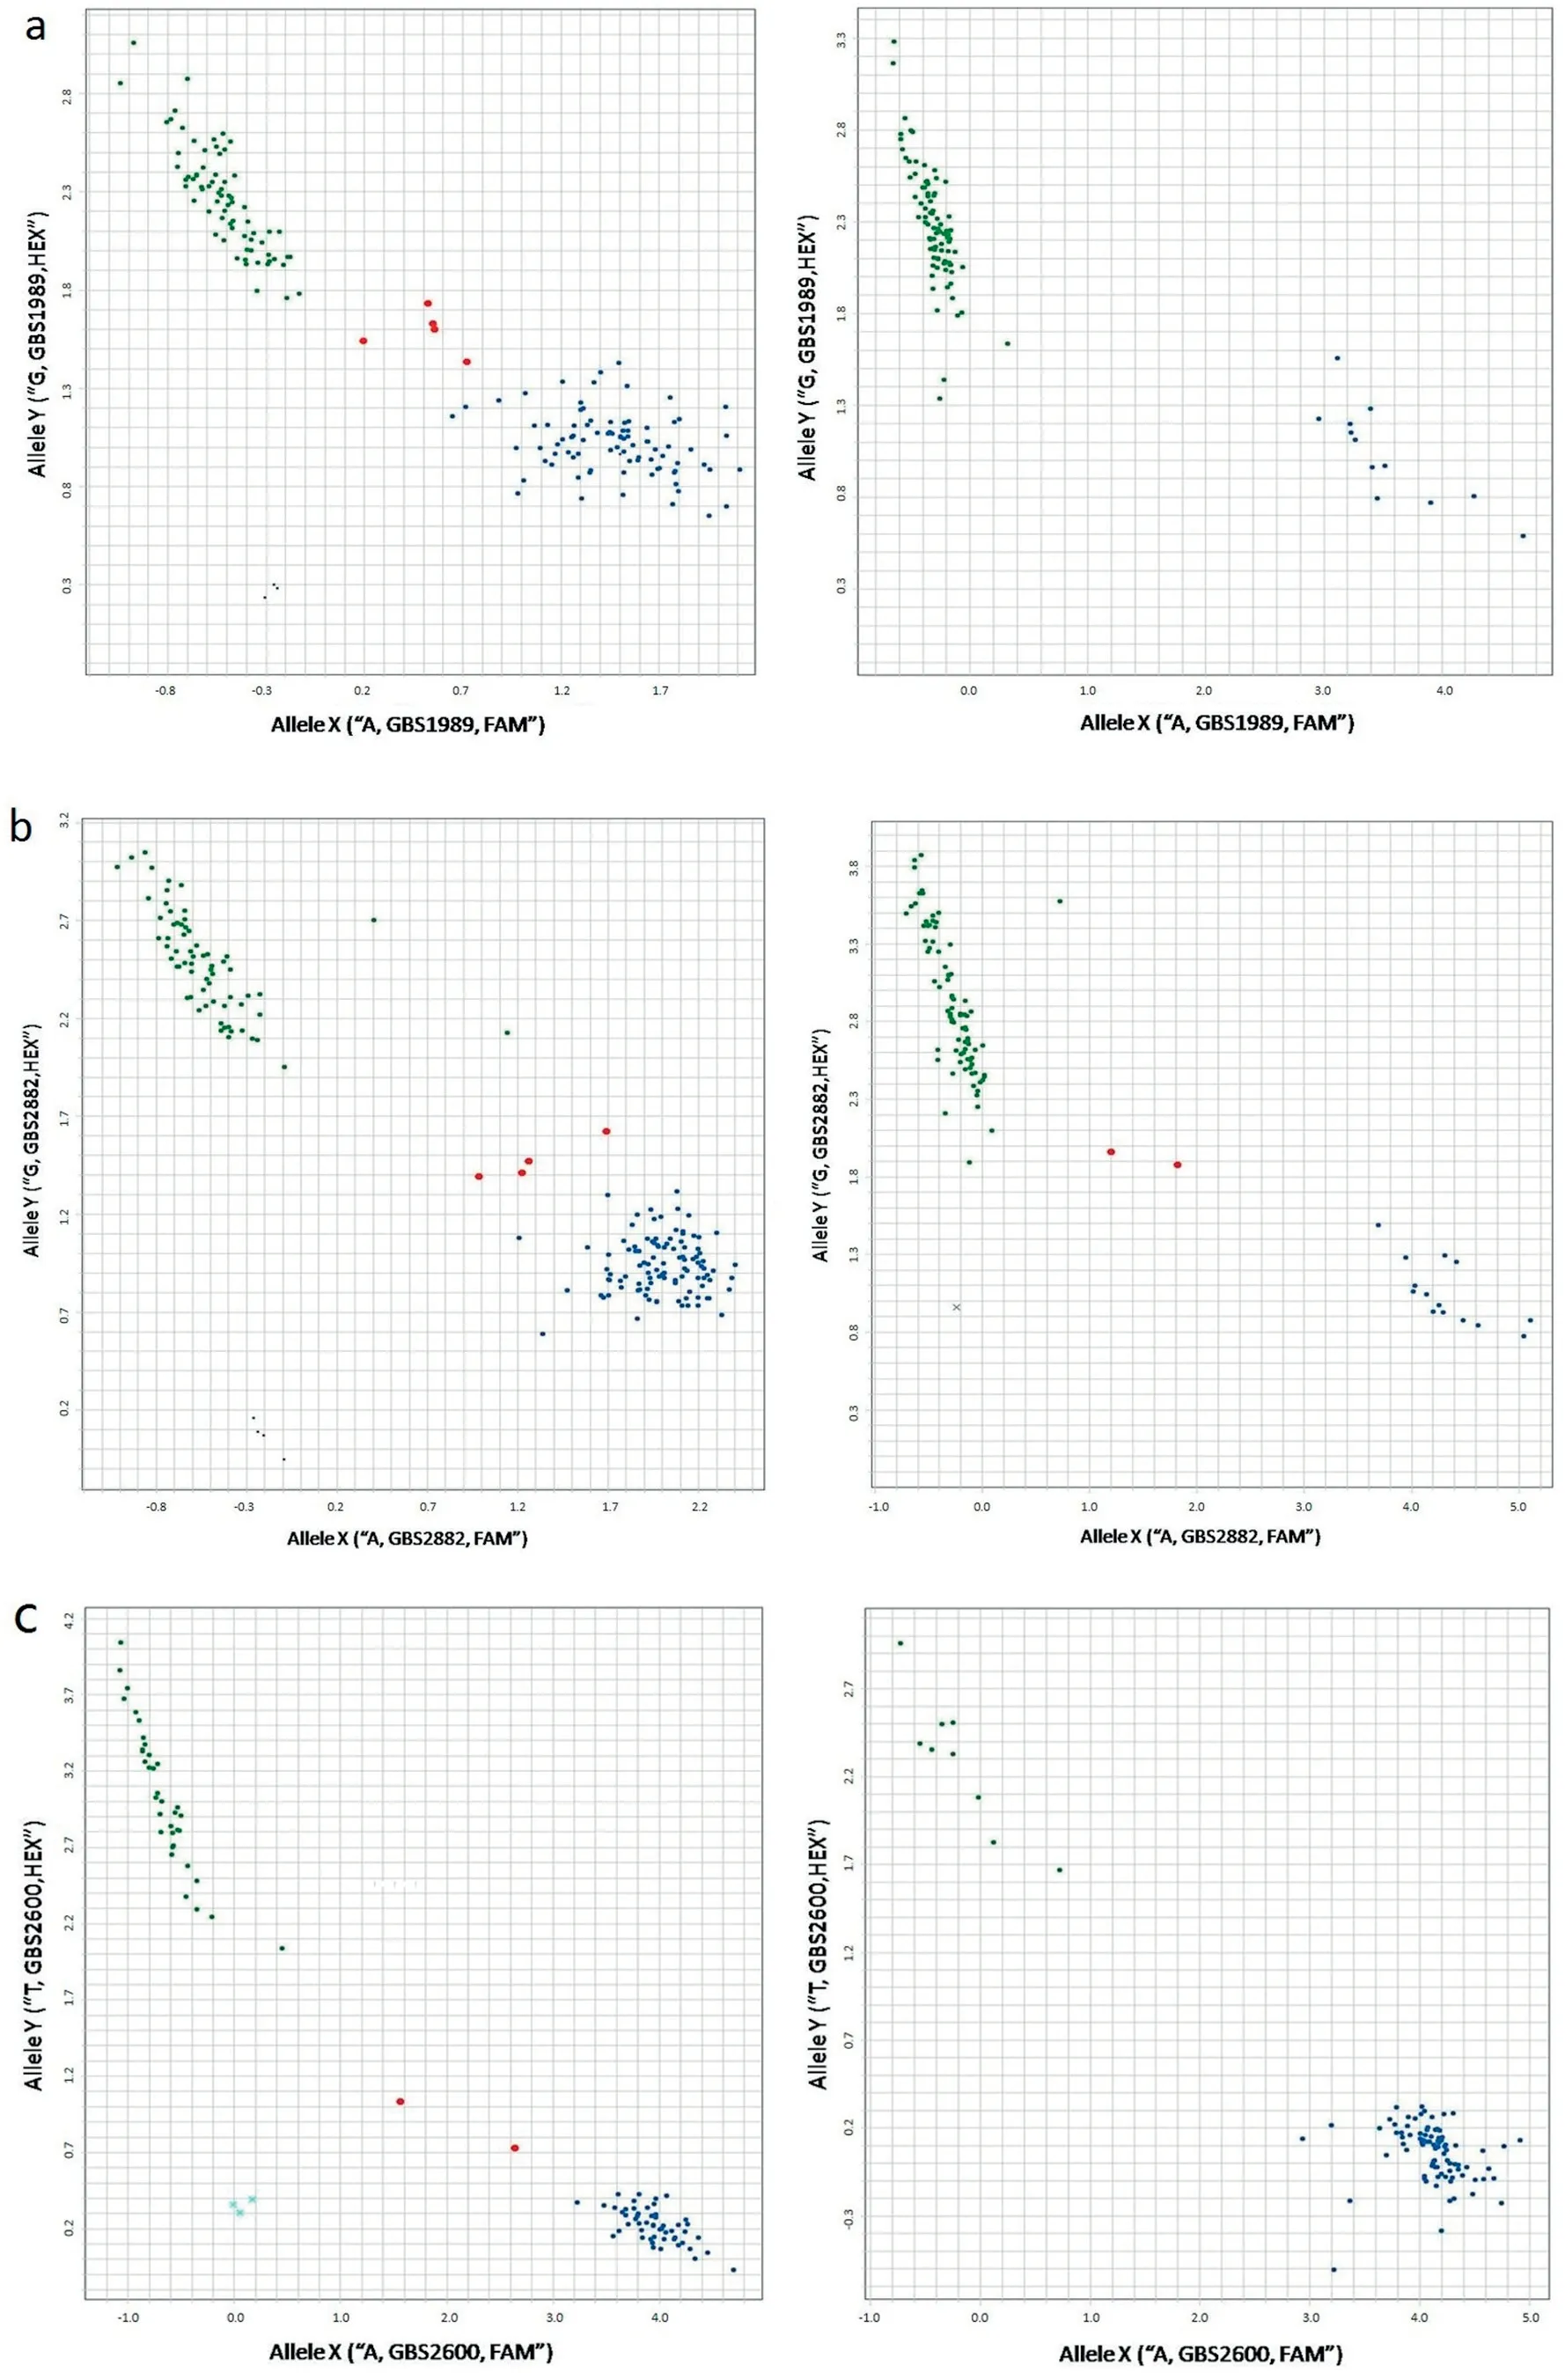

Fig.3-KASP assay profiles for(a)KASP GBS1989 linked to 3BSd QTL in BSYH×Jagger(left)and AM(right)populations;(b)KASP GBS2882 lnked to 3BSc QTL in BSYH×Jagger(left)and AM(right) populations;(c)KASP GBS2600 linked to 3A QTL in HYZ×Wheaton(left) and AM(right)populations;(d) KASP GBS0781 linked to 3DL QTL in WSB×Wheaton (left)and AM(right)populations;(e) KASP GBS1487 linked to 2D QTL in HCD×Jagger(left)and AM(right) populations.Blue dots represent alleles associated with resistance,green dots represent alleles associated with susceptibility,red dots are heterozygotes(or mixtures),and the black crosses or dots are ddH2O controls.
GBS-SNP are powerful for simultaneous marker discovery and genotyping at a relatively low cost per sample [21,65].However, GBS usually generates SNP with a large numbers of missing data.This study generated 17277 GBS-SNP with <50%missing data,but only 3429 GBS-SNP hade <20%missing data.Imputation can be used to predict missing data based on available reference genome sequences [21,66], but prediction accuracy varies with completeness of the reference genome sequences[67].Increasing the number of sequencing runs for each library can also reduce missing data, but sequencing costs increase significantly.To verify the accuracy of GBS data and eliminate missing data,GBS-SNP that were mapped in or close to MQTL regions were converted to KASP assays for marker confirmation. Among the 26 KASP assays that were designed, 22 were successfully amplified and four were not because the SNP positions were too close to one end of the sequence reads,or more than one SNP was close to the target SNP position. Among the 22 KASP-SNP, 21 were remapped to the same positions as the corresponding GBS-SNP were mapped,with only one mapped to a different position.Eleven of the 22 KASP assays were then selected to evaluate polymorphisms in an AM panel of 96 U.S. elite lines and cultivars (Table S2). Ten KASP showed unequal clusters, thus can be used to transfer the linked MQTL (Fig. 3). Whereas,GBS1836 showed almost equal clusters indicating that half of the U.S. winter wheat accessions might have the resistance alleles that are likely false positives,those KASP assays might be useful for MAS when the breeding parents are polymorphic.
Declaration of Competing Interest
Authors declare that there are no conflicts of interest.
Acknowledgments
This is contribution number 19-314-J from the Kansas Agricultural Experiment Station. This project was partly funded by US Wheat and Barley Scab Initiative and the National Research Initiative Competitive Grants (2017-67007-25939, 2017-67007-25929) from the National Institute of Food and Agriculture,U.S.Department of Agriculture,from Natural Science Foundation of Jiangsu Province, China (BK20170596),and Jiangsu Agricultural Science and Technology Innovation Fund, China (CX (17) 3004). Mention of trade names or commercial products in this publication is solely for the purpose of providing specific information and does not imply recommendation or endorsement by the USDA. USDA is an equal opportunity provider and employer.
Supplementary data
Supplementary data for this article can be found online at https://doi.org/10.1016/j.cj.2019.05.003.
- The Crop Journal的其它文章
- Positional cloning of PmCH1357 reveals the origin and allelic variation of the Pm2 gene for powdery mildew resistance in wheat
- The Crop Journal 作物学报(英文版) (Started in 2013, Bimonthly)
- Wheat powdery mildew resistance gene Pm64 derived from wild emmer(Triticum turgidum var.dicoccoides) is tightly linked in repulsion with stripe rust resistance gene Yr5
- Wheat breeding in northern China: Achievements and technical advances
- Breed ing w heat for resistance to Fusarium head blight in the Global North: China,USA,and Canad a
- Pyramiding disease resistance genes in elite winter wheat germplasm for Western Canada