
Integrated transcriptomics and metabolomics analyses provide insights into cold stress response in wheat
2019-12-20 06:40YongZhoMengZhouKeXuJihoLiShnshnLiShuhuZhngXuejuYng
The Crop Journal 2019年6期
Yong Zho, Meng Zhou, Ke Xu, Jiho Li, Shnshn Li,Shuhu Zhng, Xueju Yng,*
aHuabei Key Laboratory of Crop Germplasm,Hebei Agricultural University, Baoding 071000,Hebei,China
bCollege of Life Sciences,Hebei University, Baoding 071000,Hebei,China
Keywords:Cold tolerance Transcriptome Metabolome Abscisic acid Jasmonic acid Signaling pathways
ABSTRACT Cold tolerance of crop plants influences survival and productivity under low-temperature conditions. Elucidation of molecular mechanisms underlying low temperature tolerance could be helpful in breeding. In this study, we used integrated transcriptomics and metabolomics analyses to investigate changes in gene/metabolite activity in a winter-hardy wheat cultivar of (cv. Jing 411) when subjected to sold stress. The 223 metabolites mainly enriched during cold acclimation included carbohydrates, flavonoids, and amino acids.Eight common metabolites had altered abundance following freezing treatment; six increased and two decreased. Transcriptome analysis revealed that 29,066 genes were differentially expressed in wheat crowns after cold acclimation compared to the nonacclimated control. Among them, 745 genes were up-regulated following freezing treatment, suggesting substantial change in expression of a large quantity of genes upon cold acclimation and freezing treatment, which impacts on the modified metabolites.Integrated analysis of gene expression and metabolite profiles revealed that the abscisic acid (ABA)/jasmonic acid (JA) phytohormone signaling and proline biosynthesis pathways were significantly modulated under cold acclimation and freezing treatments. Our results indicated that low-temperature stress induced substantial changes in both transcriptomes and metabolomes. Critical pathways associated with ABA/JA signaling and proline biosynthesis played important roles in regulating cold tolerance in wheat.
1. Introduction
Low temperatures have large effects on growth,development,yield,quality,and the geographical distribution of crop plants[1]. Two factors affect the degree of tissue injury under lowtemperature conditions. These are cold acclimation that occurs at temperatures above (>0 °C) and actual tissue and freezing (< 0 °C) [2]. Both trigger complicated changes in morphological,biochemical and physiological traits[3].Without a period of prior acclimation wheat genotypes are significantly more sensitive to freezing temperatures. Winter wheat production covers a cold season challenged frequently by freezing temperatures in most areas around the world,enhancing cold tolerance of this species benefits the crop productivity and promotes the sustainable agriculture. Genetic variation in cold tolerance permits the breeding of varieties with improved cold tolerance [4], however, knowledge of the physiological mechanisms underlying the cold tolerance are still elusive, possibly limiting genetic improvement in tolerance.
Cold stress,such as freezing,leads to breakdown in cellular structure as evidenced by metabolite leakage [2]. Plants accumulate high osmolytes that act as osmotic stressregulatory substance upon low temperatures by which to alleviate them from injury or damage [3]. The response of plants to cold stress is closely related to the production and distribution of various metabolites, including carbohydrates,amino acids, and hormones. Previous studies showed that soluble sugar levels are significantly increase in diverse plant species upon low-temperature stress,such as grape[5],cabbage[6], red spruce [7], and citrus (Citrus reticulata) [8], as well as wheat [9-11]. Proline concentration is a key factor in cold tolerance. As an osmotic conditioning compound, proline functions in reactive oxygen species(ROS)homeostasis,plasma membrane integrity,and cold resistance of plants such as those of rice[12],maize[13],and wheat[14,15].In addition,as a global signaling transport regulator, the phytohormone abscisic acid(ABA)stabilizes membrane structure,regulates stomatal movement, and controls osmotic stress tolerance of plants through transcriptional regulation of downstream stress-related genes[16].Application of exogenous ABA enhanced the cold tolerance of tomato [17], Magnolia liliiflora [18], and winter wheat [19].There is also increasing evidence that jasmonic acid (JA) is involved in regulation of plant cold tolerance [20,21]. These reports indicate the complex nature of plants responses to low temperature.
Plants respond to cold stress via complex gene regulatory networks that cause extensive changes in metabolite contents. Previous studies indicated that AP2/ERF, MYB, NAC,bZIP, and WRKY transcription factors (TFs) are associated with the plant cold resistance.Cook et al.[22]showed that the CRT/DRE-binding factor(CBF)cold response pathway played a prominent role in configuring the low temperature-related metabolite profile in Arabidopsis thaliana. Soltész et al. [23]cloned TaCBF14 and TaCBF15 from winter wheat and confirmed that overexpression of these genes increased frost tolerance in spring barley.
Several plant species, such as Camellia sinensis (L.) O. Ktze[24],potato(Solanum tuberosum L.)[25],barley(Hordeum vulgare L.) [3], and wheat [26,27], have been extensively subjected to transcriptome analysis by RNA sequencing (RNA-seq), an efficient and cost-effective gene mining approach. Moreover,metabolomics-based research has identified a number of individual small and intermediate metabolites, which are shown to be relevant for various aspects of plant physiological characteristic under diverse abiotic stress conditions. Bao et al. [28]detected 54 metabolites under various temperature treatments, with a metabolomics-based investigation.
Changes in arginine and proline metabolism have important roles in improving cold adaptation in plants [29-31]. Despite these insights,the cold-related networks reported thus far are needed to be further explained using Multi-Omics technologies that dissect the multiple corresponding genes or metabolites. Therefore, further large-scale analyses of transcript and metabolite behavior are required for understanding how plants respond to low temperature response.
The objective of the current study was to elucidate the potential links between genes and metabolites in plant response to low temperature conditions. Our results provide new understanding of cold tolerance in wheat at the molecular level.
2. Materials and methods
2.1. Plant materials and cold treatments
Three cultivars, including “Jing 411” (cold-tolerant),“Shannong 20” (medium in cold tolerance) and “Zhoumai 25”(cold-sensitive)that differ in cold stress response,was used in this study [32-34]. Of which, Jing 411, a typical winter-hardy cultivar planted widely in North China [32], was subjected to transcriptome and metabolome analyses upon the normal and low temperature conditions. Seeds were germinated for 24 h in darkness and then transferred to plastic pots containing soil and vermiculite (1:1, w/w). Seedlings were grown in a cabinet for 15 days at 20 °C in a 12-h photoperiod and 60%-75%. At the three-leaf stage the seedlings were transferred to 4 °C for low temperature acclimation(LTA)(test group). Another set of seedlings (control group) was maintained at 20 °C (normal temperature growth, NTG). After 28 days, the LTA and NTG seedlings were frozen at -5 °C for 24 h (LTAF, low temperature acclimation, then freezing; and NTGF, normal temperature growth, then freezing). The crowns from 10 seedlings per group were pooled (with three replications), and immediately frozen in liquid nitrogen for the subsequent RNA and metabolite extractions.
2.2. Transcriptome analysis
2.2.1.RNA extraction and sequencing
Total RNA was extracted from the crown samples with the Trizol reagent(Invitrogen,Carlsbad,CA,USA)according to the manufacturer's instructions.The quantity,quality,and integrity of extracted RNA were determined as follows. RNA integrity was monitored with 1% agarose gels, and purity was determined with a NanoPhotometer spectrophotometer(Implen, CA, USA). RNA concentration was calculated with a QubitRNA Assay kit and Qubit 2.0 fluorometer (Life Technologies, Fremont, CA, USA). RNA integrity was also confirmed with an RNA Nano 6000 Assay kit and 2100 Bioanalyzer system(Agilent Technologies, Palo Alto,CA,USA).
Sequencing libraries were constructed with the NEBNext Ultra RNA Library Prep Kit for Illumina (NEB, San Diego, CA,USA) using 3 μg RNA samples used as templates. Briefly,mRNA was purified from total RNA with poly-T oligo-attached magnetic beads and then fragmented in NEBNext First Strand Synthesis Reaction buffer (5×). The cDNA, synthesized with random hexamer primers and three enzymes[M-MuLV reverse transcriptase(RNase H-),DNA polymerase I,and RNase H],was purified with AMPure XP beads, adenylated at the 3′ end, and ligated to NEBNext adapters before being purified with the AMPure XP system (Beckman Coulter, Brea, CA, USA) to preferentially select 150-200 bp fragments. PCR amplification was then performed with Phusion High-Fidelity DNA polymerase, universal PCR primers, and the Index (X) Primer. The PCR products were purified with the AMPure XP system (Beckman Coulter, Brea, CA, USA) and their quality was assessed with a 2100 Bioanalyzer(Agilent,Palo Alto,CA,USA).Reads containing adapters or poly-N sequences as well as low-quality reads were removed from the raw data to obtain clean reads in FASTQ format.Q20 and Q30 values and GC contents were determined following conventional methods.
2.2.2. Analysis of differentially expressed genes
Differentially expressed genes (DEGs) were analyzed on the basis of a negative binomial distribution model the with the DESeq R package (version 1.18.0; Ross Ihaka, University of Auckland, New Zealand). The Benjamini and Hochberg approach was used to adjust P-values in order to control the false discovery rate (FDR). Genes showing significant differences at P <0.05 were considered to be differentially expressed. Gene ontology (GO) enrichment analysis on DEGs was conducted with the GOseq R package [35]and enriched KEGG (Kyoto Encyclopedia of Gene and Genomes)pathways among the DEGs were identified with the KOBAS program [36]. A phylogenetic analysis was made with the MEGA 6.0 program[37].
2.3. Metabolome analysis
2.3.1. Metabolite extraction and LC-MS analysis
Powdered crown samples (100 mg) was treated with 1.0 mL aqueous methanol (70%, v/v) overnight at 4 °C and vortexed three times to enhance the extraction. Following centrifugation at 10,000 ×g for 10 min the extracts were added to a CNWBOND Carbon-GCB SPE Cartridge (ANPEL, Shanghai,China) and filtered through a SCAA-104 membrane (0.22 μm pore size;ANPEL)for a subsequent LC-MS analysis.
Known and unknown metabolites were screened by ultraperformance liquid chromatography(UPLC)and tandem mass spectrometry(MS/MS).UPLC analysis was conducted with the Shim-pack UFLC Shimadzu CBM30A instrument (Shimadzu,Kyoto, Japan) equipped with a Waters Acquity UPLC HSS T3 C18 column(1.8 μm,2.1 mm × 100 mm).The column temperature was 40 °C,and the mobile phase consisted of water and acetonitrile, both containing 0.04% acetic acid. Gradient elution was performed at a flow rate of 0.40 mL min-1, with an injection volume of 5 μL for each sample. MS/MS analysis was completed with an Applied Biosystems 4500 Q TRAP system(Thermo,MA, USA).
2.3.2. Qualitative and quantitative analyses of metabolites
Metabolite structures were analyzed based on an in-house custom database (Metware) and MassBank (http://www.massbank.jp/), KNAPSAcK (http://kanaya.naist.jp/KNApSAcK/),HMDB(http://www.hmdb.ca/),MoToDB(http://www.ab.wur.nl/moto/),and METLIN(http://metlin.scripps.edu/index.php)public databases. Metabolites were quantified with the multiple reactions monitoring mode in a triple quadrupole mass spectrometer (AB Sciex, Waltham, MA, USA). An orthogonal partial least squares-discriminant analysis and multivariate statistical analysis with supervised pattern recognition were used for identification of metabolites. Metabolites with significant differences in content were determined according to the following criteria:variable importance in the projection value ≥1 and fold-change ≥2 or ≤0.5.
2.4. Exogenous ABA treatment
Three cultivars differing in cold tolerance(Jing 411,Shannong 20, and Zhoumai 25) were subjected to exogenous ABA to understand the response variations of different cultivars.Wheat seedlings were grown to three-leaf stage under the same condition described in Section 2.1,then subjected to a 4-week cold acclimation period at 4 °C followed by a 24 h freezing treatment at -5 °C. Exogenous ABA (25 mL per pot)was sprayed onto 25 seedlings at the three-leaf stage (with three replications)once a week at four concentrations(0,5,15,and 25 mg L-1).During the ABA treatment,the seedlings were transferred to the cold acclimation and freezing conditions as aforementioned, with each ABA spraying within one week.Leaves from five seedlings under the same conditions were harvested for measuring superoxide dismutase (SOD), peroxidase (POD), and catalase (CAT) activities [38](with three replications). The mean data regarding SOD, POD, and CAT activities in response to various ABA concentrations were analyzed with Duncan's multiple range test (P <0.05) in the SPSS program(version 16.0)(SPSS,Chicago,IL, USA).
2.5. Quantitative real-time polymerase chain reaction validation
The expression patterns of 12 selected DEGs in the LTA,NTG, LTAF, and NTGF samples were analyzed with primer pairs designed with the Primer 5 program (version 5.0)(Premier Biosoft International, Canada) (Table S1). We synthesized cDNA with a PrimeScript RT Reagent Kit with gDNA Eraser (TaKaRa, Shiga, Japan) and isolated RNA was used in RNA-seq analysis. A quantitative real-time polymerase chain reaction (qPCR) assay was conducted with BCS Wiz SYBR Green qPCR Master Mix and the QuantStudio 5 Real-time PCR system(Applied Biosystems,Maltham,MA,USA).The following amplification protocol was used to generate melting curves: 95 °C for 5 min; 40 cycles of 95 °C for 10 s and 60 °C for 30 s; and a final step of 95 °C for 15 s, 60 °C for 60 s, and 95 °C for 15 s. Each sample was analyzed with four technical replicates. Relative gene expression levels were calculated according to the 2-ΔΔCtmethod, with GAPDH as the reference gene.
3. Results
3.1. Transcriptome analysis
3.1.1.Global analysis of transcriptome data
Twelve libraries (four samples × three replications) were sequenced, yielding approximately 50 million high-quality clean reads per library. An overview of the RNA-seq data for the 12 libraries is shown in Table S2. RNA-seq produced 52,419,663, 52,879,828, 50,894,044, and 50,528,645 clean reads for the NTG, LTA, NTGF,and LTAF libraries, respectively. The proportion of the clean reads mapped to the wheat TGACv reference genome (ftp://ftp.ncbi.nlm.nih.Gov/genomes/genbank/plant/Triticum_aestivum/latest_assembly_versions/) ranged from 91.58% to 93.68%. The clean reads shared a GC content of approximately 55%.
A total of 15,320 up-regulated and 13,746 down-regulated DEGs were detected in the comparison between LTA and NTG samples.Following subjection of the NTG samples to the-5 °C freezing treatment there were 2875 up-regulated and 5543 down-regulated DEGs in the NTGF samples. In contrast, 3283 DEGs were up-regulated and 950 were down-regulated in the LTAF samples in response to the freezing treatment(Fig.1-a).According to the Venn analysis 745 up-regulated and 237 down-regulated genes were common to the NTGF vs.NTG and LTAF vs. LTA comparisons(Fig.1-b,c).
To functionally characterize the identified DEGs a GO analysis was performed to classify them into component categories. GO terms assigned to DEGs identified after cold acclimation were mainly related to cellular components,“cell”, “intracellular part”, and “organelle” (Fig. S1-a). The top 30 GO terms for the 11,624 DEGs identified in the NTGF vs.NTG and LTAF vs.LTA comparisons are presented in Fig.S1-b.In the biological process category, which encompassed the majority of DEGs, 3478, 103, and 128 DEGs were assigned to“metabolic process”, “photosynthesis”, and “response to hormone” GO terms, respectively. Under the molecular function category 3096 DEGs were assigned the “catalytic activity” GO term, whereas 742 were associated with “kinase activity”.
The KEGG analysis of DEGs up-regulated following cold acclimation were mainly related to “ribosome”, “oxidative phosphorylation”, and “arginine and proline metabolism”,whereas the down-regulated DEGs were associated with“pyrimidine metabolism”, “nucleotide excision repair”, and“homologous recombination” (Fig. S2-a, b). After the freezing treatment, the “plant hormone signal transduction”,“phenylpropanoid biosynthesis”, and “biosynthesis of secondary metabolites” pathways were significantly enriched among DEGs(Fig.S2-c).
3.1.2.Differentially expressed genes following cold acclimation
After 28 days of cold acclimation at 4 °C, 271 TFs were identified and classified into 44 TF families (Table S3). Of 108 DEGs (|log2fold-change| >7), 75 (69%) were up-regulated(Table 1). Expression levels of nine genes encoding coldrelated proteins, including dehydrin and late embryogenesis abundant(LEA)proteins,were up-regulated.Expression levels of genes for diverse enzymes involved in the synthesis of carbohydrates, amino acids, and other primary metabolites were also significantly affected. Finally, a number of genes encoding the transcription factor, such as those for leucinerich repeat (LRR), and EF-hand proteins that regulate transcription efficiency of downstream defensive genes were identified. These results indicated that widespread changes to expression levels of specific genes were associated with cold acclimation.
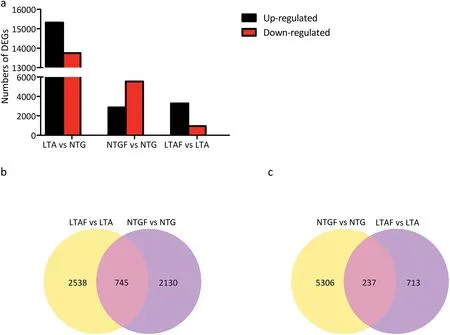
Fig.1-Overview of the transcriptome analysis.(a)Differentially expressed genes.(b)Venn diagram for the up-regulated genes after the-5 °C freezing treatment of LTA and NTG samples.(c)Venn diagram for the down-regulated genes after the -5 °C freezing treatment of LTA and NTG samples.

Table 1-Functional classification of DEG genes upon cold stress(|log2 fold-change| >7).
3.1.3. Differentially expressed genes following freezing treatment
Seventeen and 26 DEGs, mainly encoding Ca2+-binding proteins, calcineurin B-like proteins, and calcium-dependent protein kinases, were identified in the NTGF and LTAF samples, respectively, following freezing treatment (Table S4). A total of 107 genes with drastically modified expression in response to the freezing treatment were identified in the LTAF samples; 56 of them were also identified among NTGF samples as being responsive to freezing stress (Table S4).Freezing treatment altered the expression of seven genes encoding LRR proteins (five up-regulated and two downregulated)(Table S4).
LEA proteins are small protective hydrophilic proteins that act as molecular chaperones in protecting other proteins and stabilizing membrane structures in response to multiple stresses. These proteins have been divided into three groups according to the specific motifs. The second group, often referred to as the dehydrin group, participates in plant response to low temperatures. In the LTAF vs. LTA comparison, there were 51 LEA-related DEGs, 21 of which were associated with dehydrin.Similarly,19 and 13 DEGs related to LEA and dehydrin, respectively, were identified after freezing of NTG samples. All of these DEGs were up-regulated following the freezing treatment(Table S4).
We identified 359 and 509 differentially expressed TF genes in the NTGF vs. NTG and LTAF vs. LTA comparisons,respectively (Table S3). These genes were in >40 families,with AP2-EREBP (49 and 106 DEGs, respectively, in the two comparisons), MYB (36 and 29 DEGs), and NAC (38 and 30 DEGs) representing the most frequent families. The expression level of the gene encoding Novel06248,a CBF protein with an AP2 domain, was up-regulated >7-fold relative to the corresponding expression level in the control group. A phylogenetic analysis revealed that Novel06248 was closely related to CBF15 in Triticum monococcum(Fig. S3-a,b).
3.2. Metabolomic analysis
A metabolomic analysis was conducted to characterize the metabolites involved in cold stress response.Six hundred and eight known metabolites were identified in 15 samples (five crowns × three replicates)exposed to cold stress.Abundances of 60 and 28 metabolites were significantly different in the NTGF vs. NTG and LTAF vs. LTA comparisons, respectively(Tables S5 and S6). Eight metabolites (six with increased abundance and two with decreased abundance) that were common to both comparisons are listed in Table 2. Specifically, the ABA and Ja-L-Ile levels were 8.05- and 7.44-fold higher, respectively, in NTGF samples than in NTG samples,whereas they were 3.07-and 3.20-fold higher,respectively, in LTAF samples than in LTA samples. These results suggested the potential roles of distinct phytohormone metabolism,such as ABA and JA, in mediating plant low temperature tolerance in wheat plants.
A total of 223 metabolites differed in abundance between the LTA and NTG samples. These metabolites included 12 carbohydrates, 25 amino acids and amino acid derivatives, 13 plant hormones,51 flavonoids,and 22 organic acids and organic acid derivatives (Table S7). The largest cold-induced increase in abundance was for aspartic acid O-rutinoside (253.86-fold).Proline and tyramine levels were increased by 11.81-and 6.23-fold,respectively.In contrast,levels of aspartic acid,lysine,and ornithine were lower after cold treatment. Of the 12 analyzed carbohydrates, the abundance of 10 was higher following cold acclimation, including raffinose (129.44-fold), gluconic acid(42.64-fold), melezitose (24.93-fold), mannose (11.95-fold),maltotetraose (11.74-folds), trehalose (10.37-fold), fructose(10.29-fold),and lactose(8.75-fold).
3.3. Integration of the transcriptome and metabolome profiles
An integrated analysis of genes and metabolites responsive to low-temperature treatment revealed several common enriched pathways, including proline metabolism and phytohormone signaling. Proline participates in responses to low temperatures via its effects on osmotic adjustment.We observed that the proline content increased by 11.81-fold after the cold acclimation, mainly through the glutamate and ornithine pathways. Moreover, ornithine levels were lower and the expression level of the gene encoding ornithine aminotransferase (δ-OAT) was up-regulated. We speculated that all changes led to an increase in the downstream proline content (Fig. 2). We also detected extensive changes in the glutamate pathway,with induced proline synthesis by P5CS and P5CR. Analysis of RNA-seq data indicated that expression levels of seven genes functionally annotated as P5CS, were significantly up-regulated following the cold acclimation. Furthermore,the TRIAE_CS42_3B_TGACv1_221169_AA0732700 and TRIAE_CS42_3DL_TGACv1_249184_AA0840680 genes encoding P5CR exhibited cold-induced expression. Therewas a significantly decreasing trend in the expression of ProDH genes, which are mainly involved in the proline degradation pathway. To synthesize more proline in response to the cold acclimation,the expression levels of the δ-OAT, P5CS, and P5CR genes were up-regulated, whereas ProDH expression was down-regulated(Fig.2).
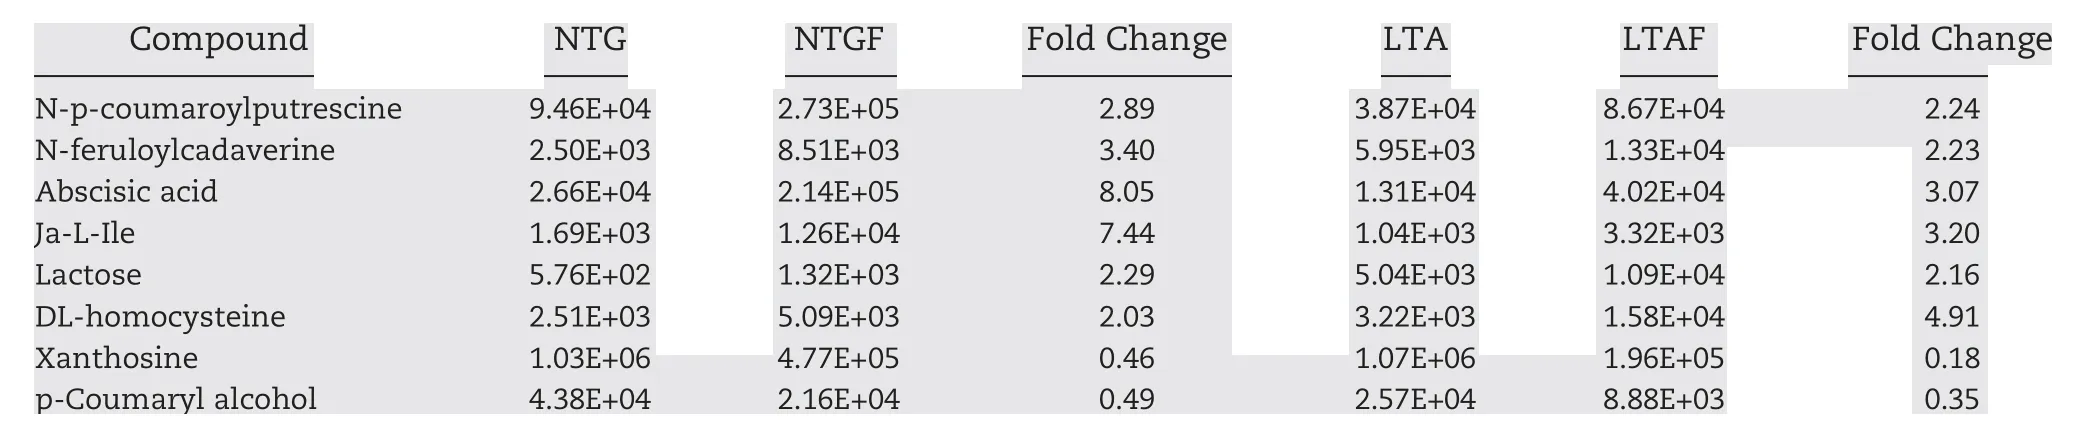
Table 2-Common metabolites identified in the LTA vs. LTAF and NTG vs.NTGF comparisons.
Metabolomic analysis revealed that the ABA contents were 8.05- and 3.07-fold higher in NTGF and LTAF samples (i.e.,after the 24 h freeze) than in NTG and LTA samples,respectively. There was up-regulated expression of gene TRIAE_CS42_1DL_TGACv1_061192_AA0188340 encoding ABA receptor PYR/PYL. PP2C expression was up-regulated in both comparison groups, with a larger fold-change for NTGF vs.NTG than for LTAF vs. LTA, consistent with the changes in ABA content (Fig. 3-a, b). Integrated analysis of the transcriptomic and metabolic data revealed that the JA pathway has a prominent role in response to cold stress (Fig.3-c, d). According to the RNA-seq data, expression levels of genes encoding JAZ (jasmonate ZIM-domain) were upregulated. Additionally, we detected five genes to be differential in both NTGF vs.NTG comparison group and LTAF vs. LTA comparison group (Fig. 3-c). The JA-Ile content was 7.44-and 3.20-fold higher in NTGF and LTAF than in NTG and LTA,respectively,implying that the JA pathway contributes to cold stress response in wheat(Fig.3-d).

Fig.2- Changes in gene expression levels and metabolite contents in the proline biosynthesis network of LTA and NTG samples. (a)Synthesis of proline biosynthesis via glutamate and ornithine.Red and blue indicate increased and decreased abundance,respectively,in response to cold acclimation.P5CS,delta-1-pyrroline-5-carboxylatesynthetase;P5CR,pyrroline-5-carboxylate reductase; δ-OAT,ornithine-oxo-acid transaminase;ProDH,proline dehydrogenase.(b) Metabolite abundances after cold acclimation.(c)Heat map of the relative expression levels of genes involved in the pathway.Numbers in parentheses represent fold-change after cold acclimation.LTA,low temperature acclimation;NTG,normal temperature growth.
3.4. Effect of exogenous ABA on cold tolerance
Application of exogeneous ABA significantly affected plant growth (plant height, stem diameter, and the dry weight of above ground parts) and enzyme (SOD, POD, and CAT)activities (Table S8, Fig. S4-a-c). Furthermore, Jing 411 and Shannong 20, grew best following 15 mg L-1ABA treatment,whereas Zhoumai 25, grew best after the application of 25 mg L-1ABA. These data indicated that wheat seedlings sprayed with exogenous ABA grew better than the control seedlings under cold conditions. Moreover, the cold-tolerant cultivar (Jing 411) displays much more sensitive to external ABA than the cold-sensitive cultivar(Zhoumai 25),suggesting the variety variation in external ABA response upon low temperatures in wheat. Together,the ABA treatments clearly mitigated the effects of low-temperature stress at the seedling stage,but the optimal concentration varied across cultivars.
3.5. Validation of gene expression by a qPCR analysis
The expression of 12 genes was validated in qPCR assays to verify the accuracy and reproducibility of the transcriptome profiles. The genes selected from literature encoded proteins associated with cold tolerance,including a protein kinase,PP2C(serine/threonine protein phosphatase 2C), a chlorophyll A/B-binding protein,dehydrin,a major intrinsic protein,and a heat shock protein[39-41].The expression levels of all selected genes changed considerably following cold acclimation and/or freezing.The expression patterns of these genes determined by the qPCR assays were similar to those obtained based on the RNA-seq,with correlation coefficients(R2) >0.87(Fig.4).
4. Discussion
An integrated transcriptomics and metabolomics analysis of wheat plants subjected to cold conditions revealed more insights into the cold-responsive DEGs and metabolite interaction networks than separate analyses. We determined that metabolites such as proline, carbohydrates, and hormones affected the responses of wheat to cold stress. Key candidate genes associated with low temperature-responsive were identified based on RNA-seq data,suggesting that these genes play important roles in the cold stress defensive system of wheat.

Fig.3-Freezing-induced changes in gene expression levels and metabolite contents in the ABA/JA signaling network revealed by LTAF vs.LTA and NTGF vs.NTG comparisons.The pathway in the center represents the ABA and JA regulatory networks.Red indicates increased abundance in response to freezing. (a,c)Heat maps of relative expression levels of genes commonly involved in this pathway. Numbers in parentheses are fold changes after freezing.(b, d)Metabolite abundances after the freezing in NTGF vs. NTG and LTAF vs. LTA comparisons.
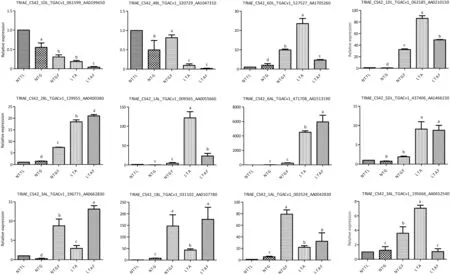
Fig.4-Expression patterns of 12 selected genes in four samples assessed by qPCR.Bars represent means ± SE(n = 3).Different letters indicate significant differences among treatments(P ≤.05).
In the current study, the proline content in wheat crowns increased by 11.81-fold after the cold acclimation. The expression levels of P5CR and P5CS, which are involved in the glutamate pathway, were up-regulated and expression of the genes mediating aminobutyric acid synthesis via this pathway was down-regulated. However, there was no significant change in the aminobutyric acid content. These results suggested that glutamate positively affects the synthesis of proline, but not aminobutyric acid, in wheat seedling crowns during response to low-temperature stress.Increased expression of δ-OAT indicated that the ornithine proline synthesis pathway was induced by cold conditions. Increases in gene expression levels in the ornithine pathway were less than in the glutamate proline synthesis pathway during cold acclimation. However, ornithine is also involved in proline synthesis. Thus, as reported previously [42], screening for increased ornithine synthesis in response to cold stress could be useful in identifying cold-resistant wheat cultivars.
Abscisic acid binds to PYP/PYL and promotes interaction with PP2C, thereby inhibiting PP2C activity, which activates the protein kinase SnRK2. Activated SnRK2 phosphorylates downstream TFs, ultimately leading to an ABA signal response [43]. Our metabolic profiling results revealed that the ABA content increased by 8.05-and 3.07-fold in the NTGF and LTAF samples, respectively, but decreased after the cold acclimation.Klára et al.[44]reported a sharp increase in ABA content in winter wheat cultivar ‘Samanta' and spring wheat cultivar ‘Sandra' one day after initiating a cold treatment;however,the ABA level gradually decreased after day 3.In the current study, PP2C expression was up-regulated in response to freezing, possibly because ABA induces the expression of PP2C that regulates the SnRK2 activity and triggers ABA signaling. The enhanced cold tolerance resulting from the application of exogenous ABA strongly suggests that ABA has a prominent role in cold stress response in wheat.
When subjected to abiotic stresses, plants produce enough JA to synthesize JA-Ile,which promotes interaction between JAZ and SCFCOI1. This interaction ultimately results in ubiquitination and degradation of JAZ and the release of transcriptional activators responsive to cold stress [45]. The JA-Ile content was 7.44-and 3.20-fold higher in NTGF and LTAF than in NTG and LTA,respectively,thus enabling it to mediate downstream responses to cold stress.Additionally,the changes to ABA and JA-Ile contents were smaller in LTA samples than in NTG samples, possibly because the cold acclimation increases cold tolerance. The mechanisms related to modified ABA and JA-Ile contents in cold-challenged plants need to be further characterized.
Transcription factors as key regulators of transcription are important in plant responses to low temperatures. Our transcriptome analysis revealed that members of >40 TF families are responsive to cold stress. Of the analyzed TF genes,the expression levels AP2-EREBP family genes were the most and third-most affected under freezing and the cold acclimation, respectively (Table S3). Additionally, CBF, which belongs to the AP2/ERF domain family,regulates COR expression in many plants, including barley [46]and wheat [47].Vágújfalvi et al. [47]reported that the cold-regulated transcriptional activator CBF3 positively regulates cold stress responses in wheat. CBF3 is linked to the frost-tolerance gene Fr-A2 on wheat chromosome 5A. By analyzing RNA-seq data, we determined that the expression of Novel06248 was considerably up-regulated in the NTGF vs. NTG and LTAF vs.LTA comparisons. Furthermore, the encoded protein, which includes an AP2 domain, is a close homolog of CBFs in other plant species. We renamed Novel06248 as TaCBF15A. Our hypothesis that this gene is response to cold conditions needs to be experimentally verified.
Prolonged exposure of plants to stress conditions increases simple carbohydrate levels and decreases starch contents[48],most likely because sugars serve as the energy source for the production of lipids, amino acids, membrane components, and other molecules, that affect membrane integrity and structure [49,50]. In the current study, the abundance of several simple carbohydrates, such as raffinose,trehalose,maltotetraose,mannose,and fructose,were higher following cold acclimation. Some of these carbohydrates had not been widely reported to be associated with cold stress response. Following cold treatment, raffinose content was increased 129.44-fold, representing the maximum increase among all carbohydrates following cold acclimation. Etsuo et al. [51]confirmed that TaGolS1 and TaGolS2 expression levels increased in response to lowtemperature stress and that transgenic plants overexpressing these genes accumulated more galactinol and raffinose than wild-type plants, thereby enhancing cold tolerance.However, we did not detect any obvious changes in simple carbohydrate levels in wheat crowns directly exposed to freezing for 24 h, probably because accumulation occurs slowly and explaining why acclimation is necessary for increased resistance to freezing conditions.
5. Conclusions
In summary, integration of transcriptomic and metabolomic data revealed important information regarding the regulatory networks underlying plant responses to cold stress. In the current study, we confirmed that the proline-synthesis pathway (via the glutamate and ornithine pathways) and ABA and JA-Ile signal transduction pathways are involved in the response of wheat plants to cold acclimation and freezing.Future studies of these networks will provide further insights in adaptation of wheat to low temperatures.
Supplementary data for this article can be found online at https://doi.org/10.1016/j.cj.2019.09.002.
Acknowledgments
This work was supported by the National Key Research and Development Program of China (2017YFD0101000) and the Technology Innovation of Winter Wheat of Science and Technology Planning Project of Hebei Province (16226320D).We thank Dr. Hongjie Li, Institute of Crop Sciences, Chinese Academy of Agricultural Sciences for critically reading and editing the manuscript.
- The Crop Journal的其它文章
- Positional cloning of PmCH1357 reveals the origin and allelic variation of the Pm2 gene for powdery mildew resistance in wheat
- The Crop Journal 作物学报(英文版) (Started in 2013, Bimonthly)
- Wheat powdery mildew resistance gene Pm64 derived from wild emmer(Triticum turgidum var.dicoccoides) is tightly linked in repulsion with stripe rust resistance gene Yr5
- Wheat breeding in northern China: Achievements and technical advances
- Breed ing w heat for resistance to Fusarium head blight in the Global North: China,USA,and Canad a
- Pyramiding disease resistance genes in elite winter wheat germplasm for Western Canada