
Rapid bioluminescence assay for monitoring rat CES1 activity and its alteration by traditional Chinese medicines
2020-07-02 01:59JunZhngDndnWngLiweiZouMinXioYufengZhngZiweiLiLingYngGungoGeZhongZuo
Jun Zhng,Dndn Wng,Liwei Zou,Min Xio,Yufeng Zhng,Ziwei Li,Ling Yng,Gungo Ge,Zhong Zuo,*
aSchool of Pharmacy,Faculty of Medicine,The Chinese University of Hong Kong,Hong Kong,China
bInstitute of Interdisciplinary Medicine,Shanghai University of Traditional Chinese Medicine,Shanghai,201203,China
Keywords:
Traditional Chinese medicines
Carboxylesterase 1(CES1)
NLMe
Bioluminescence assay
Biomatrice in rats
ABSTRACT
In traditional Chinese medicine herbs(TCM),including Radix Salviae Miltiorrhizae(Danshen),Radix Puerariae Lobatae(Gegen),Radix Angelicae Sinensis(Danggui),and Rhizoma Chuanxiong(Chuanxiong)are widely used for the prevention and treatment of cardiovascular diseases and also often co-administered with Western drugs as a part of integrative medicine practice.Carboxylesterase 1(CES1)plays a pivotal role in the metabolisms of pro-drugs.Since(S)-2-(2-(6-dimethylamino)-benzothiazole)-4,5-dihydrothiazole-4-carboxylate(NLMe)has recently been identified by us as a selective CES1 bioluminescent sensor,we developed a rapid method using this substrate for the direct measurement of CES1 activity in rats.This bioluminescence assay was applied to determine CES1 activity in rat tissues after a two-week oral administration of each of the four herbs noted above.The results demonstrated the presence of CES1 enzyme in rat blood and all tested tissues with much higher enzyme activity in the blood,liver,kidney and heart than that in the small intestine,spleen,lung,pancreas,brain and stomach.In addition,the four herbs showed tissue-specific effects on rat CES1 expression.Based on the CES1 biodistribution and its changes after treatment in rats,the possibility that Danshen,Gegen and Danggui might alter CES1 activities in human blood and kidney should be considered.In summary,a selective and sensitive bioluminescence assay was developed to rapidly evaluate CES1 activity and the effects of orally administered TCMs in rats.
1.Introduction
Carboxylesterase(CES)belongs to a widespread α,β-hydrolasefold superfamily of proteins.This superfamily shares a highly conserved catalytic triad of amino acid and plays a pivotal role in the biotransformation of a wide variety of endogenous and exogenous compounds,including esters,thioesters,carbamates,and amides to their corresponding free acids and alcohols[1].It has been noted that about 20%of drugs and 50%of prodrugs are metabolised by CES[2].The main CES isozymes involved in drug metabolism are CES1 and CES2,both of which are expressed extensively in human,dog,and rat liver[3,4].In human liver,CES1(hCE1)contributes about 80-95%of the total hydrolytic activity[5].In rat liver,the dominant CES1 family includes four different isozymes:hydrolase A,hydrolase B,hydrolase C and rat egasyn,among which hydrolase A is the closest in catalytic function to human hCE1,with about 78%sequence similarity[6,7].
Four traditional Chinese medicine(TCM)herbs,Radix Salviae Miltiorrhizae(Red sage root,Danshen,DS)[8-10],Radix Puerariae Lobatae(Kudzu root,Gegen,GG)[10-12],Radix Angelicae Sinensis(Angelica root,Danggui,DG)[9,13]and Rhizoma Chuanxiong(Szechuan lovage rhizome,Chuanxiong,CX)[9,13]are widely used for the prevention and treatment of cardiovascular diseases.Thus,they have a high potential to be co-administered with Western drugs[9,12].For instance,in a real-world study of 84,697 patients with coronary heart disease,43.46%of patients in antiplatelet therapy also took TCMs at the same time[14].In addition,TCM was used with P2Y 12 receptor inhibitors,such as clopidogrel or ticagrelor,to minimize adverse effects,drug intolerances,thrombotic risk,and socioeconomic issues[15,16].The effect of TCM herbs on rat CES1 activity in blood and tissue S9 fractions has not been addressed.Our recent findings suggested that co-administration of GG and DG could lead to altered pharmacokinetics of clopidogrel and aspirin with significant inhibition of CES activity[17].Considering that CES serves as the major hydrolysing enzyme for a large number of drugs,especially pro-drugs such as enalapril,oseltamivir and clopidogrel[18],and that the pharmacokinetics of drugs determined by preclinical experiments in rats are widely used as a reference for clinical studies,further clarification of the distribution of CES1 and the tissue-specific impact of TCMs on CES1 activity in rats is needed not only for interpretation of preclinical drug pharmacokinetics but also for the safe use of drugs in the practice of integrative medicine.
In modern TCM practice Chinese materia medica(CMM)formula granules have become popular as an alternative to decoction preparations.Since these granules not only retain the properties but also address the common problems of quality control,preparation,and administration,their clinical use has gradually increased worldwide.In China there are more than 600 types of herb granule preparations and 200 kinds of herbal formulae[19].In addition,there are more than 400 herbal granule preparations in Japan[20]and 300 types in South Korea[21].A recent review of 56 clinical trials demonstrated no significant difference in effectiveness and safety between granules and decoctions of Chinese herbal medicine[22].Thus,herbal granule preparations of the four studied TCMs were adopted for our current study.
The activity of CES is measured as the reduction of a specific substrate or formation of its respective metabolites during a given time using recombinant CES enzymes,liver microsomes,S9 fractions and plasma from different species.Activity is measured by photometric assay, fluorometric assay, and chromatography assay to detect a signal generated by the substrates or the products formed [23-26]. In these methods, p-nitrophenyl acetate, p-iodonitrophenyl tetrazolium violet, butanilicaine, acyl-CoA, 5,5′dithiobis-(2-nitrobenzoic acid), phenacetin, acetanilide and clopidogrel are substrates commonly used. In our previous study we reported two selective sensors (2-(2-benzoyloxy-3-methoxyphenyl)benzothiazole) (BMBT) and (S)-4,5-dihydro-2-(6-hydroxy-2-benzothiazolyl)-4-thiazolec arboxylic acid-methyl ester (DME), both of which could be used for the quantitative detection of hCE1 activity in human liver microsomes [26,27].However, it was found that the BMBT-based fluorescent assay suffered from strong background interference and potential phototoxicity. Based on the chemical structure backbone of BMBT and DME, (S)-2-(2-(6-dimethylamino)-benzothiazole)-4,5-dihydro-thiazole-4- carboxylate (NLMe), a newspecific substrate of hCE1 with minimum background interference and nophototoxicitywasdeveloped and the synthesis method, identification and application of NLMe and its hydrolysed product (S)-2-(2-(6-dimethylamino)-benzothiazole)-4,5- dihydro-thiazole-4-carboxylic acid (NL) were reported in our previous studies [27-29]. The design of NLMe as a bioluminescent sensor for detecting enzyme activity was based on the strategy that the firefly luciferin-luciferase reaction is the most important and widely used system in bioluminescence detection, and the free luciferin can be masked with distinctive substitutes [29]. NLMe is an ester derivative of luciferin that contains a large carboxyl group and a small alcohol group and thus may serve as a good substrate for CES1, as CES1 preferentially hydrolyses substrates with small alcohol groups and large acyl groups, while CES2 prefers substrates with large alcohol groups and small acyl groups [30]. NLMe was found to be a specific substrate for CES1 and could be specifically metabolised by hCE1 to NL, while other hydrolases such as acetylcholinesterase, butyrylcholinesterase, human paraoxonase 1, human paraoxygen phosphate 2, carbonic anhydrase, bovine albumin, lipase, C-reactive protein, myoglobin, transgenic ferritin, lysozyme, pepsin, trypsin, human albumin, prion protein, human carboxylesterase 2 and phosphate buffer could not catalyze the reaction. The hydrolysis of NLMe in liver microsomes could be suppressed markedly by the specific carboxylesterase inhibitor BNPP but not by other esterase inhibitors such as piperazine, huperzine A, galantamine and ethylenediamine tetraethylammonium[28]. The rate of NLMemetabolism in microsomes from human lung, kidney, intestine and liver in a preliminary bioluminescent test was found to be consistent with hCE1 expression in the corresponding microsomes by Western blot assay, demonstrating the specificity of NLMe as a substrate for CES1 [28]. The current study further develops and validates a comprehensive bioluminescence assay using NLMe as a probe for direct detection of CES1 activity in different biomatrices such as plasma and various tissues in rats. Based on this assay the distribution profile of CES1 activity was obtained, providing important information for the preclinical development of pro-drugs and also enabling us to directly monitor CES1 activity and changes due to drug and/or herbal treatment, thereby facilitating better prediction of herb/drug interactions to ensure their safe use.
2.Experimental
2.1.Materials and instruments
NLMe and NL(Fig.1)were synthesized by our group with a purity of>98%.Phosphate buffered saline(PBS)tablets,a Bicinchoninic Acid(BCA)Protein Assay kit and rat liver microsomes(RLM)were purchased from Sigma-Aldrich(St.Louis,MO,USA).Luciferin detection reagent(LDR),a product of Promega Corporation(Madison,WI,USA),was prepared by adding reconstitution buffer to the lyophilized luciferin reagent and gently swirling to dissolve.Rehydration of the reagent at room temperature for 1 h before use was necessary.Bis-p-nitrophenyl phosphate(BNPP),fluoxetine and loperamide were purchased from TCI(Tokyo,Japan).Ultrapure water was generated by a Milli-Q ultrapure water system from Millipore(Milford,MA,USA).Nunc™F96 white polystyrene plates were from Thermo Scientific(Rockford,IL USA).Ultra-Turrax T25 Disperser(IKA,Boutersem,Belgium)and a CT15RT versatile refrigerated centrifuge(Techcomp Ltd.,Shanghai,China)were used in the animal study.A CLARIOstar®microplate reader(BMG LABTECH,Ortenberg,Germany)was used for total protein concentration determination and bioluminescence assay.
The CMM granules of DS(Batch No.1007),GG(Batch No.1027),CX(Batch No.1019)and DG(Batch No.1017)were kindly provided by PuraPharm International Limited(Hong Kong).The herb to herbal granule concentration ratio was 5:1 for DS granules,GG granules,CX granules,and 3:1 for DG granules.The contents of the represented bioactive marker compounds in the granules were determined in our previous study[17]as follows:25 mg/g salvianolic acid in DS granule,114 mg/g puerarin in GG granule,0.63 mg/g Ferulic acid in DG granule and 1.81 mg/g Ferulic acid in CX granule.Specific quality controls were strictly followed as is described for the four selected TCM herbs in both the Chinese Pharmacopoeia of the People’s Republic of China[31]and the Hong Kong Chinese Materia Medica Standards[32].The voucher specimens for the four herbal granules were kept in the School of Pharmacy,the Chinese University of Hong Kong,China.
2.2.Development and validation of the bioluminescence assay
2.2.1.Verification of NLMe as CES1 substrate in rat plasma

Fig.1.Structure and MS/MS spectra of(A)NLMe and(B)NL.
In contrast to the lack of CES in human plasma,high expression of CES in rat plasma has been reported[33].Since NLMe had been demonstrated to be a selective hCES1 substrate,to validate the specificity of NLMe towards CES1 in rat plasma,potential inhibition assays of various CES inhibitors on NLMe hydrolysis were conducted in blank rat plasma.Assessment was done by comparing activity in the presence or absence of various reported CES inhibitors including BNPP(a general CESs inhibitor)[34], fluoxetine(a selective CES1 inhibitor)[35]and loperamide(a selective CES2 inhibitor)[36].The study was conducted in a 96-well microplate in a total volume of 100μL.BNPP was dissolved in dimethyl sulfoxide,and fluoxetine and loperamide were dissolved in ethanol to obtain stock solutions with a concentration of 40 mM.Serial dilutions with PBS(100 mM,pH 7.4)were done to achieve solutions of 0.5,1.0,2.0,3.9,7.8,15.6,31.3,62.5,125 and 250 μM.A 25 μL volume of the diluted solution was pre-incubated with 25μL of rat plasma(protein concentration of 4 μg/mL)at 37℃ for 60 min and then 25 μL of NLMe solution(500 ng/mL)was added to initiate the reaction.Ten min after incubation at 37℃ the reaction was terminated by adding 25μL of LDR.After another 20 min incubation of the mixture,the bioluminescent signals generated were measured with the CLARIOstar®microplate reader to measure CES1 activity.Solvent vehicles and control samples without the inhibitors were also employed.The residual activity(%)representing the percentage of CES1 activity from different treatment groups compared to that of the control was obtained and compared.To evaluate the inhibitory effects of CES inhibitors such as BNPP and fluoxetine,a halfmaximal inhibitory concentration(IC50)was estimated based on their concentration-response curves using GraphPad 7.0 software(GraphPad Software Inc,San Diego,CA,USA).
2.2.2.Determination of NL by the bioluminescence assay
As illustrated in Fig.2,NLMe could be hydrolysed by CES1 to NL,which served as a specific substrate of luciferase and could be quantified by measuring the bioluminescence generated from reactions with LDR.Brie fly,to a 25μL aliquot of NL standard solution,50μL of PBS(100 mM,pH 7.4)was added followed by incubating the mixture at 37℃ with gentle shaking for 10 min.Subsequently,25μL of LDR was added to the reaction mixture followed by a 20 min incubation at 37℃.The bioluminescent signals generated were measured with the CLARIOstar®microplate reader.
2.2.3.Validation of the bioluminescence assay
The developed bioluminescence assay was validated for specificity,linearity,precision,accuracy and robustness.Specificity of the assay was assessed by detecting possible interference via scanning the emission spectra of NLMe,NL and enzyme(RLM)reaction mixtures.Linearity was evaluated by analysing standard solutions of NL at concentrations of 15.62,31.25,62.5,125,250,500 and 1000 ng/mL in triplicate;the standard solutions were freshly prepared by serial dilutions of 2 mg/mL NL stock solution with 100 mM PBS buffer.The bioluminescent signals were plotted versus NL concentration and the calibration equation was obtained using weighted linear regression analysis.The limit of detection(LOD)and limit of quantification(LOQ)were respectively calculated using the slope(S)of the calibration curve and the standard deviation of response(σ)with the following formulas:LOD=3.3 σ/S and LOQ=10σ/S.Precision was evaluated by intra-and inter-day precision and expressed as the relative standard deviation(RSD%).Intra-day precision was evaluated by performing three repeated analyses of NL standard solutions at concentrations of 125,500 and 1000 ng/mL on the same day.As for inter-day precision,the same analyses were performed on three different days.Accuracy was expressed as a percentage of deviation between the nominal and measured concentrations of the sample with±15%as acceptance criteria.

Fig.2.Illustration of the current CES1 mediated enzymatic reaction of NLMe and bioluminescent assay of the formed NL.
Since the assays were all performed in 96-well microplates,robustness assessment was conducted on three days with three plates processed each day.Each plate layout consisted of NL standard solutions at 125,500 and 1000 ng/mL to mimic the low,middle and high bioluminescent signals,respectively.The low,middle and high signal samples were distributed within the plates in an interleaved-signal format with different column-wise order:high-middle-low for plate A,low-high-middle for plate B and middle-low-high for plate C(n=32).The signals measured were then used to calculate the coefficient of variations(CV),signal window(SW)and Z’value for robustness assessment(see Supplementary Information:S1)[37].
2.3.Evaluation of CES1 activity after oral administration of selected TCM herbs with the bioluminescence assay
2.3.1.Animal treatment
To evaluate the effects of selected TCM herbs on CES1 activities in rats,thirty male Sprague Dawley rats(12-14 weeks,150-200 g)were randomly divided into nine groups(G1 to G9,n=6 for G1,n=3 for G2-G9).G1 served as the control group,in which rats were orally administered 1 mL saline twice a day for 14 days,while rats in G2 toG9 received a human equivalent dose of herbal granules twice a day for 14 days.
Based on the recommended human dose(60 kg per person)for the four herbs(DS dried herb:10-15 g;GG dried herb:10-15 g;DG dried herb:6-12 g;and CX dried herb:3-10 g)[31]and the dose correction factor for rats based on body surface area as recommended by the US FDA[38],the equivalent herbal doses in rats(g/kg)were calculated to be 1.03 g/kg of DS(G2,DSL),1.55 g/kg of DS(G3,DSH),1.03 g/kg of GG(G4,GGL),1.55 g/kg of GG(G5,GGH),0.62 g/kg of DG(G6,DGL),1.24 g/kg of DG(G7,DGH),0.31 g/kg of CX(G8,CXL)and 1.03 g/kg of CX(G9,CXH).Based on the herb to herbal granule extraction ratio provided by the manufacturer(5:1 for DS granules,GG granules and CX granules;3:1 for DG granules),doses of the CMM granules in each treatment group were calculated to be:0.21 g/kg of DS granule(G2,DSL),0.31 g/kg of DS granule(G3,DSH),0.21 g/kg of GG granule(G4,GGL),0.31 g/kg of GG granule(G5,GGH),0.21 g/kg of DG granule(G6,DGL),0.41 g/kg of DG granule(G7,DGH),0.062 g/kg of CX granule(G8,CXL)and 0.21 g/kg of CX granule(G9,CXH).The selected amount of each herbal granule was suspended in 30 mL warm water followed by 30 min sonication at room temperature to prepare a stock solution of 0.0441 g/mL for DSL,GGL,DGL and CXH,0.0651 g/mL for DSH and GGH,0.0882 g/mL for DGH,and 0.0130 g/mL for CX(based on a 210 g rat).The final oral gavage volume of the stock solution for each rat(ranging from 0.4 to 0.8 mL)was further adjusted based on body weight.
All the animal experiments were carried out after approval by the Animal Ethics Committee of The Chinese University of Hong Kong(Ref No.14-171-MIS)and Sprague Dawley rats were supplied by the Laboratory Animal Service Centre at The Chinese University of Hong Kong.
2.3.2.Sample collection and treatment
Blood samples were collected on Day 0,Day 2,Day 4,Day 6,Day 8,Day 10,and Day 12 from the tail vein of each rat.On day14 all rats were killed 2 h after their last dosing,blood was sampled via cardiac puncture,and the heart,liver,kidney,spleen,lung,pancreas,intestine,brain and stomach were collected after quick cardiac perfusion with 200 mL saline.Plasma samples were separated from blood by immediate centrifugation at 8000g for 3 min.Plasma and all collected tissue samples were frozen at-80℃.To prepare S9 fractions of each collected tissue,the frozen tissues were thawed in ice-cold homogenization buffer(0.1 mM Tris-HCl,10 mM EDTA and 150 mM KCl)and then homogenized in an ice-water bath.The homogenates were then centrifuged at 10,000 g for 20 min at 4℃ to obtain the supernatants(S9 fractions)with storage at-80℃.The total protein concentration of the plasma and prepared S9 fractions was determined with the microplate reader using a BCA protein assay kit as described in the technical bulletin accompanying the kit.
2.3.3.CES1 activity determination by the bioluminescence assay
CES1 activity in the biomatrices was determined by the formation of NL from NLMe in an optimized incubation system.In brief,25μL sample solutions with optimum protein concentrations were pre-incubated in 25 μL PBS(100 mM,pH 7.4)at 37℃ with gentle shaking for 10 min.Thereafter the reactions were initiated by adding 25μL NLMe(500 ng/mL)and further incubated for 10 min.Finally,the CES1 activity of the S9 fraction samples obtained from section 2.4.2 was expressed as the formation rate of NL by the newly developed bioluminescence assay.
2.4.Data analyses
To determine CES1 activity,background bioluminescent signals obtained from control samples(n=3)containing NLMe and PBS were subtracted from the signals obtained from the biomatrix samples.Data are presented as mean±SD(standard deviation of mean)of three independent experiments.To compare the CES1 activity between different treatment groups,Welch’s t-test was used with a p<0.05 considered statistically significant.
3.Results and discussion
While changes in enzyme activity are not always the result of changes in enzyme levels[39],changes in expression are the most common means by which cells regulate enzyme activity.The bioluminescence assay developed here allows the rapid determination of CES1 enzyme activity in a variety of tissues,preparations,blood and plasma.To ensure that changes in activity were normalized to protein content in each biomatrice,the protein concentration of each biomatrix sample was determined by BCA assay.An optimized protein concentration for determining CES1 activity was selected for each tissue or blood sample based on the linear range and the intensity of the signal response by using a plot of protein concentration versus the luminescent signal produced by NLMe hydrolysis.With this optimized protein concentration for each plasma/tissue,the CES1 activity of each organ was determined as the NL formation rate after adjustment of the protein concentration(mM/mg protein/min).
In previous studies photometric,fluorometric and chromatography methods were utilized to measure CES activities[23-26].The photometric assay was considered to be simple and rapid(1 or 2 min)but lack of specificity for CES1 activity was a problem[23].The fluorometric assay using a fluorescent probe for hCE1 provided high sensitivity with a LOD of 1.29 ng/mL,but suffered from interference caused by impurities and the instability of products when exposed to light[26].The chromatographic analyses using HPLC or UPLC are selective and sensitive but time-consuming,requiring up to 30 min for each sample run[25,26].Our newly developed bioluminescence assay has the advantages of a simpler procedure,a stable signal,shorter sample analysis time and lower cost.In addition,the current method provides higher selectivity and sensitivity with an LOD as low as 1.15 ng/mL,8-fold more sensitive than our previously reported DME-based bioluminescent method(LOD of 10 ng/mL)[27].We have applied this CES1 activity assay to measure changes in CES1 activity in rat biomatrices after TCM treatment.
Species variation exists for almost every enzyme including CES.Previous reports based on substrate levels changes have demonstrated species variations in CES activities.For example,for the prodrug diethylene triamine pentaacetic acid the degree of its CES-mediated hydrolysis and resultant metabolic profile in human and dog liver S9 fractions were vastly different from that in rats[40].significant variation in clopidogrel hydrolysis in different species as determined by the formation rate of the inactive metabolite clopidogrel carboxylic acid also was noticed[41].Since changes in substrate levels could result from metabolic pathways other than CES-mediated hydrolysis,it is expected that our bioluminescence assay will provide more accurate and direct monitoring of CES activity changes.
3.1.Bioluminescence assay development and validation
3.1.1.Optimization of the bioluminescence assay conditions and method validation
The maximum bioluminescent emission wavelength of NL and the enzymatic reaction solution were both at 618 nm with no bioluminescent signal interference from NLMe(Fig.3A),indicating that the determination method was specific.Since a 20 min incubation generated the strongest signal,stable for up to 50 min,it was considered the optimum incubation time(Fig.3B).It was also found the intensity of the bioluminescent signal generated was proportional to NL concentration up to 1000 ng/mL at the studied three incubation temperatures,with 37℃ generating higher signal intensity than 25℃ and 30℃.Thus,incubation at 37℃ was selected for sample analyses(Fig.3C).
Analysis of CES1 activity using the bioluminescence assay required a standard curve plotting the bioluminescence intensity against the corresponding NL concentration.A weighted(1/x weighting)least squares linear regression model was adopted to obtain a calibration curve.The relationship between bioluminescence intensity and NL concentration was linear over its concentration range of 15.63-1000 ng/mL with a squared Pearson correlation coefficient(r2)of 0.9996.The calculated LOD and LOQ of NL were 1.15 and 3.48 ng/mL respectively,demonstrating exceptional sensitivity for the current assay.Table 1 shows that the accuracy and precision determined at the three concentration levels of NL on three different days were all within 15%,confirming the reliability of the developed assay.The robustness evaluations were based on plate uniformity and signal variability assessment.Table 2 indicates that CV values were all less than 20%,SW and Z’values were all no less than 2 and 0.4 respectively,verifying that the assay was reliable with sufficient robustness.
3.1.2.Optimization of CES1 enzymatic reaction conditions

Fig.3.Optimization of the bioluminescent assay with demonstrations of(A)bioluminescent spectra(400-700 nm)of NL(500 ng/mL),NLMe(500 ng/mL)and incubation mixture of enzyme(RLM,2μg/mL),relationships between bioluminescent intensity and(B)incubation time(0-90 min)and(C)NL concentrations and incubation temperatures(25℃,30℃ and 37℃).
CES1 activity was evaluated by determining the rate of CES1-mediated NLMe hydrolysis,which was a substrate of luciferin and could generate bioluminescence during reaction with LDR(Fig.2).Serial dilution samples of in vitro enzymatic reactions were conducted to optimize the conditions.As shown in Fig.4A,the percentage of NLMe consumption increased linearly when the protein concentration of RLM was lower than 16μg/mL and tended to reach a plateau when it was higher than 40μg/mL.Based on the obtained linear range and the intensity of signal response,2μg/mL protein concentration was considered to be sufficient for the enzymatic reaction.Similarly,protein concentrations were optimized for the plasma samples(4μg/mL)and S9 samples of heart(20μg/mL),liver(6 μg/mL),kidney(10 μg/mL),spleen(50 μg/mL),lung(20 μg/mL),pancreas(10 μg/mL),intestine(20 μg/mL),brain(50 μg/mL)and stomach(30μg/mL).Under the above optimized reaction conditions,the enzyme hydrolysis reaction was found to be very quickwith the NL formation rate stabilized after 10 min(Fig.4B).Therefore,10 minwas considered as the optimum reaction time.On the other hand,the NL formation rate increased linearly when the substrate NLMe concentration increased from 7.81 ng/mL to 500 ng/mL(Fig.4C).In order to maximize the generated signal without affecting the linearity of the response,500 ng/mL of NLMe was selected as the optimum substrate concentration.

Table 1 Accuracy and precision of the developed assay(mean±SD,n=3).

Table 2 Robustness of the developed assay in 96 well-plates.
3.1.3.Verification of the selectivity of NLMe for CES1 in rat plasma
To further validate the selectivity of NLMe for CES1 in rat plasma,an inhibition assay of various carboxylesterase inhibitors was performed.As shown in Fig.5,among the selected compounds,both BNPP and fluoxetine exhibited a significant inhibitory effect on the hydrolysis of NLMe with an IC50of 5.1 μM and 2.6 μM,respectively.Loperamide,the selective CES2 inhibitor,demonstrated no effect on NLMe hydrolysis at its final concentrations up to 62.5μM,further suggesting the specificity of NLMe as CES1 substrate.
3.2.Impact of orally administered TCMs on CES1 activity in rats
3.2.1.Effect of TCM treatment on CES1 activity in plasma and different tissues
Understanding the tissue distribution of CES isoenzymes is critical for predicting CES-mediated metabolism of drugs.Usingour developed bioluminescent method,we measured the expression of CES1 in rat plasma and major tissues after a two-week administration of selected TCMs.In the current study CES1 activity in S9 fractions instead of microsomal fractions was monitored.Notably,S9 fractions contain both microsomal and cytosolic fractions and CES1 enzymes have been found to be highly expressed in both human and rat liver cytosol[42].
As shown in Fig.6,the CES1 enzyme was found in plasma and all tested tissues including heart,liver,kidney,spleen,lung,pancreas,intestine,brain and stomach.Consistent with previous reports[43,44],CES1 enzyme expression in liver,kidney and plasma was found to be higher than that in the small intestine.In addition,CES1 activity was detected in heart and brain.In summary,CES1 activity in plasma,heart,liver and kidney was much higher than that in spleen,lung,pancreas,intestine,brain and stomach.Furthermore,the effect of two-week TCM treatment(except for DSL and DSH groups)on rat CES1 activity proved to be tissue-specific:in the GGL group a significant increase was found in lung and in the GGH group no significant differences were found.Moreover,a significant decrease in CES1 activity was found in the kidney in both the DGL and DGH groups.In the DGL group CES1 activity tended to decrease in plasma and all assayed tissues,but without statistical significance.In the DGH group significantly decreased CES1 activity was also found in the spleen.Finally,significant increases in CES1 activity were found in the lung in both the CXL and CXH groups,while CES1 activity significantly decreased in spleen in the CXH group.Such tissue-specific alterations in CES1 activity with different TCM treatments could be due to differing tissue distribution of the TCM components that affect CES1 expression or activity.It has been reported that tanshinone from Salvia miltiorrhiza(DS)[45]and flavonoids such as baicalin,baicalein,chrysin and galangin can inhibit CES[46].
In our previous study[17]the impacts of these herbs on rat liver CES1 activity after co-administration with clopidogrel and aspirin were studied.Similar findings were observed after administration of DSL,DSH,GGL,DGL,DGH and CXL.However,instead of decreased CES1 activity in liver,increased CES1 activity was found for both GGH and CXH in this current study.Such discrepancies could be due to the different approaches adopted for CES1 activity determination.Our previous study used clopidogrel as the probe substrate for CES1,whereas the current study utilized a more specific and direct measurement for CES1 activity.NLMe used in our current study was a specific substrate hydrolysed only by the CES1 enzyme,whereas clopidogrel used in our previous study had two competitive metabolic pathways:a primarily pathway for hydrolysis by hCE1 to clopidogrel carboxylic acid and a secondary oxidation pathway by CYP enzymes to clopidogrel thiolactone,which could then be hydrolysed to the carboxylic acid of thiolactone by hCE1[47].Our current bioluminescence assay has greater specificity as well as direct monitoring of CES1 activity,making the altered CES1 activities after TCM treatment in vivo more relevant.
3.2.2.Rat plasma CES1 activity changes during the two-week TCM treatment
Based on the high expression level of CES1 in rat plasma,blood samples from all treatment groups were collected every two days until Day 14 to monitor the changes in CES1 activity during the treatment period(Fig.7).Plasma CES1 activity changes during the 14 days of treatment are shown in Fig.7A.For fair comparison of the rat plasma CES1 activity changes by different orally administered TCMs during the two-week treatment,the fold-change in CES 1 activity is expressed relative to Day 0,based on which z-scores(see Supplementary Information:S2)were calculated for the plot of a heatmap(Fig.7B).
As shown in Fig.7A,compared to that in control group,the plasma CES1 activity in DSL,DSH,GGL and GGH-treated groups was mostly decreased during the period of treatment with significant decreases observed in the DSL,DSH and GGL groups on Day 8,suggesting that long-term oral administration of DS and GG would have the potential to inhibit plasma CES1 activity in rats.On the other hand,plasma CES1 activity in the DG and CX-treated groups fluctuated during the treatment period with a significant increase in CES1 activity observed in the DGL group on Day 8 and in the CXH group on Day 2 and Day 8,with no significant difference on Day 14.
Besides,compared with that on Day 0,it was noticed that plasma CES1 activity of the control,DSL,GGH and CXH groups fluctuated on the first few days and showed a trend of a steady decrease after Day8(Fig.7B)with only the DSL group demonstrating significant decreased CES1 activity on Day 8,Day10,Day12 and Day14(Fig.7A),with no significant differences on Day 14 in the GGH and CXH groups.For other groups,including DSH,GGL,DGL,DGH and CXL,consistent decrease in plasma CES1 activity was observed after Day 2(Fig.7B)with significant decreases found in the DGH and CXL groups on Day 10,in the DGL group on Day 10 and Day 12 and no significant differences for all groups on Day 14(Fig.7A).
To statistically analyse the differences in CES1 activity in the biomatrices of rats from different treatment groups,Welch’s t-test,an adaption of Student’s t-test[48],was adopted in our current study.Welch’s t-test performs better on control of Type 1 errors than Student’s t-test when sample sizes are unequal and performs similarly when sample sizes and variances are equal[48-50].Our analysis procedure was as follows:First,the assumption of normality was checked using the Shapiro-Wilk normality test because of the small sample size of control group(n=6)and TCM-dosed groups(n=3).We found that all data sets of rat plasma CES1 activity in all groups followed normal distributions.Secondly,assumptions of homogeneity of variance were verified using the F-test:e.g.,the variance of data sets of rat plasma CES1 activity in the DSL group on Day 2 vs.Day 0(n=3)(scenario A)was found to be equal(p=0.892),whereas that in the DSH group on Day 10 vs.Day 0(n=3)(scenario B)was unequal(p=0.006).Finally,the data sets were analysed using both Student’s t-test and Welch’s t-test.For scenario A,it was found that there was no significant difference between the two data sets(p=0.409 in both tests)with the same t value(t=0.9218)and degree of freedom(df)(df=4)from both tests;for scenario B,different results were found between the two data sets by the two tests:Student’s t-test:p=0.019,t=3.828,df=4;Welch’s t-test:p=0.061,t=3.828,df=2.Since when variances were unequal across groups,Student’s t-test could be severely biased and lead to unreliable results[49],while Welch’s ttest provides better control of Type 1 error rates[48-50],Welch’s ttest was selected in our study.
In summary,among the four TCM herbs,DS and GG tended to have the greatest effect on plasma CES1 activity,with a decrease in plasma CES1 activity after long-term oral administration,whereas DG and CX affected CES1 activity in organs including kidney,spleen and lung.Based on the CES1 distribution and changes in its activity after treatment with the four TCM herbs,we suggest that DS,GG and DG might significantly alter CES1 activity in tissues where it is most abundantly expressed,including blood and kidney.Among the tested organs,CES1 activity in heart,liver,pancreas,intestine,brain and stomach was barely affected by the two-week orally administered TCM herbs.Considering the above-mentioned impact,the abundance of CES1 expression and the convenience for sampling,plasma CES1 could serve as a biomarker in monitoring the alteration in CES1 activities in rats.
4.Conclusions
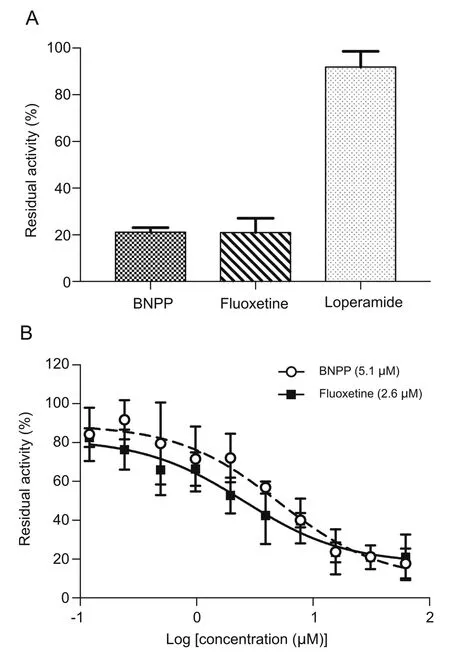
Fig.5.An assessment of potential inhibitory effects of the selected compounds on the hydrolysis of NLMe in rat plasma.Data are means±SD,n=3.(A)Histogram of residual activities compared to control for BNPP, fluoxetine and loperamide at final concentrations of 31.25μM;(B)Dose-inhibition curves of BNPP and fluoxetine,IC50values were presented in the parenthesis.
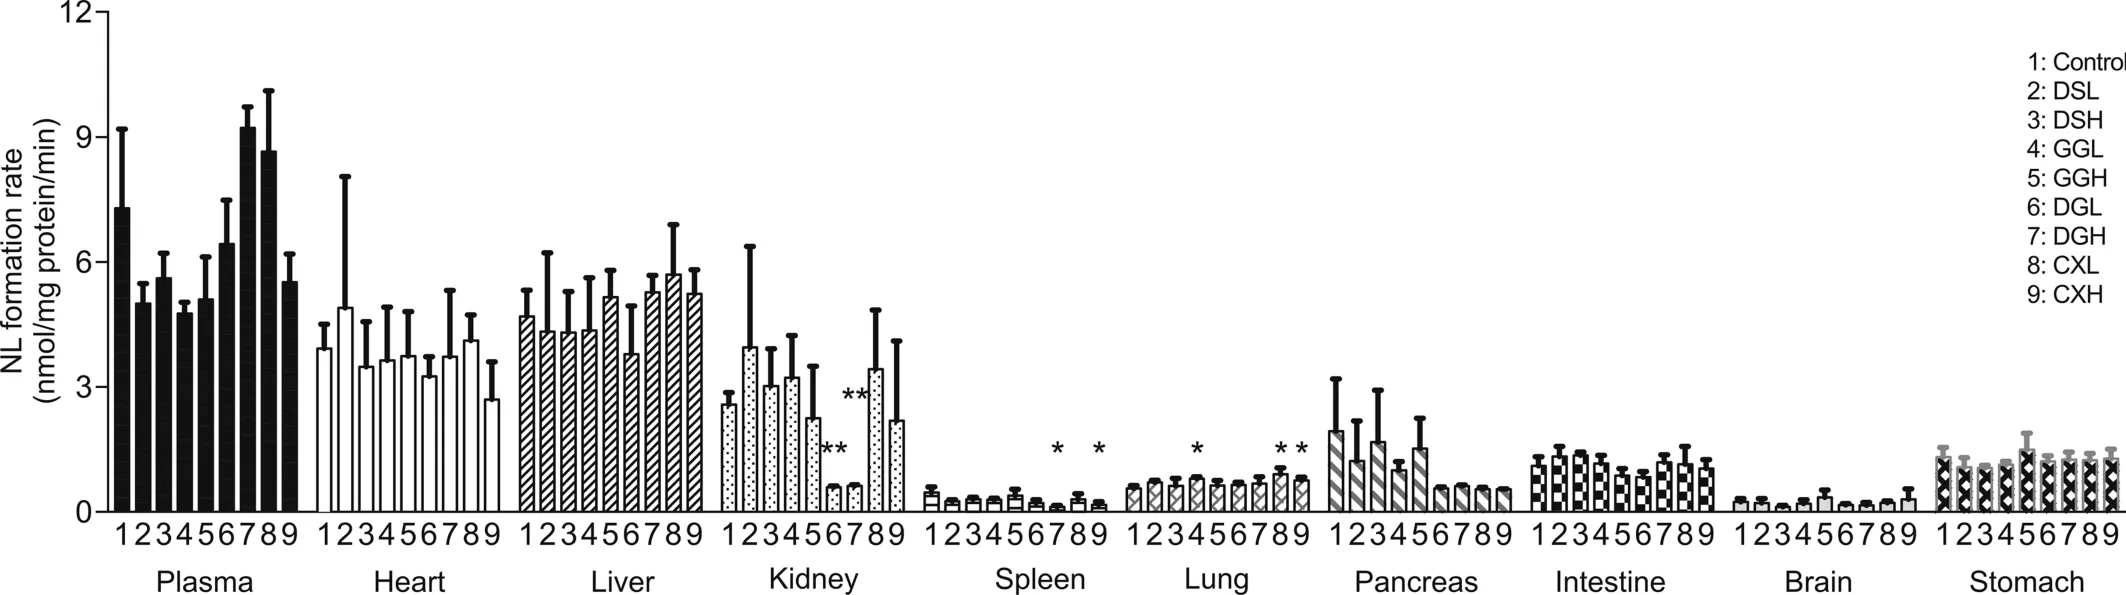
Fig.6.Histogram for the CES1 activities in plasma and tissues after the two-week TCM administrations.in rats.Data are means±SD,n=6 for control group and n=3 for TCM dosed groups.*P<0.05,**P<0.01 compared with control.
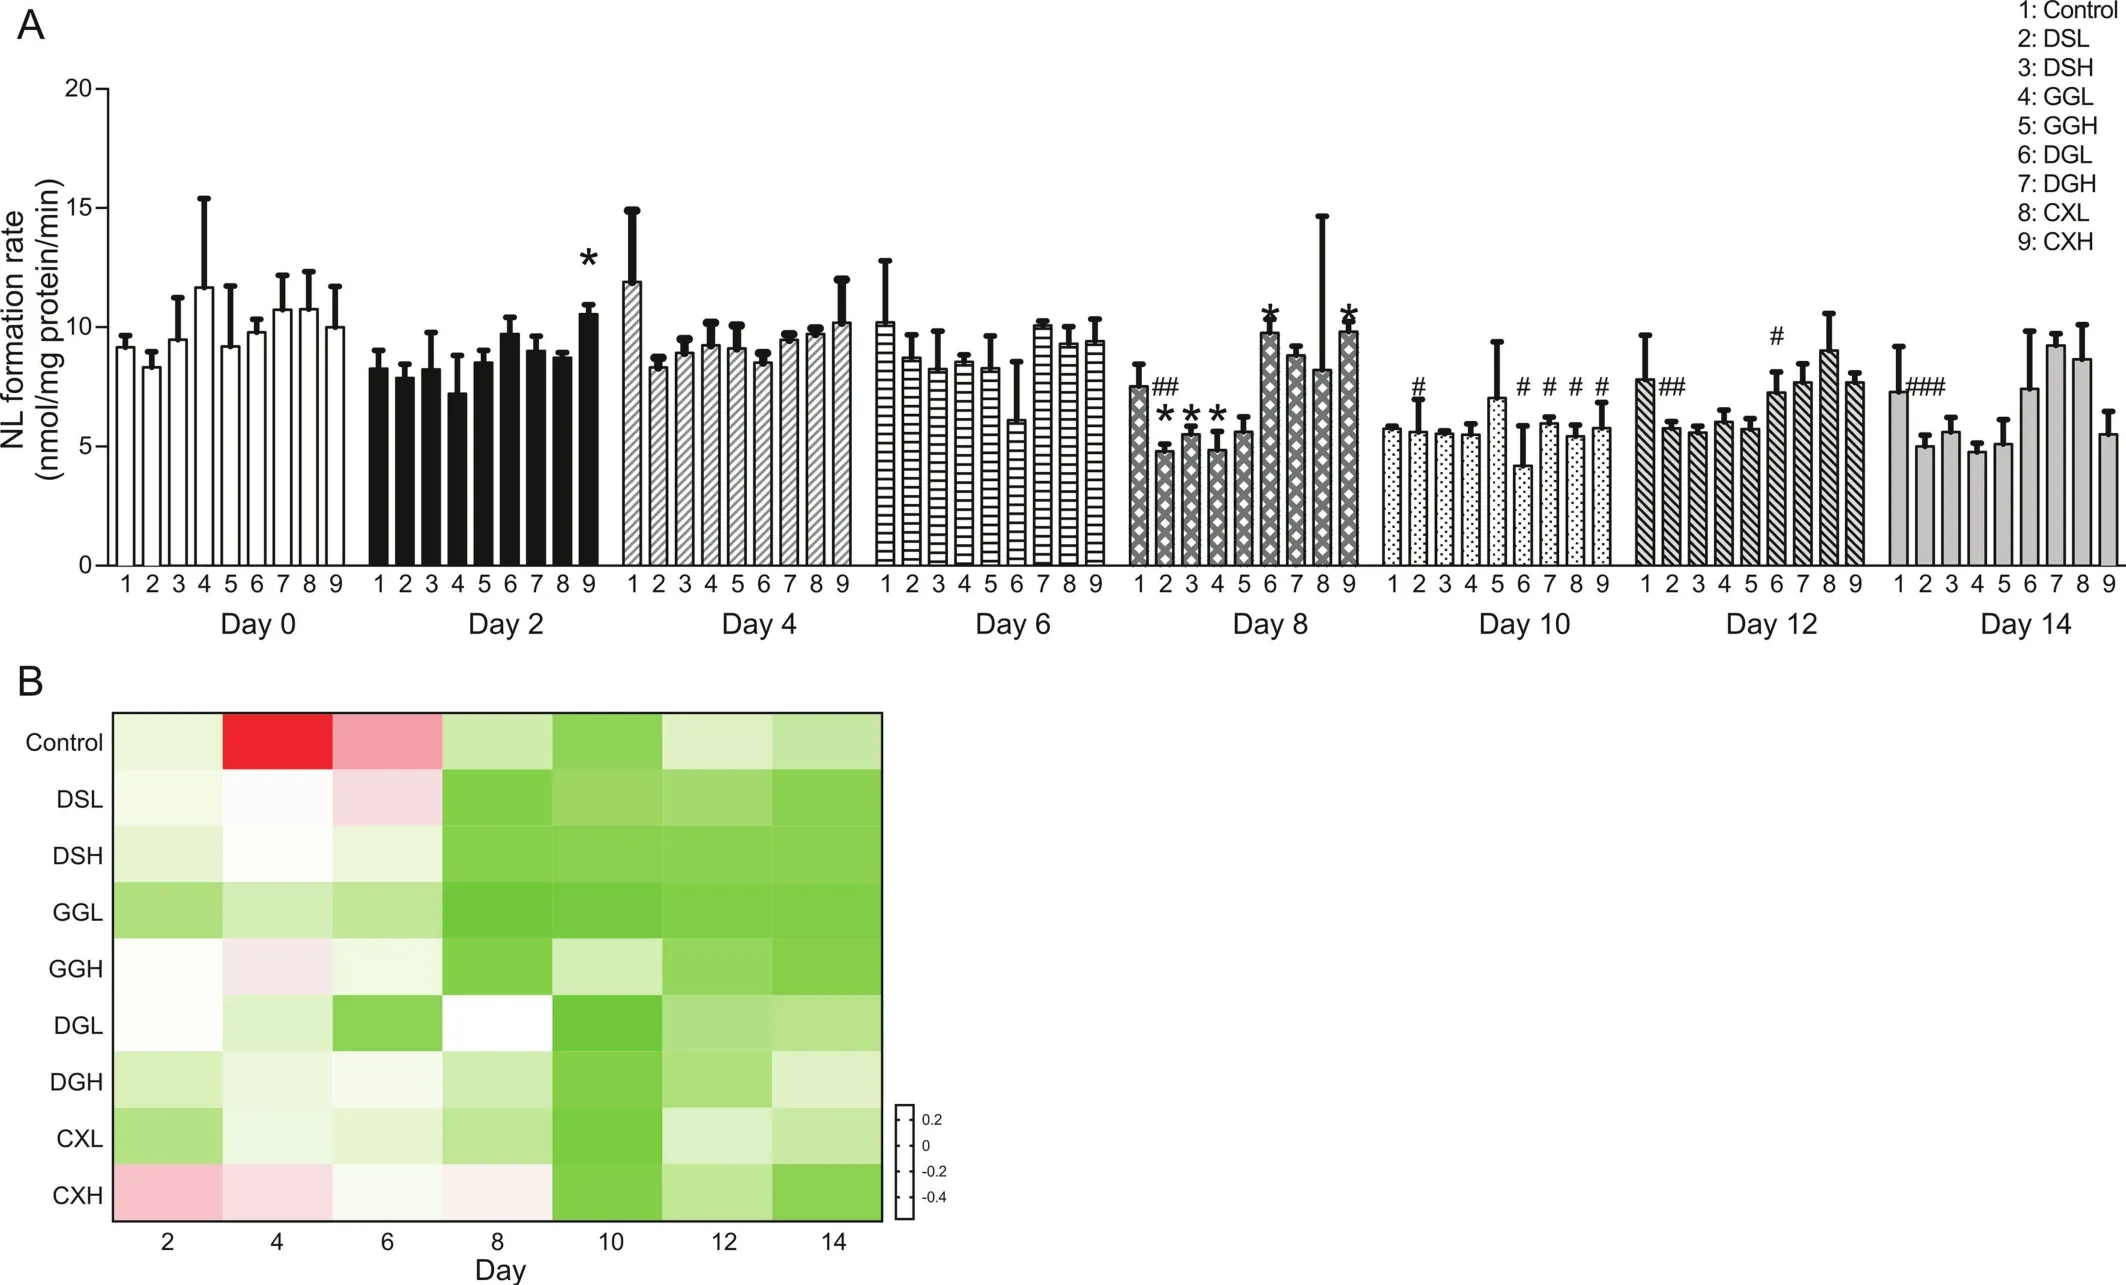
Fig.7.CES1 activities in plasma of rats during the two-week TCM administrations.(A)Histogram for the CES1 activities in rats on Day 0,2,4,6,8,10,12 and 14.Data are means±SD,n=6 for control group and n=3 for TCM dosed groups.*p<0.05,**P<0.01 compared with control.#P<0.05,##P<0.01,###P<0.001 compared with Day 0.(B)Heatmap for zscored fold change of CES1 activities in rats on Day 2,4,6,8,10,12 and 14 relative to Day 0,respectively.
A novel and rapid bioluminescence assay with sufficient sensitivity and convenience has been developed and validated for monitoring CES1 activity in various tissues.For the first time,the distribution profiles of CES1 activity in rat tissues are fully characterized with our bioluminescence assay.We found that the CES1 enzyme was present in plasma and all tested organs in rats with much higher levels in plasma,heart,liver and kidney.The four studied TCM herbs showed tissue-specific effects on CES1 activity after two-week oral administration in rats at human-equivalent doses with DS and GG affecting CES1 activity in plasma to the greatest extent,while DG and CX affected activity in tissues to a greater extent.DS/GG treatment resulted in a trend of decreased CES1 activity in plasma,while DG and CX treatment led to a significant decrease in CES1 activity in kidney and lung,respectively.Our bioluminescence assay not only provided comprehensive in vivo tissue distribution profiles for CES1 in rats but also could be used for the identification of potential CES1 inhibitors or inducers and for monitoring CES1 activity during drug/drug and drug/herb treatments in clinical practice.
Conflicts of interest
The authors declare that there are no Conflicts of interest.
Acknowledgments
This work was supported by Health and Medical Research Fund(Reference No.:12131521)from Food and Health Bureau,the Government of the Hong Kong SAR,Hong Kong,China,National Natural Science Foundation of China(Grant No.:81973286,81922070,81703604and 81973393),China,and General Research Fund(CUHK 2141142)from University Grant Council of Hong Kong SAR,China.
Appendix A.Supplementary data
Supplementary data to this article can be found online at https://doi.org/10.1016/j.jpha.2020.05.006.
 Journal of Pharmaceutical Analysis2020年3期
- Journal of Pharmaceutical Analysis的其它文章
- Current status and future directions of high-throughput ADME screening in drug discovery
- Current LC-MS-based strategies for characterization and quantification of antibody-drug conjugates
- Current status of in vivo bioanalysis of nano drug delivery systems
- Ultra-sensitive bioanalysis of the therapeutic peptide exenatide for accurate pharmacokinetic analyses at effective plasma concentrations utilizing UPLC-MS/MS
- Software-aided detection and structural characterization of cyclic peptide metabolites in biological matrix by high-resolution mass spectrometry
- Quantitation of DNA by nuclease P1 digestion and UPLC-MS/MS to assess binding efficiency of pyrrolobenzodiazepine