
Quantitative analysis of the content of nitrogen and sulfur in coal based on laserinduced breakdown spectroscopy:effects of variable selection
2020-07-09 04:19FanDENG邓凡YuDING丁宇YujuanCHEN陈雨娟ShaonongZHU朱绍农andFeifanCHEN陈非凡
Plasma Science and Technology 2020年7期
Fan DENG (邓凡),Yu DING (丁宇),4,Yujuan CHEN (陈雨娟),Shaonong ZHU (朱绍农) and Feifan CHEN (陈非凡)
1 Jiangsu Key Laboratory of Big Data Analysis Technology,Nanjing University of Information Science&Technology,Nanjing 210044,People’s Republic of China
2 Jiangsu Collaborative Innovation Center on Atmospheric Environment and Equipment Technology,Nanjing University of Information Science & Technology,Nanjing 210044,People’s Republic of China
3 Jiangsu Engineering Research Center on Meteorological Energy Using and Control,Nanjing University of Information Science & Technology,Nanjing 210044,People’s Republic of China
4 Author to whom any correspondence should be addressed.
Abstract
Keywords:variable selection,LIBS,coal,CARS and SPA
1.Introduction
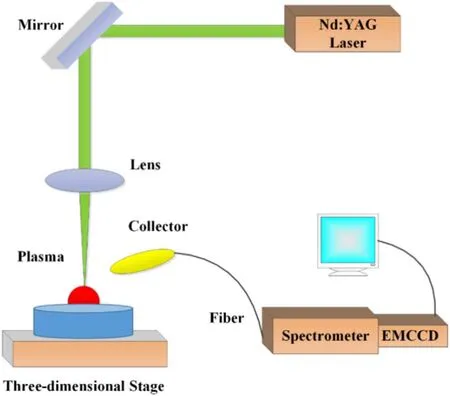
Figure 1.LIBS setup.
As one of the most important fossil energies in the world,coal plays an vital role in industrial development,energy supply,and other processes,and is called‘the black gold’.It not only provides electricity for human society,but also provides basic energy for other industrial activities such as refining metals and making cement.However,in the long-term process of coal burning,the emission of various air pollutants and greenhouse gases such as NO2and SO2causes a series of environmental pollution problems [1–4].NO2causes the imbalance of respiratory systems,while SO2not only causes acid rain,but also significant damage to the human body when the concentration in the air is too high.Since these polluting gases are mainly formed by the elements of nitrogen(N)and sulfur(S)in coal,the accurate determination of N and S content is an important step to realize the clean use of coal.However,the traditional coal quality detection method cannot be used for online detection,while the current online analysis methods based on capacitance [5],core [6,7]and ultrasonic wave have some limitations,such as expensive equipment and significant radiation harm.
Laser-induced breakdown spectroscopy (LIBS) is a rapidly developed chemical element analysis technology[8,9],which has been widely used in the alloy industry[10],biology [11],archaeology [12],slag detection [13],and the analysis of soil[14].As a fast,online,pollution-free,low-cost technology [15,16],LIBS is well suited for ultimate and proximate analysis of coal [17,18].Zhou et al applied LIBS technology to the detection of zinc in coal ash,and aligned the elemental spectrum of pure elements with the samples’spectrum to identify and confirm the samples.The R2of zinc in coal ash was determined to be 0.9957 [19].Zhao et al proposed a new hybrid quantitative model,which can provide reproducible quantitative analytical results.The model obtained the average absolute errors of 0.42%,0.05%,0.07%,and 0.17% for carbon,hydrogen,volatiles,and ash,respectively [20].However,little attention has been paid to the detection of N in coal in present research.Furthermore,the aforementioned research ignored the influence of variable selection in coal detection.Since the spectrum obtained by LIBS contains interference information,this will undoubtedly affect the accuracy of the quantitative detection results.Yan et al chose to use a combination of PLS algorithm and other related algorithms in the detection of coal calorific value[21],C and S elements [22],as well as the measurement of ash content,volatile matter and other indicators [23]to make a preliminary variable selection of the spectrum.Their experimental results showed that the quantitative analysis results after variable selection are significantly better than fullspectrum modeling,but the team only conducted simple variable selection,and did not discuss the multiple variable selection methods in depth.In order to overcome the impact of redundant spectral information on quantitative analysis,comparing and selecting a fast and efficient variable selection algorithm is the primary task.
The current study set up an experimental device based on LIBS to quantitatively detect N and S in coal.Meanwhile,the PLS model combined with variable selection methods(competitive adaptive reweighted sampling (CARS) and the successive projections algorithm (SPA)) were constructed to explore their effect on improving the performance of quantitative analysis.Finally,the suitable variable selection algorithm was selected to improve the ability of LIBS technology for coal quality detection and analysis.In our study,we applied the coefficients of determination of calibration sets and test sets (R2C and R2P),root mean square error of calibration sets and test sets (RMSEC and RMSEP) to evaluate the model.
2.Material and methods
2.1.Setup
All the spectra of coal samples were induced by a Q-Switched Nd:YAG laser (Dawa-300,Beamtech) which operated at the wavelength of 1064 nm [24].The pulse width of the laser is about 8 ns and the chosen energy is 80 mJ.The laser fires at the frequency of 10 Hz.All coal samples are placed directly on the three-dimensional stage with millimeter accuracy.The laser pulse is focused onto the sample surface by a 50 mm lens,then ablates the sample and produces a spot with a diameter of 200 μm.The plasma emission is coupled into the optical fiber through a collimating lens (UV74) with a focal length of 7 mm.The plasma is transmitted to an Echelle spectrometer (Aryelle 150,LTB,Germany,λ/Δλ=6000,wavelength:220–720 nm).An electronic multiplying charge coupled device camera (1004–1002 Pixels,UV enhanced,QImaging,USA)is coupled to the spectrometer for detection of the spectrum from samples.In order to not collect early continuous radiation of LIBS plasma,a mechanical chopper is used for time control of the laser and spectrometer.The delay time between the laser and spectrometer is set to 3 μs.The integrating time is 2 ms.For the coal sample,30 different locations were chosen in the same sample for spectrum acquisitions.The spectrum obtained from the same position is an average spectrum obtained by averaging ten laser pulses.All the experiments were conducted at atmospheric pressure.A diagram of the LIBS setup is shown in figure 1.

Table 1.Content of total samples.
2.2.Coal samples
There are 20 standard samples of pulverized coal from Jinan Zhongbiao Technologies Co.Ltd in this study.The content of N and S in the samples are listed in table 1.Because the inhomogeneity of the samples may affect the accuracy and precision of the experimental results,all powder samples were compressed into dense and smooth pellets for LIBS analysis.The pellets,with a diameter of 20 mm and thickness of 3 mm,were prepared by a 28 MPa tablet press for 5 min.For modeling,20 samples were divided randomly into a calibration set and test set.In the N-element detection experiment,the test set includes samples 103,92,114,97 A,107 and 95.The rest comprise the calibration set.In the S-element detection experiment,samples 95,121a,130,122,98 and 103 are the test set,and the remaining samples are the calibration set.The data processing and quantitative analysis were completed using MATLAB (R2014b).
2.3.Competitive adaptive reweighted sampling (CARS)
CARS is an algorithm which can select the optimized combination of wavelengths from the full spectrum,connected with the PLS model on the foundation of ‘survival of the fittest’.CARS is a potentially effective method to select wavelength in order to build an accurate model.
CARS regression uses Monte Carlo simulations to select some sets of spectral variables.In each sampling,two steps need to be performed.In the first step,wavelengths,of which the absolute value regression coefficients in PLS are relatively small,are removed by the exponentially decreasing function(EDF).The ratio of the variables to be maintained is also calculated by the exponentially decreasing function [25].
The contribution of each wavelength can be reflected by the absolute value of the ith element in b,which is the p-dimensional coefficient vector,where the p is the number of variables.Thus,it can be easily known that the larger|bi|has the more important function,and contributes more to our study.To assess the significance of each wavelength point,we use wi,which is the absolute value of the regression coefficient in the PLS model,to express it,and the definition can be shown as:

When it is the ith sampling run,the ratio can be defined as:

Here e is the prediction error,and riis the ratio of the wavelength to be kept in the ith sampling run.m and n are two constants,which are determined by two conditions as follows:(1) in the first sampling run,the model is built with all the wavelengths of PLS;(2)in the Nth sampling run,we getrN=2/pwith only two wavelengths reserved.With these two conditions,m and n can be expressed by two formulas,as follows:
We then use adaptive reweighted sampling (ARS) in order to further select variables [26].In the next step,the best variable subset,of which the RMSE is the lowest,was selected by k-fold crossing validation.Due to the use of Monte Carlo sampling and the random number of ARS,the result of CARS is not unique.
2.4.Successive projections algorithm (SPA)
SPA is a forward variable selection algorithm.It can find the variable group with the least amount of redundant information and the lowest collinearity among the full spectrum.The selected group may reduce the fitting complexity in the process of modeling and improve the speed and efficiency of modeling.At the same time,it can effectively extract spectral variables with high correlation,and increase the stability and accuracy of the regression model.
SPA starts the projection with a random variable,then incorporates a new one at each iteration,until a specified number S of variables is reached [27].The steps for SPA are described below,assuming that the first wavelengthk(0) and the number S are given.
(1) Before the first iteration(s=1),letxi=ith column ofXcal;i=1,…,I,where I is the total number of wavelengths.Xcalis the calibration set.
(2) Suppose M is the variable set which is not yet selected.M={i such that 1≤i≤Iandi∉{k(0 ),…,k(s-1)}v}.
(3) Calculate the projection ofxiasPxi=xi-for alli∈M,where P is the projection operator.The superscript T means transposed.
(4) Letk(s)=arg (max||Pxi||,j∈M).
(5) Letxi=Pxi,i∈M.
(6) Lets=s+1.If <s S,go back to step 2.
(7) The resulting wavelengths are{k(s) ;s=0,…,S-1} .

Figure 2.Typical spectrum of coal samples.
3.Results and discussion
3.1.Qualitative analysis
Wavelength and intensity are important information for qualitative analysis of N and S elements in coal.Figure 2 shows the spectrum averaged by all spectra of the samples.Based on the NIST database,we tag parts of the characteristic lines of C,N and S in figure 2.Since the spectral intensity and position of other elements contained in coal will affect the characteristic lines of S and N,in order to better eliminate or weaken the effect of these interference signals on quantitative analysis results,different variable selection methods are studied below.
3.2.Quantitative analysis using PLS model
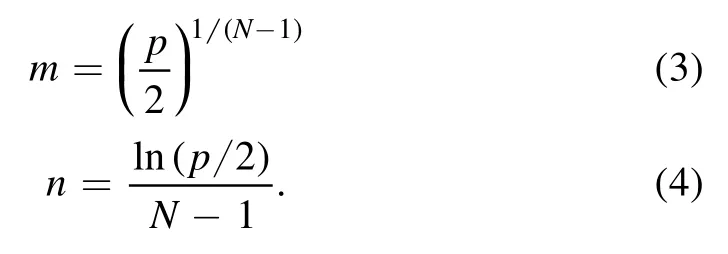
The full spectrum of the coal sample was used to build the PLS model for analyzing the content of N and S.In the PLS model,the latent variable (LV) is an important parameter affecting the perdition performance.RMSEs of cross validation were used to optimize the LV.After ten-fold cross validation,the LV of six was selected as the best LV for both N and S.With this optimized PLS model,the predictive results for the calibration set and test set are shown in figure 3.The RMSEs for the test set are 0.2263 and 0.5811 for N and S,respectively.In the model,the correlation between measured values and predictive values is weak,as we can obtain that the R2s for the test set are 0.5784 and 0.5172 for N and S,respectively.This may be because the full spectrum contains an element of useless information contributing to quantitative analysis and it is difficult to find variables corresponding to the real content in the algorithm.
3.3.Quantitative analysis using CARS-PLS model
In order to remove irrelevant information that influences the result of the PLS model,CARS was used to explore the feasibility of variable selection.
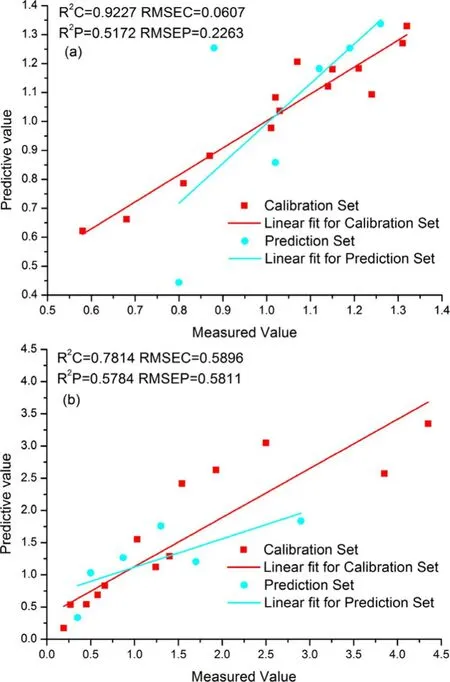
Figure 3.Prediction results using PLS model for N (a) and S (b).
The number of Monte Carlo sampling runs affects the algorithm runtime and the selected variables.For this research,50 runs of Monte Carlo sampling are set for both N and S.As shown in figure 4(a),with the increase of runs of Monte Carlo sampling,the quantity of selected variables decreases at different speeds.At the beginning,the speed of decrease is rapid.Around the 5th Monte Carlo sampling,the decreasing speed slows.This process is shown in figure 4(a).
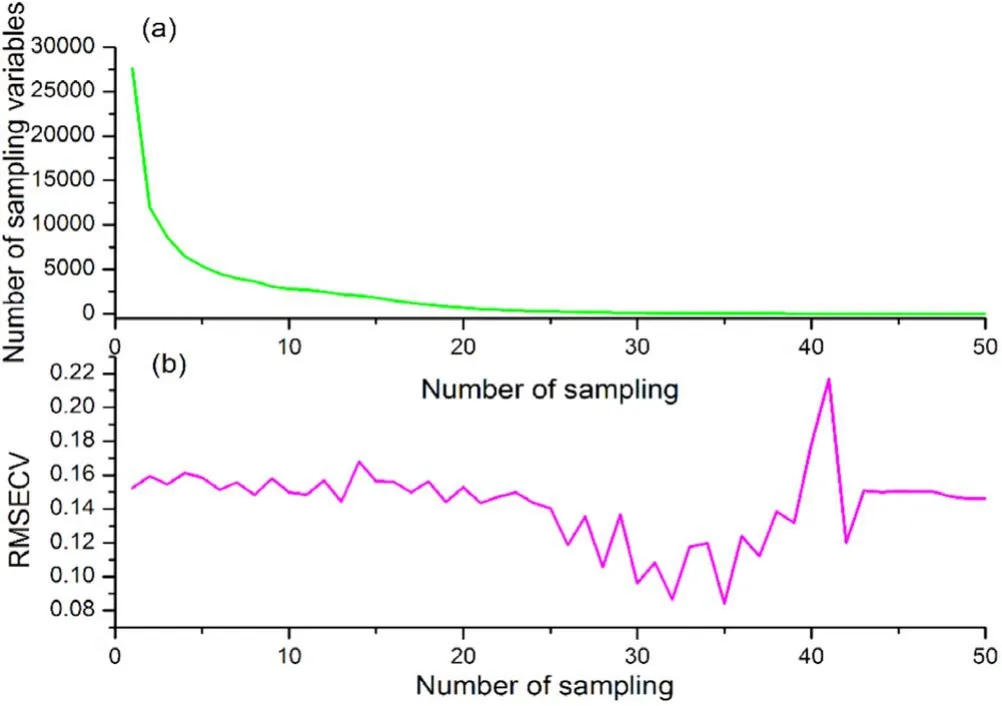
Figure 4.Process of Monte Carlo sampling.

Figure 5.RMSECVs for different LVs.
As 50 different subsets were selected through Monte Carlo sampling,cross validation was used to calculate the RMSE for cross validation (RMSECV) for each subset,as shown in figure 4(b).The RMSECVs show a downward trend with the increase in the number of runs of Monte Carlo sampling.When the number of runs reaches 35,the RMSECV obtains the minimum value and the number of the selected variable is 37.This means that before the 35th Monte Carlo sampling,more and more variables which have low correlation with the content of N in coal were eliminated.When the number of runs is above 35,the RMSECVs show a rise in volatility.In this procedure,the number of the selected variable is relatively very small (<37),and each selected variable may have a large contribution to the quantitative model.In this condition,the RMSECVs vibrate significantly when the sampling result changes a little.After CARS,37 variables were chosen to be the input of the PLS model for the determination of N.Through the same process,the number of the selected variable was 25 for S at the 37th sampling.
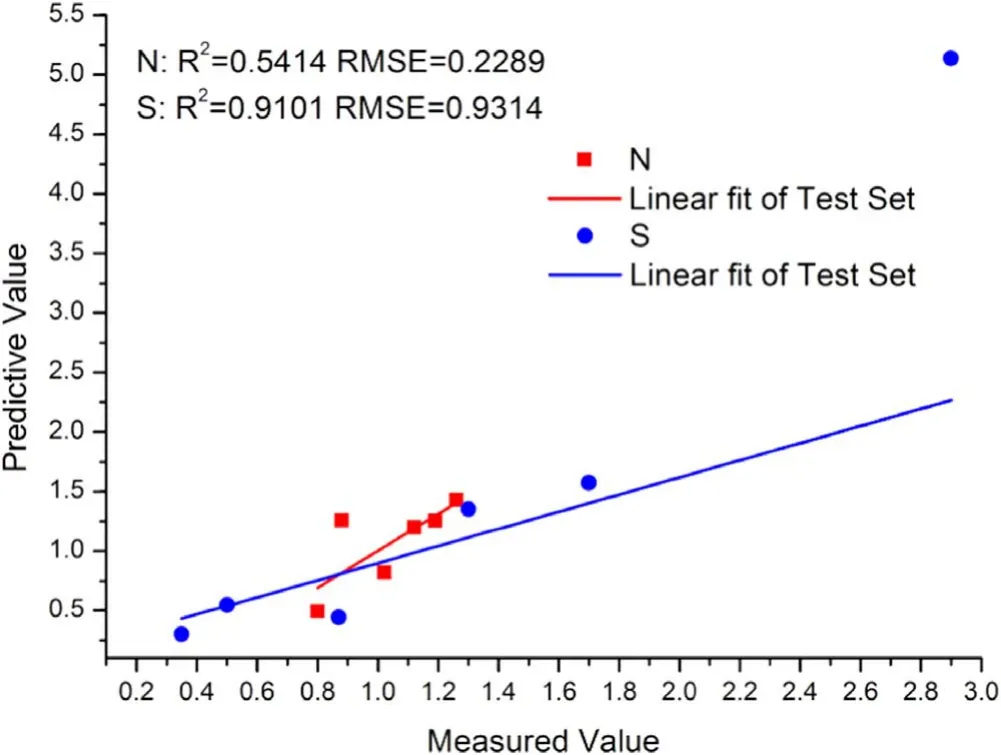
Figure 6.Predictive results of the CARS-PLS model for the test set.
Before constructing the quantitative model,cross validation was used to optimize the LV for N and S for the purpose of preventing overfitting.As figure 5 shows,it is clear that for N the values of the RMSECV show a downward trend at the beginning,and then show an upward trend.So the RMSECV for N has the best value at the 5th point.For S,the RMSECV obtains relatively close results when the LV is set at the range of 10−14.In this range,the best LV is selected as 8 with the minimum RMSECV value.
With the optimized parameters,we build two models based on CARS-PLS of N and S.The predictive results are shown in figure 6.For the N element,we can see that the R2P is 0.5414,and the RMSEP is 0.2289.For the S element,the R2P is 0.9101,and the RMSEP is 0.9314.
3.4.Quantitative analysis using SPA-PLS model
SPA was applied to the full spectrum of coal samples and 14 subsets were selected based on projections for both N and S,respectively.After filtering the error and correlation of each subset,the minimum subset of RMSE after cross validation is finally selected as the result of variable selection.For S,it is found that the number of variables corresponding to the subset with the smallest error value is 13.Using these 13 variables,the PLS model was built to evaluate the predictive performance for the combination of different variables.Due to the fact that these 13 variables had been sorted by correlation and projection value,the number of variables used for modeling increases in order.The RMSECVs are shown in figure 7.The first 11 variables among the subset obtained the best RMSECV; the numbers of these selected variables were 97,12,4320,12734,759,2978,587,63,4843,2094,228.For N the whole 14 variables in the selected subset are chosen with the lowest RMSECV; their numbers are 488,12,2029,853,486,5370,32,350,214,374,723,793,16754,54.
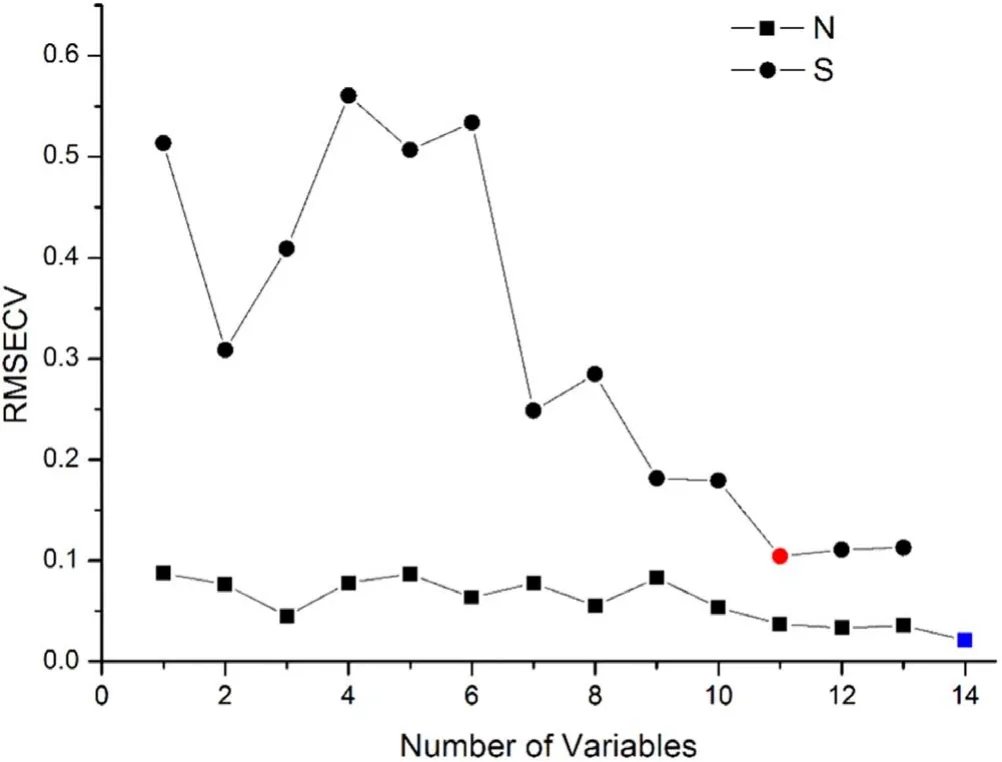
Figure 7.RMSECVs for different numbers of points in the selected subset for N and S.
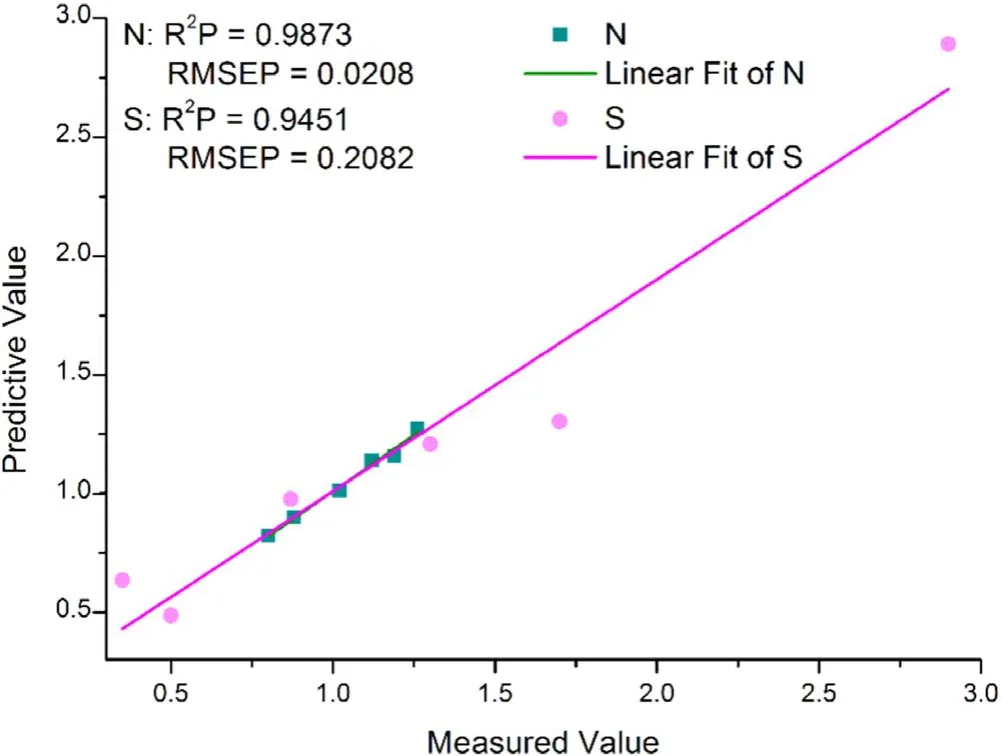
Figure 8.Predictive performance of N and S using SPA-PLS.
The selected variables through SPA were used to build the PLS model with the LVs of 10 and 9 for N and S,respectively.SPA-PLS models of the two elements are established under the condition of the best LVs,and the prediction results are shown in figure 8.For both N and S,SPA-PLS obtained relatively good correlation between the content and the selected variables as the result of R2P=0.9873 for N and R2P=0.9451 for S.Compared to S,the SPA-PLS model for N has better performance with higher RMSEP and lower R2P.This may be because the concentration distribution of S is more discrete in the samples than N.
3.5.Comparison of PLS,CARS-PLS and SPA-PLS
The performances of three models are listed in table 2.Two kinds of methods,CARS and SPA,were explored in this research,to validate the influences of variable selection on predictive results.As can be seen from table 2,the PLS model with the full spectrum uses 27620 variables to construct the model for quantitative analysis.However,the predictiveperformance for the PLS model is not satisfied for neither N nor S.N and S are not the main elements in coal samples,so their characteristic lines are easily affected by other lines.

Table 2.The comparison of predictive performance of different models.
CARS uses the Monte Carlo sampling combined with ARS to select a wavelength from the full spectrum.Although CARS-PLS eliminates most variables and improves the modeling efficiency,the prediction performance is not improved significantly.Besides this,CARS-PLS has larger RMSEP for S compared to the PLS model.The RMSEP for S raises from 0.5811 to 0.9314.
SPA-PLS obtains the best results among these three models.The SPA algorithm selects 14 variables and 11 variables for N and S respectively through successive projection.The number of selected variables accounts for only about 0.05% of the total number of variables.SPA realized good promotion in R2P and RMSEP with respect to PLS.Their promotion ratios are 90.9% (R2P from 0.5172 to 0.9873)for N,90.8%(RMSEP from 0.2263 to 0.0208)for N,63.4% (R2P from 0.5784 to 0.9451) for S and 64.2%(RMSEP from 0.5811 to 0.2082) for S,respectively.All the variables selected by CARS and SPA are tagged in figure 9.
From the above experimental results,it can be seen that the selection of variables greatly reduces the modeling time and improves the modeling accuracy.For the variable selection,the CARS algorithm is not stable due to the use of Monte Carlo sampling and the random number of ARS.It cannot therefore maintain effective wavelengths securely.Although it can simplify the model,the chosen variables may have small signal-to-noise ratio,which affects the model prediction accuracy.Meanwhile,the SPA algorithm is only used to select variables and does not modify the original spectral data,so the relationship between the spectral data and the chemical properties of the sample is preserved.Before performing wavelength selection,SPA standardizes the variables so that the modulus of the vectors at each wavelength point is the same.Therefore,the process of selecting the maximum projection vector when performing projection is the process of selecting mutually orthogonal vectors.The colinearity between the variables is minimized,so the prediction performance of SPA-PLS has better performance than PLS.
Based on these experimental results,the variables selected by SPA contain most of the information corresponding to the content of N and S.
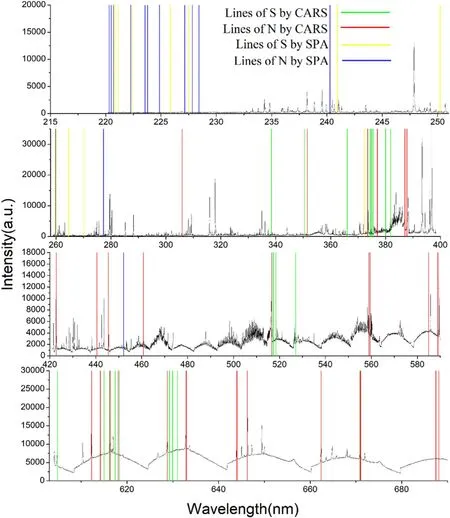
Figure 9.Selected lines of N and S by CARS and SPA.
4.Conclusion
In this paper,PLS,CARS-PLS and SPA-PLS are used to predict the content of N and S in coal,and the characteristic wavelengths are selected in the process of modeling.The experimental results show that PLS cannot effectively predict the concentration of N and S in coal due to its excessive interference information in the full spectrum.For CARS-PLS,although a large proportion of the wavelength points are eliminated,only the prediction results of the S element are improved;the prediction results of the N element do not differ much from those of PLS.SPA-PLS keeps more spectral information on the basis of eliminating the interference information; the prediction ability of its model has been obviously improved,and the accuracy of the prediction results is the best.The R2P and RMSEP of the predicted results of the N element are 0.9873 and 0.0208 respectively,and those of the predicted results of the test set of the S element are 0.9451 and 0.2082,respectively.The predictive results of the two elements are significantly increased compared with the other two methods.In general,LIBS combined with SPA can be applied to quantitative detection of N and S in coal samples.
In the future,this method could be extended to the detection of atmospheric pollution elements in coal,and other indicators in the fields of environmental protection and chemical analysis.
Acknowledgments
The authors are thankful to the Jiangsu Government Scholarship for Overseas Studies (JS-2019-031) and the Startup Foundation for Introducing Talent of NUIST(2243141701023).
 Plasma Science and Technology2020年7期
- Plasma Science and Technology的其它文章
- Influence of target temperature on femtosecond laser-ablated brass plasma spectroscopy
- Spectral characteristics of underwater laserinduced breakdown spectroscopy under high-pressure conditions
- A novel strategy for quantitative analysis of soil pH via laser-induced breakdown spectroscopy coupled with random forest
- Geographical authenticity evaluation of Mentha haplocalyx by LIBS coupled with multivariate analyzes
- Quantitative analysis of saindha salt using laser induced breakdown spectroscopy and cross-validation with ICP-MS
- Temporal and spatial evolution measurement of laser-induced breakdown spectroscopy on hydrogen retention in tantalum