
Geographical authenticity evaluation of Mentha haplocalyx by LIBS coupled with multivariate analyzes
2020-07-09 04:19XiaonaLIU刘晓娜XiaoqingCHE车晓青KunyuLI李坤玉XiboWANG王喜波ZhaozhouLIN林兆洲ZhishengWU吴志生andQiushengZHENG郑秋生
Plasma Science and Technology 2020年7期
关键词:李坤
Xiaona LIU (刘晓娜),Xiaoqing CHE (车晓青),Kunyu LI (李坤玉),Xibo WANG (王喜波),Zhaozhou LIN (林兆洲),Zhisheng WU (吴志生) and Qiusheng ZHENG (郑秋生),7
1 College of Integrated Traditional Chinese Medicine and Western Medicine,Binzhou Medical University,Yantai 256603,People’s Republic of China
2 Shandong Runzhong Pharmaceutical Co.,Ltd,Yantai 256603,People’s Republic of China
3 Hebei Baicaokangshen Pharmaceutical Co.,Ltd,Shenzhou 053800,People’s Republic of China
4 Penglai Municipal Bureau of Ocean Development and Fishery,Penglai 265600,People’s Republic of China
5 Beijing Institute of Clinical Pharmacy,Beijing 100035,People’s Republic of China
6 Beijing University of Chinese Medicine,Beijing 100102,People’s Republic of China
7 Authors to whom any correspondence should be addressed.
Abstract
Keywords:laser-induced breakdown spectroscopy,Mentha haplocalyx,geographical origin,least squares support vector machines,herb authenticity
1.Introduction
Mentha haplocalyx Briq.,commonly known as mint,is a vital Chinese herb [1,2].Its aerial parts are prescribed for cold,cough,swollen glands,aphtha,measles,and alleviation of inflammation [3,4].In traditional Chinese medicine (TCM),geo-authentic herb or‘Daodi’herb is a term defining those TCM planted in specific geographical origins (GOs) and meets the highest quality criteria.Due to multiple consumption,many mint cultivation is increasing greatly.Thus,more attention is being paid to the clear GOs of mint products due to the medicinal efficacy and food quality caused by their GOs [5,6].

Table 1.Analytical methods evaluating the geographical authenticity of herb and food.
To date,discrimination of GOs has mostly been performed by high performance liquid chromatography (HPLC),gas chromatography (GS),mass spectrum (MS),nuclear magnetic resonance(NMR),inductively coupled plasma atomic emission spectrometry (ICP-AES),and recently genomics,proteomics,metabolomics,etc [7–10].Particularly the multi-elemental techniques combined with multivariate analysis have been successfully applied [11,12].Mineralogical elements of herb and food play significant roles in the biological activity and greatly affect their quality[13,14].Therefore,it is valuable to develop effective methods to certify the authenticity of TCM through elemental fingerprints.
Laser-induced breakdown spectroscopy (LIBS) is an emerging elemental analysis technique,which is widely used for its simplicity and versatility[15–17].This technique is based on the consecutive plasmas formation and optical emission following laser ablation of the target material.Spectral characteristics allow multi-element identification and quantitative analysis.Commonly-used element analytical techniques such as atomic absorption spectrometry (AAS),ICP-AES and inductively coupled plasma mass spectrometry (ICP-MS) are limited by tedious sample preparation and may not meet the need of real-time measurement.The use of LIBS is attractive for assessment of multi-elemental determination in different materials,while the use for in situ measurement can be challenging given the other elemental analysis methods [18].
Table 1 lists the recent works found regarding geographical authenticity of herb and food using different multivariate analysis methods and diverse analytical techniques.Most of works focus on differentiating samples by various multi-element analytical techniques.For several evaluated methods,analytical accuracy ranged from 77% to 100%,indicating the promising techniques.Compared to other multi-element techniques,LIBS is faster and more environmentally friendly,since it needs minimal sample pretreatment.
Recently,LIBS has been applied in biomedical fields,notably for plant materials [29–31].Moreover,the numerous spectral peaks necessitate multivariate analysis in LIBS applications [32–34].Liu et al employed the partial leastsquares discriminant analysis (PLS-DA) method to classify the provenance of a medicinal herb(Blumea balsamifera DC)using LIBS[27].Zhan et al applied random forest algorithm,rapid classification method,to identify aluminum alloy based on LIBS [35].
However,many conventional classification approaches used for LIBS analysis are constrained by the underlying linear treatment.While a series of the real-world questions cannot be addressed.For example,the prediction accuracy(sensitivity) is used as the strong criterion to establish and optimize the classification models.Nevertheless,robust classification algorithms were omitted which possess high power in discriminating unknown cases.
In this work,a nonlinear classification algorithm,named least-squares support vector machines (LS-SVM) was employed to classify GOs of mint,as well as to investigate the sensitivity and robustness of models.LS-SVM,as described by Suykens,is a variant of the SVM with a least squares loss function and equality constraints[36].Dingari et al employed LS-SVM to discriminate nonprescription pharmaceutical samples,compared with PLS-DA,soft independent modeling of class analogy(SIMCA),and other traditional linear pattern recognition methods,LS-SVM addressed the intrinsic curved effects in the acquired LIBS data and provided superior predictions on the classification results [37].In addition,the computational complexity of LS-SVM can be reduced relatively by solving a linear equation instead of quadratic programming method used in traditional SVM [38,39].
Thus,the aim of this work is to explore the robustness issues and the classification power of a spectroscopic technique combined with advanced chemometric approaches for multi-classification of mint samples from distinct regions.First,PCA was used to explore the data structure of different cases.Subsequently,LS-SVM algorithm including linear and nonlinear classification was applied to evaluate the sensitivity and robustness of the models based on acquired LIBS data.
2.Materials and methods
2.1.Experimental setup
The experimental setup used in the present work has been previously described [27].Briefly,a commercial LIBS system (TSI,ChemRevealTM-3764,USA) equipped with a Q-switched Nd:YAG laser at 1,064 nm was employed in this study.The experimental setup integrates a laser source with maximum of 400 mJ per pulse and a spectrometer.The system is capable of 2 Hz maximum pulse repetition rate with a pulse duration of 3–5 ns.A focal lens and optical fibers were used to collect the plasma which was then fed into the spectrometer coupled with a CCD device to record the spectra.The spectrum is covering continuous wavelength from 167.323 nm to 984.621 nm.A three-dimensional translation stage with stepper motors was applied to ensure the movement of sample to fresh position.The CCD starts collecting spectra at 1 μs after the initiation.The laser energy was about 340 mJ per pulse.A restricted integration time of 1 ms was used.All experiments were carried out at ambient air.
2.2.Materials
The aerial parts of mint were collected from Hebei,Anhui,Guangxi,Hubei,and Jilin provinces of China,which were identified by Dr Aijuan Shao (Institute of Chinese Materia Medica,Chinese Academy of Traditional Chinese Medicine,China).All mint samples coming from the harvest season are stored at ambient temperature in a shady,well-ventilated room for about two weeks (mean temperature 22 °C).
2.3.Data acquisition
The dried aerial parts of mint were cut into sections of 2–3 cm in length.Spectra were taken along the length of the samples at the surface.Three locations were randomly selected and each one comprised of nine spectra (3×3 (100 μm×100 μm)) for each sample.Thus,27 spectra were averaged.Nineteen representative samples for Hebei group were typically taken,and for the other four GO groups,twenty representative samples were typically taken.Therefore,a total of 99 spectra were obtained.
2.4.Multivariate analysis
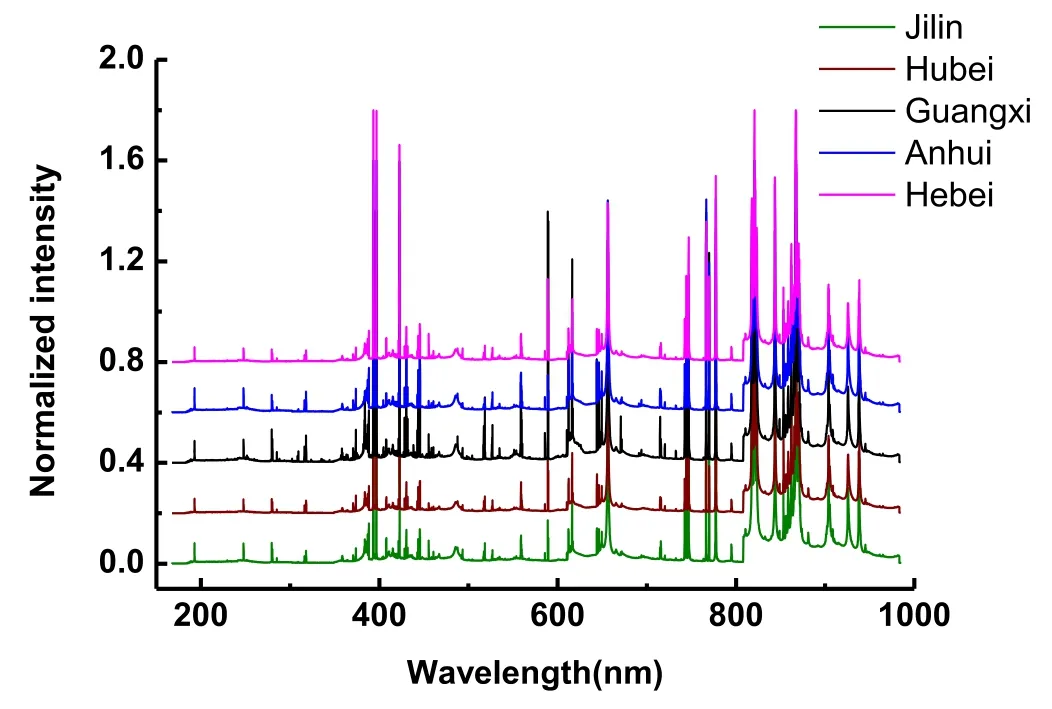
Figure 1.The normalized LIBS spectra of mint samples.(Hebei,Anhui,Guangxi,Hubei,and Jilin).
In this present study,multivariate analysis methods are developed for classification of a large number of mint samples from five GOs in China.The challenge is to be able to discriminate the GOs based on elemental fingerprints of mint.To account for pulse-to-pulse variations in the laser energy,the full spectral spectra were performed by mean-centering.PCA is an unsupervised technique of dimensionality reduction without the use of class labels,which was carried out by PLS_toolbox version 6.21 under Matlab version R2009a(MathWorks Inc.,USA) [36].The linear multivariate PCA models was developed by eigenvectors also named principle components.The new coordinates of the independent PC scores can visualize the similarities among spectra.
Furthermore,LS-SVM algorithm was employed to retrieve the class labels,which was performed by a LSSVM MATLAB toolbox under Matlab version R2009a (MathWorks Inc.,USA)[36].The linear kernel and radial basis function (RBF) kernel were used for linear and nonlinear classification as mentioned in references,respectively [30,40].
The sensitivity analysis and robustness analysis were applied to screen the mint samples.In the‘sensitivity test’,the rate of correct classification,misclassification and unclassification are computed when all classes of pharmaceutical samples are included in the training data.While,the abovementioned methods are evaluated to determine the rate of correct allocation,unallocation and misclassification when each class is alternately removed from the training set but is included in the test data in the ‘robustness test’ as mentioned in [34].Robustness (a positive identification) was also significant for classification test in multivariate models.In this case,‘robust’ implies the ability to detect unknown samples correctly,while not comprising on the prediction accuracy of the known samples.Two separate tests were used,one test was for sensitivity and the other was for robustness [37,41].
Specially,the performance indicators including ‘correct classification’,‘misclassification’,and ‘unclassification’ were adopted in the multi-class cases.The ‘correct classification’categories referred to all correctly classified spectra and all correctly unclassified spectra.Incorrect classification fallen under the category of ‘misclassification’.In addition,an unclassification criterion labeled incorrect unallocation of the spectra from the known samples to prevent misclassification.
The input variables for LS-SVM computations were the full-spectral.Classic Kennard–Stone (KS) approach was implemented to separate the datasets into training and test sets[42].Leave-one-out (LOO) cross-validation paradigm was employed in both algorithms.
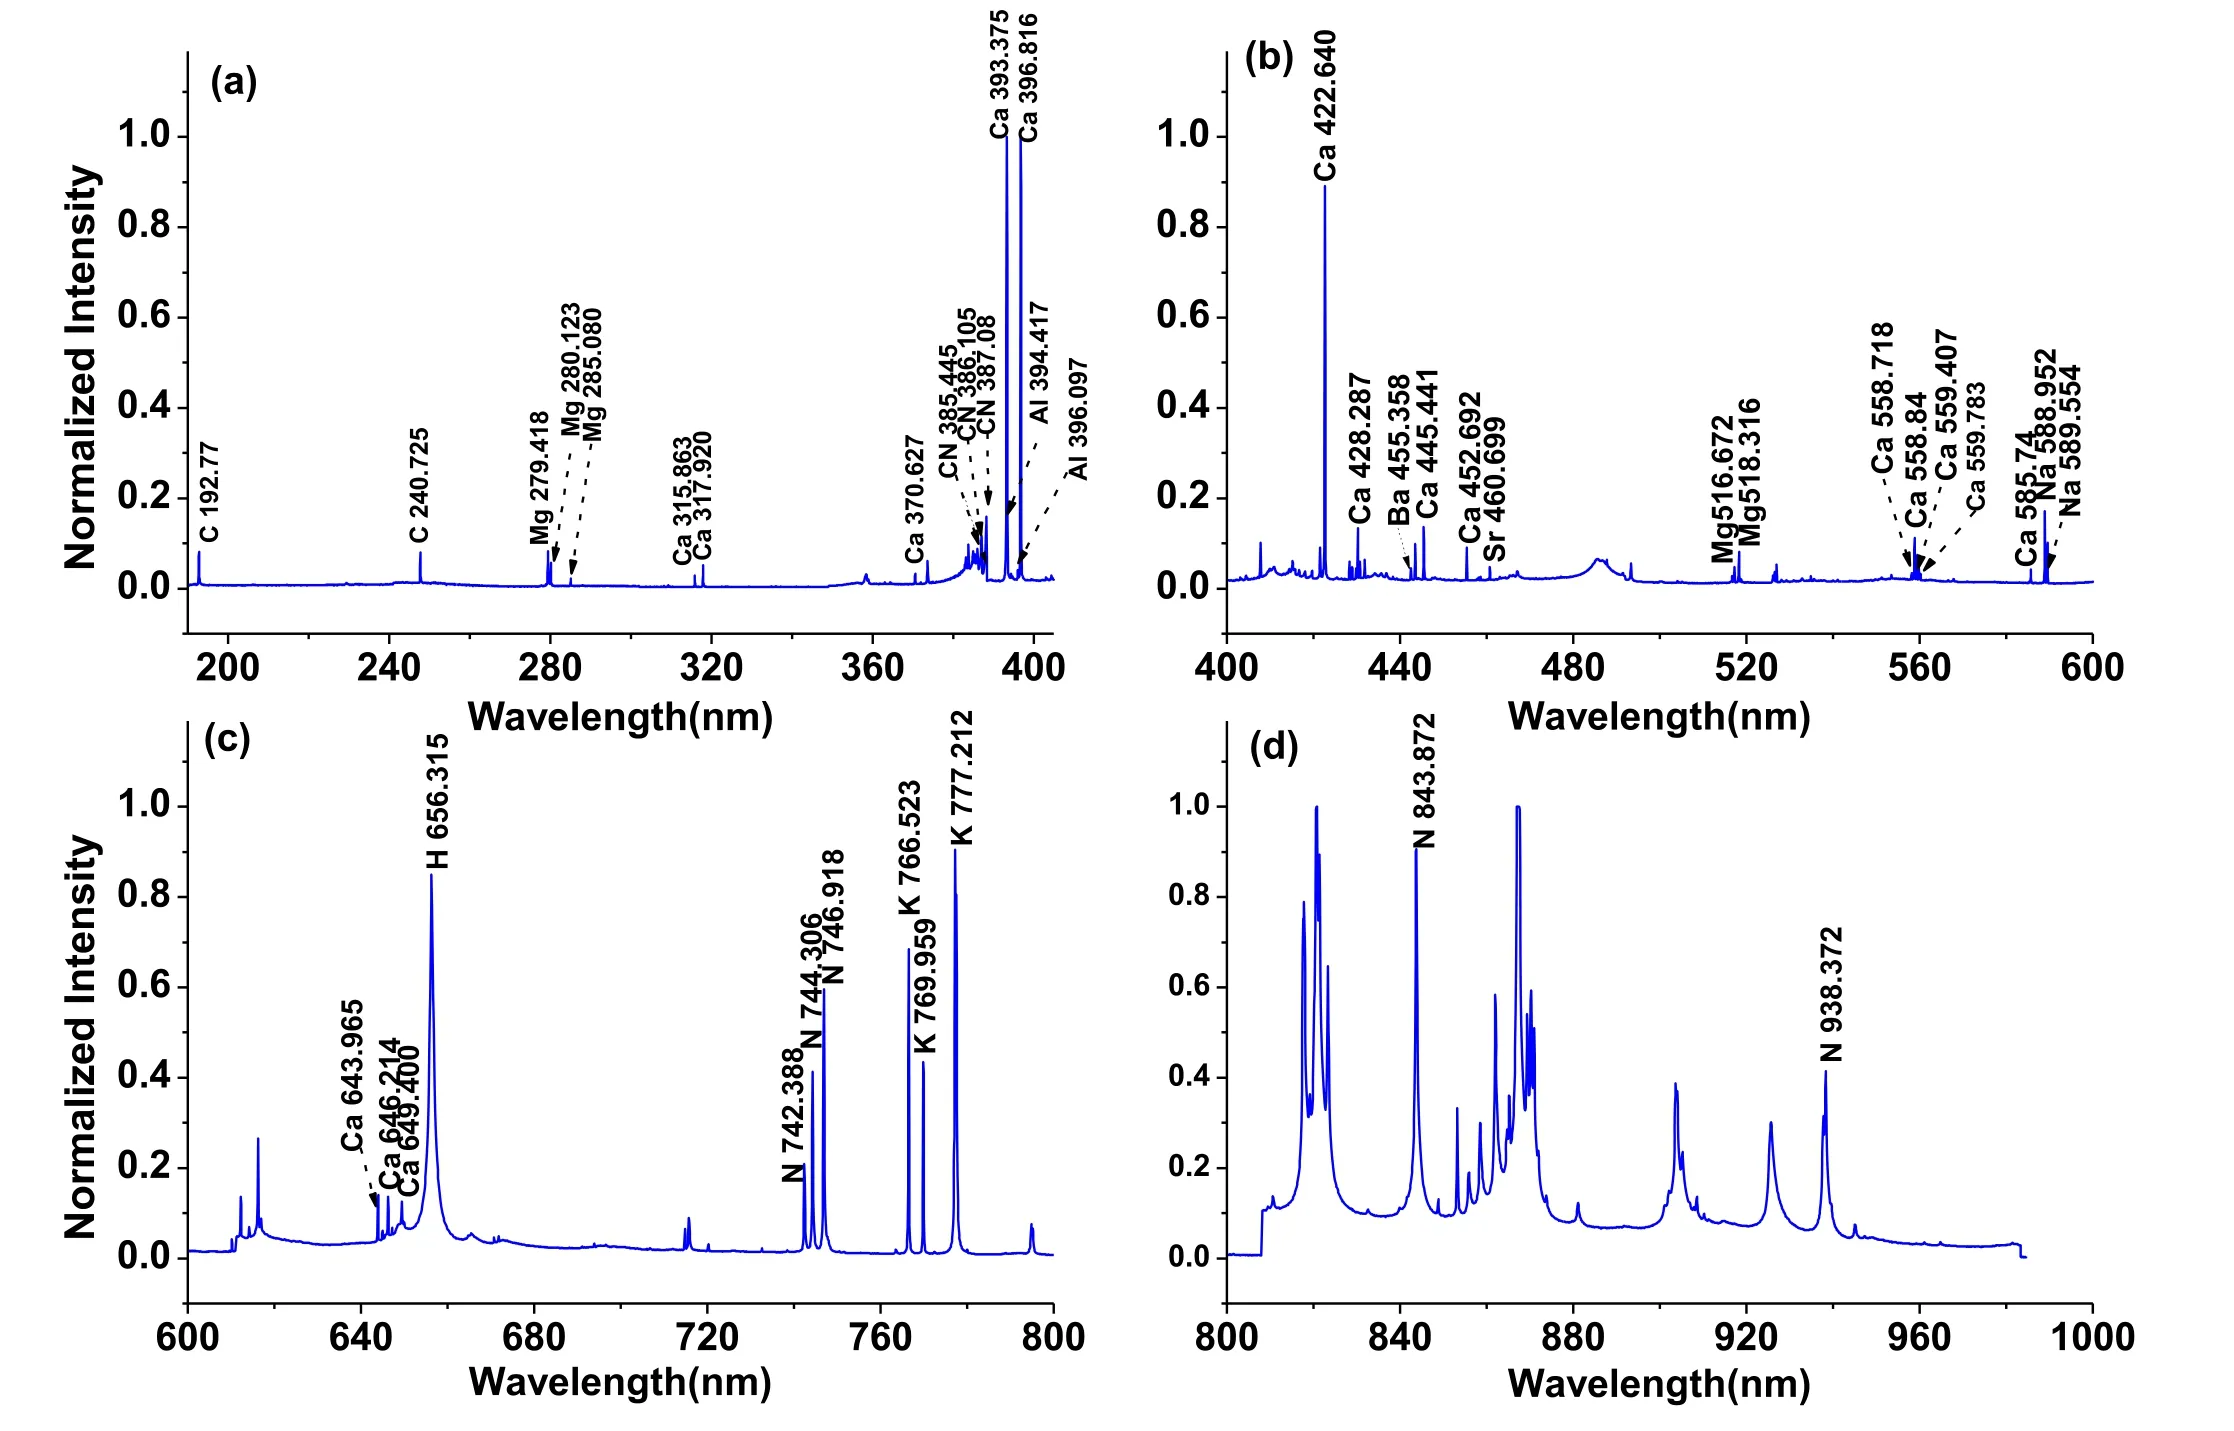
Figure 2.The typical normalized LIBS spectrum obtained from a mint sample.
In the sensitivity tests,99 datasets were randomly splitting into 66 for training and 33 for test,respectively.Especially,the 33 test samples consist of 5 randomly selected samples from each of the five regions.Additionally,100 iterations are executed in the screening process.
In this investigation,the robustness tests follow a similar way to the sensitivity tests with a key difference.One mint region class is removed from the calibration set at one time.Meanwhile,this process is alternated for each region class.Moreover,the size of the test set maintains the same as sensitivity tests.Similarly,100 independent iterations for each removed class were also applied to get a representative result.
3.Results and discussion
3.1.Construction of ‘elemental fingerprints’spectra
Figures 1 and 2 depict the representative LIBS spectra of mint samples.Macro-elements(Ca,K,Ba,Na,Mg)dominated the LIBS spectra.The peaks corresponding to lithium(Li),silicon(Si) and aluminum (Al) with lower intensities also appear in the spectra.Simultaneously,light organic elements such as carbon (C),oxygen (O),hydrogen (H) and nitrogen (N)together with molecular band C–N are monitored in the stem.Table 2 shows the elements detected in the spectra.
Figure 3 is an average per GO of such intensities.Each bar is an average of 20 or 19(Hebei group)such intensity and the error bars were standard deviation.Figure 3 shows higher intensities for Ca (393.3 nm; 396.8 nm),K (766.523 nm;769.959 nm),and Mg(279.418 nm; 285.080 nm).The lowest intensities of mint samples for K (766.523 nm; 769.959 nm)and Na (588.952 nm) show in Anhui and Hebei provinces,respectively.Hubei and Jilin provinces are high in C,N and K(247.725 nm; 746.918 nm; 766.523 nm; 769.959 nm).However,figure 3 reveals the high standard deviation reflecting the significant fluctuation in the intensities of spectral emission lines from mint samples.Obviously,it is not easy to discriminate the GOs by the single element.
3.2.Multivariate analysis
3.2.1.Identifcation geographical origins by PCA.PCA was first applied on the total 99 dataset to probe the critical spectral features in the LIBS dataset [43,44].In PCA,a 99 (objects)×13204 (variables) data matrix was submitted for PCA.The first five principal components(PC1–5)demonstrate 91.07%of the total variability in the original data.Figure 4 displays the projection of the LIBS spectral database for the principal components.The first three principal components(PCs)explain 80.51% of the total variance in the dataset.Clearly,the large dispersion and local overlapping classes are present along the PC directions,which may attribute to the mineralogical variability of each class.Due to the unsupervised nature,PCA cannot provide classification automatically.Yet PCA is a valuable technique for exploring similarities among classes.

Figure 3.Bar plots representing major emission lines in the LIBS spectra of mint samples.Each bar is an average of 20(or 19)such intensity and the error bars were their standard deviation.
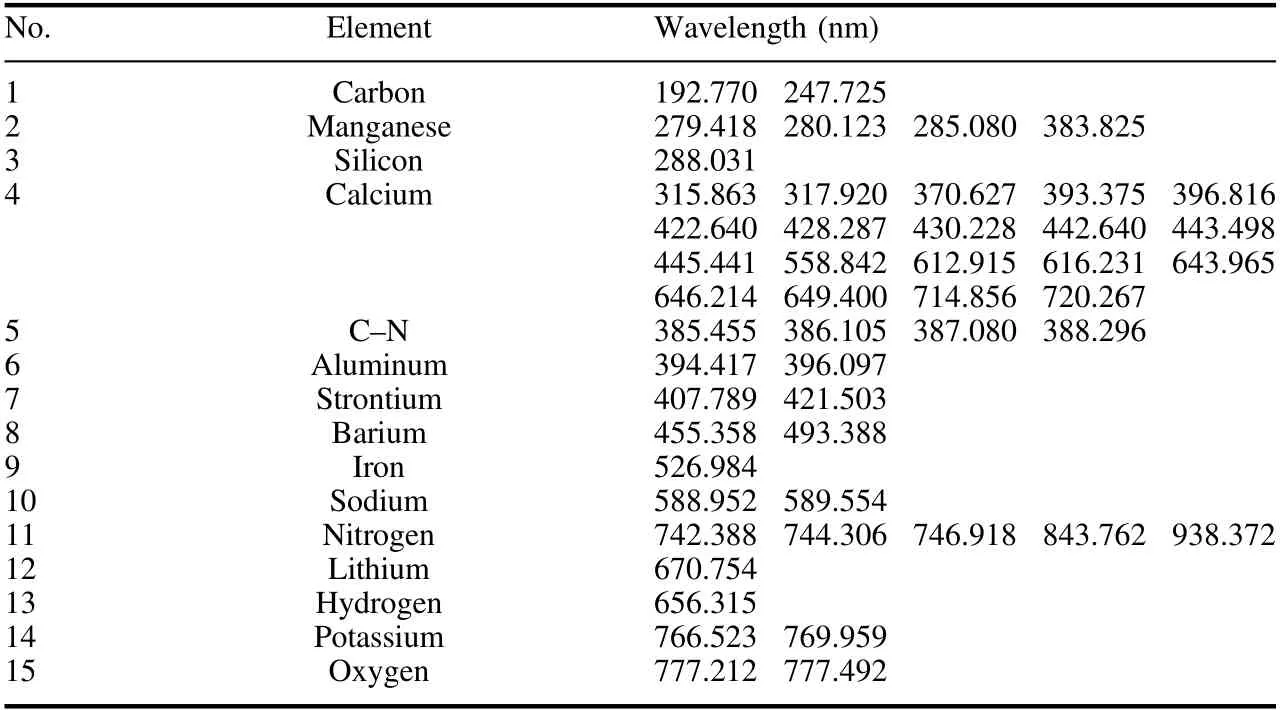
Table 2.Elemental emission lines used in the spectral fingerprinting of the mint samples.
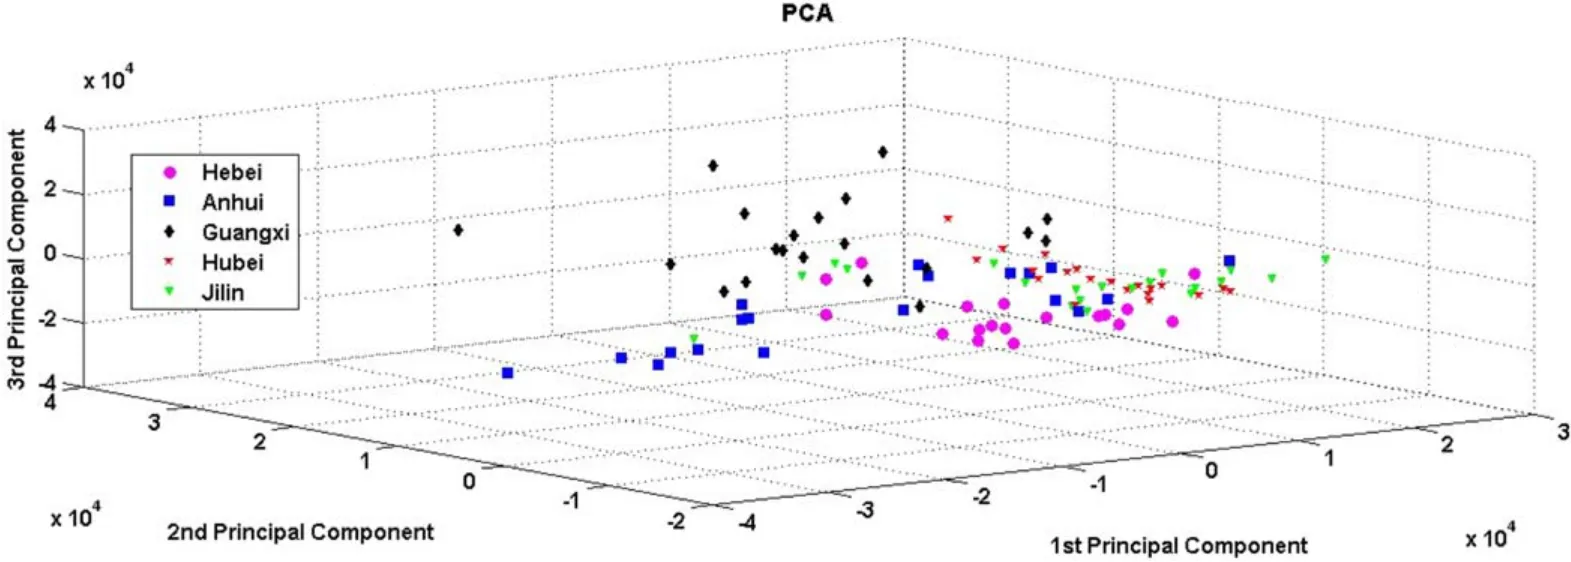
Figure 4.PC scores plot of the three principal components for the spectral dataset acquired from the five GOs of mint samples.
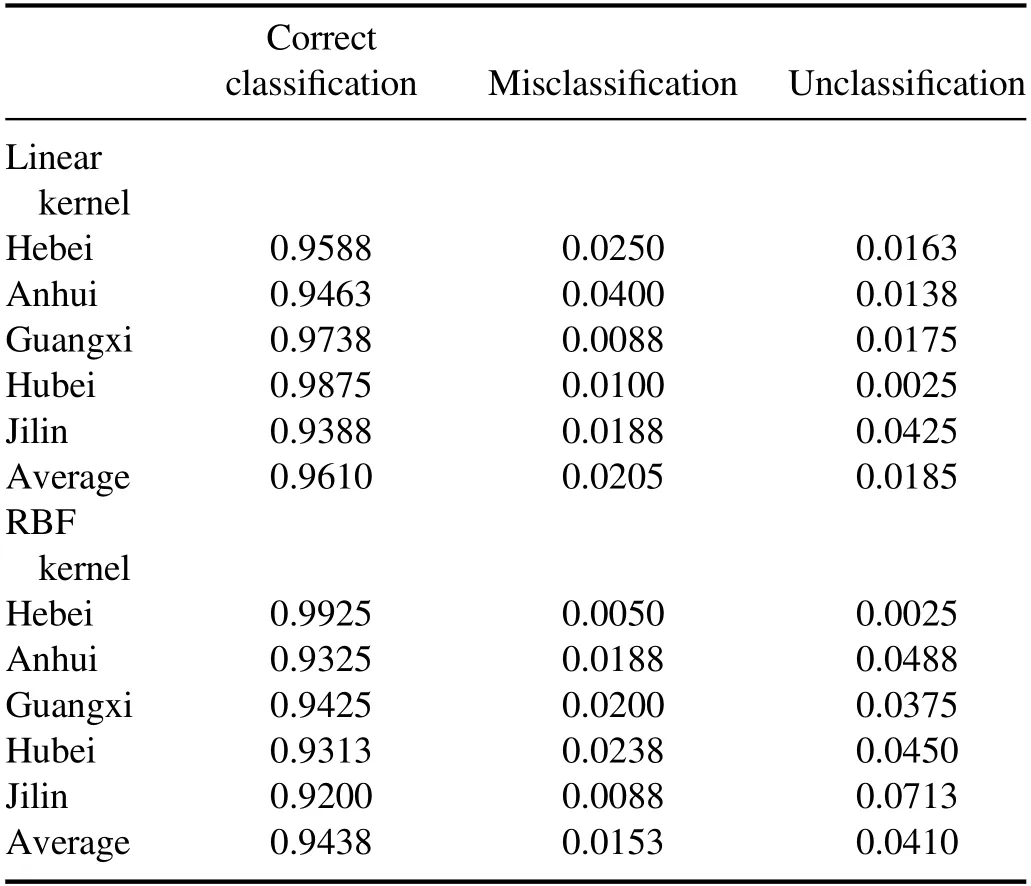
Table 3.Sensitivity test results of mint sample from five GOs.
3.2.2.Distinguishing geographical origins by LS-SVM.Table 3 lists the results of sensitivity test for LS-SVM classification analysis with linear kernel and RBF kernel,respectively.Two models exhibit excellent performance in the sensitivity test.The correct allocation rate in linear metric increases marginally over the corresponding nonlinear one(except for samples from Hebei),but the improvement has no statistical significance in both tests(p > 0.05).Furthermore,the unclassification rate was lower as well.The average rates of correct allocation and unclassification are 96.10%and 1.85%in linear kernel model,94.38% and 4.10% in RBF kernel model.
Table 4 exhibits the performance of LS-SVM in robustness test when each sample is alternately removed from the training set.linear kernel LS-SVM algorithm shows good performance over RBF kernel LS-SVM among Anhui and Guangxi(a highercorrect classification rate as well as a lower misclassification rate).Similar to sensitivity analysis,results of samples from Hebei are prominent in both models.Evidently,RBF kernel LSSVM algorithm shows a fairly high correct classification rate(ca.99.2%) in robustness test of Hebei cases.The result of samples from Hubei and Jilin provides acceptable sensitivity performance(table 3),while the robustness performance is not desirable(table 4).Ominously,samples of Hubei and Jilin still have the highest rate of misclassification or unclassification.Generally,linear kernel shows better performance than RBF kernel in the robustness analysis,in terms of average correct allocation (ca.88% versus ca.86%),but the improvement is not statistically significant(p > 0.05).In summary,these results seem to indicate that LS-SVM presents good performance in dealing with samples of unknown classes,though the correct discrimination rates are still lower than those in sensitivity analysis.

Table 4.Robustness test results of mint sample from five GOs.
Due to massive data reduction,LS-SVM needs only short calculation time.Previous investigators have also noted the advantage of reduced computation time for LS-SVM,in comparison with SIMCA,thus making it valuable screening tool for large LIBS datasets [45,46].Combined LIBS with a suitable nonlinear classification method such as LS-SVM may provide an important tool for GOs classification.Further investigations in a variety of herbs (e.g.herbs and mineral herbs) by LIBS are underway in our lab.
4.Conclusion
Spectral fingerprints of mint obtained by LIBS were applied to discriminate samples according to their GOs.Mineralogical elements of TCM are considered to be more feasible elemental markers for discriminating GOs owing to the biological activity and relatively coming from soil.Common elemental and molecular species such as Ca,Mg,Na,Ba,and CN were identified from LIBS spectra of the sampled mint.However,the similar spectra of various mint samples made classification very difficult by direct visual inspection.Thus multivariate analysis was performed by the LIBS elemental fingerprints to evaluate GO discrimination of the considered mint samples.Findings demonstrated that combined with LS-SVM classification algorithm,LIBS can provide a sensitive and robust tool in GOs discrimination and classification of mint.The LS-SVM method exhibited excellent prediction accuracy in discrimination of blind cases despite the unsatisfactory performance of samples from Hubei and Jilin provinces.
In general,the present study demonstrated the potential of LIBS in future applications of herbal medicine,especially for in situ monitoring applications of geographical authenticity rapidly.Due to the complex matrix composition of herbal medicine,a large number of instances are still being the need to train models.Furthermore,plant samples should be grinded and then made pressed pellets to minimize matrix effects.More comprehensive SVM applications in LIBS measurements are necessary to improve robust performance of current results.The perspective LIBS application to GOs study of medical and food,especially TCM will need a hybrid of chemometric algorithms to exploit the best feature.
Acknowledgments
This work was supported by National Natural Science Foundation of China(Nos.81903796,81603396 and 31870338),the National Key Research and Development Program of China(No.2019YFC1711200),Major new drug innovation project of the ministry of science and technology (2018ZX09201011),Scientific and Technological Planning Projects of Colleges and Universities of Shandong Province (No.J18KA287) and Binzhou Medical University Research Startup Fund Project (No.BY2016KYQD02).The authors declare that they have no conflict of interest.
猜你喜欢
学生天地·小学低年级版(2019年7期)2019-10-08
学生天地(2019年21期)2019-09-20
快乐作文·高年级(2017年11期)2018-01-29
快乐作文·高年级(2017年10期)2018-01-29
故事会(2018年2期)2018-01-18
快乐作文·高年级(2017年9期)2018-01-15
快乐作文·高年级(2017年12期)2018-01-15
快乐作文·高年级(2017年8期)2017-09-18
男生女生(金版)(2016年3期)2017-01-17
妇女生活(2014年7期)2014-09-10
 Plasma Science and Technology2020年7期
- Plasma Science and Technology的其它文章
- Influence of target temperature on femtosecond laser-ablated brass plasma spectroscopy
- Spectral characteristics of underwater laserinduced breakdown spectroscopy under high-pressure conditions
- A novel strategy for quantitative analysis of soil pH via laser-induced breakdown spectroscopy coupled with random forest
- Quantitative analysis of the content of nitrogen and sulfur in coal based on laserinduced breakdown spectroscopy:effects of variable selection
- Quantitative analysis of saindha salt using laser induced breakdown spectroscopy and cross-validation with ICP-MS
- Temporal and spatial evolution measurement of laser-induced breakdown spectroscopy on hydrogen retention in tantalum