
Toad-headed Lizard Phrynocephalus forsythii (Squamata,Agamidae) as a Potential Ring Species Inferred from Population Genetic Differentiation
2020-12-30 06:59YueQILiDINGYangyangZHAOChenkaiNIUXiaoningWANGandWeiZHAO
Asian Herpetological Research 2020年4期
Yue QI,Li DING,Yangyang ZHAO,Chenkai NIU,Xiaoning WANG and Wei ZHAO
Gansu Key Laboratory of Biomonitoring and Bioremediation for Environmental Pollution,School of Life Sciences,Lanzhou University,Lanzhou 730000,China
Abstract Speciation has never been directly observed in nature because it is a lengthy phenomenon.Although rare,ring species are an optimal natural example of speciation and can be identified through the assessment of the geographical conditions of their potential habitat.Phrynocephalus forsythii is endemic to the Tarim Basin,which comprises the Taklamakan Desert and surrounded by mountains on three sides.This study aimed to determine whether P.f orsythii had a ring-species-like divergence pattern through the characterization of the genetic features of 17 populations covering the major distribution of this species.Species distribution modelling revealed that P.forsythii had a continuous circular distribution around the Tarim Basin.Gene flow was observed in most adjacent populations except for two terminal populations of the ring,which exhibit the highest differentiation.Genetic distance and geographic distance were significantly correlated,indicating that the observed differentiation resulted from genetic variation gradually accumulating during population dispersion.Although our results do not definitively indicate that P.forsythii is a ring species,our results indicate a ring-shaped diversification.This phenomenon elucidates the potential mechanism underlying speciation in the presence of gene flow,providing insight into this evolutionary process.
Keywords continuous variation,gene flow,Phrynocephalus forsythii,ring species,Tarim Basin
1.Introduction
Ring species are among the best natural illustrations of speciation (Kuchta,2016).Understanding speciation is a fundamental biological problem.During classical ecological speciation,population fragmentation yields new species from geographically isolated populations of the same ancestral species (Dieckmann and Doebeli,1999; Schluter,2001).However,speciation is gradual phenomenon and thus has not been observed directly in nature.Instead,assessment of ring species may provide insights into speciation,a chain of intergrading populations that encircle a barrier,with terminal forms coexisting without interbreeding (Mayr,1942).Ring species represent a phenomenon wherein reproductive isolation can be produced in the presence of continuous gene flow and genetic variation (Irwin and Wake,2016; Hey et al.,2005).In brief,ring species help us to understand how intraspecific geographical variation generates species-level divergence and are integral to speciation studies (Irwinet al.,2001; Cacho and Baum,2012).
Considering their evolutionary significance,numerous studies have attempted to identify ring species.Ideally,the criteria that should be met are:circular distribution,gene flow,and reproductive isolation (Josephet al.,2008; Qiaoet al.,2018).A typical ring species must first meet the requirements in terms of distribution,in that the sub-populations around a barrier are derived from an ancestral population.Such barriers can consist of regions with a slope around them or environmental variations that do not generate a suitable habitat for a specific species (Irwin,2012; Fuchset al.,2015; Pereira and Wake,2015).Nevertheless,gene flow may link the circular chain of populations around barriers.With an increase in the geographical distance around the ring,genetic variation among populations would also gradually accumulate (Alcaideet al.,2014).This accumulation of genetic differences eventually leads to reproductive isolation between the two sub-populations at the far ends of the chain (terminal populations) (Dufresneset al.,2016; Irwinet al.,2001).
A promising candidate for ring species isPhrynocephalus forsythii,a lizard endemic to the Tarim Basin (Adler andZhao,1993).Surrounded by mountains on three sides,the Tarim Basin also contains the largest shifting-sand desert in central Asia,the Taklamakan Desert (Zhenget al.,2009).Furthermore,the outer circle of the basin is surrounded by an oasis.These environmental conditions provide an ideal environment for the evolution of ring-like species.P.forsythiiis distributed in the oasis around the Tarim Basin (Figure 1) and prefers a habitat with dwarf shrubs (Zhanget al.,2010),a humid environment,and a lower ambient temperature (Qiet al.,2019).Previous studies on the phylogeographic structure ofP.forsythiihave reported that two adjacent populations (MF and RQ) belong to different lineages,thereby indicating the potential for reproductive isolation between these two adjacent populations(Qiet al.,unpublished data).These genetic and distribution characteristics renderP.forsythiian excellent candidacy for the assessment of ring species.Therefore,this study aimed to determine whetherP.forsythiihad a ring species-like divergence pattern by characterization of its genetic structure and gene flow.
2.Materials and Methods
2.1.Ethics statementAll experiments were approved by and were in accordance with the Ethics Committee of the School of Life Sciences,Lanzhou University.
2.2.Sampling and species distribution modellingThis study included 210 specimens from 17 localities,encompassing majority of the distribution range ofP.forsythii(Table S1 and Figure 1).Field identification was based on external morphological characteristics (Zhuet al.,1999).
The current potential of the species and suitable range were estimated using Maxent version 3.3.3 (Elithet al.,2011; Phillipset al.,2006).Field records and the literature yielded 29P.forsythiioccurrences (Zhanget al.,2010) (Table S2).Environmental data included 19 bioclimatic variables from the WorldClim database(http://www.worldclim.org/; Hijmanset al.,2005) (Table S3);spatial resolution was 2.5 arc minute (~4 km).Model complexity was evaluated with “ENMeval” in R 3.6.1 (R Core Team 2017),through the determination of the Maxent-corrected AIC under different parameters.Thirteen variables were included in the final analysis.Species distribution modeling (SDM) was performed using Maxent,with occurrence data randomly segregated into 80% training and 20% testing data.This model used the default convergence threshold,5,000 maximum iterations,and 10 replicates.An ROC curve close to 1 indicated a better model performance (Phillipset al.,2006).
2.3.Laboratory analysesDNA was extracted from muscle samples,using the TIANamp Genomic DNA Kit (Qiagen,Beijing,China) in accordance with the manufacturer’s instructions.Three mitochondrial genes (ND2,ND4,andCyt-b)were amplified.Primers were designed using PRIMER 6.0.PCR annealing temperatures are enlisted in Table S4.Sequences were assembled manually using SeqMan 7.1.0 in DNA Star,aligned in BioEdit version 7.1.3.0 (Hall,1999),and concatenated using Sequence Matrix 1.7.8 (Vaidyaet al.,2011) for further analyses.All mitochondrial markers were deposited in the GenBank database (accession nos.MK803503-MK804072 and MN872429-MN872473).
Genomic DNA was incubated at 37℃ with MseI (New England Biolabs,NEB),T4 DNA ligase (NEB),ATP (NEB),and MseI Y adapter N containing barcode,and fragments of 350 bp in size were isolated using a Gel Extraction Kit (Qiagen) in accordance with the manufacturer’s instructions.Thereafter,the genomic DNA of the samples was amplified via PCR,and the constructed libraries were sequenced using the Illumina HiSeq sequencer with a 150-bp paired-end sequencing strategy.The sequencing quality requirement for most bases was set at >Q20.Raw reads were filtered to eliminate reads containing adapters or reads of low quality,such that downstream analyses were then based on clean reads.The whole-genome sequencing data ofPhrynocephalus vlangalii(GWHAAFC00000000) were used as the reference genome.Sequencing data were then aligned with the reference sequence using the BWA software (parameters:mem -t 4 -k 32 -M) (Li and Durbin,2009).SAMTOOLS(mpileup -m 2 -F 0.002 -d 1000) was used to detect SNP of individuals (Liet al.,2009).
2.4.Data analysis
Phylogeographic analysisBayesian analyses were performed using AIC in MrBayes 3.2.6 (Huelsenbeck and Ronquist,2001) with the GTR+I+G model selected by MrModeltest 2.3 (Nylander,2004).For the Bayesian analysis,20 million generations with the Markov Chain Monte Carlo (MCMC)simulations were performed until the average SD of split frequencies decreased to <0.01; the initial 25% were discarded as burn-in frequencies.Simulations used the default model parameters starting from a random tree.Outgroups wereP.axillarisandP.mystaceus.All tree files were visualized using Figtree 1.3.1.
Population genetic analysisPairwiseFST(betweenpopulation differentiation) and isolation-by-distance were estimated using Arlequin 3.5 (Excoffieret al.,2005).In this program,genetic distance is determined asFST/(1-FST).Straightline geographic distances and ring distances among the sites were used to analyze isolation by distance.Ring distances were determined as geographic distances,assuming that dispersal routes follow ring distribution rather than straight lines across the uninhabitable desert.Phylogeographic analysis suggested a genetic “gap” between populations RQ and MF.Thus,MF was selected as the origin and RQ as the terminus to determine the ring distance among all populations (Qiet al.,unpublished data).Correlations between genetic and geographic distances were determined using a Mantel test with 1000 permutations and Arlequin 3.5.
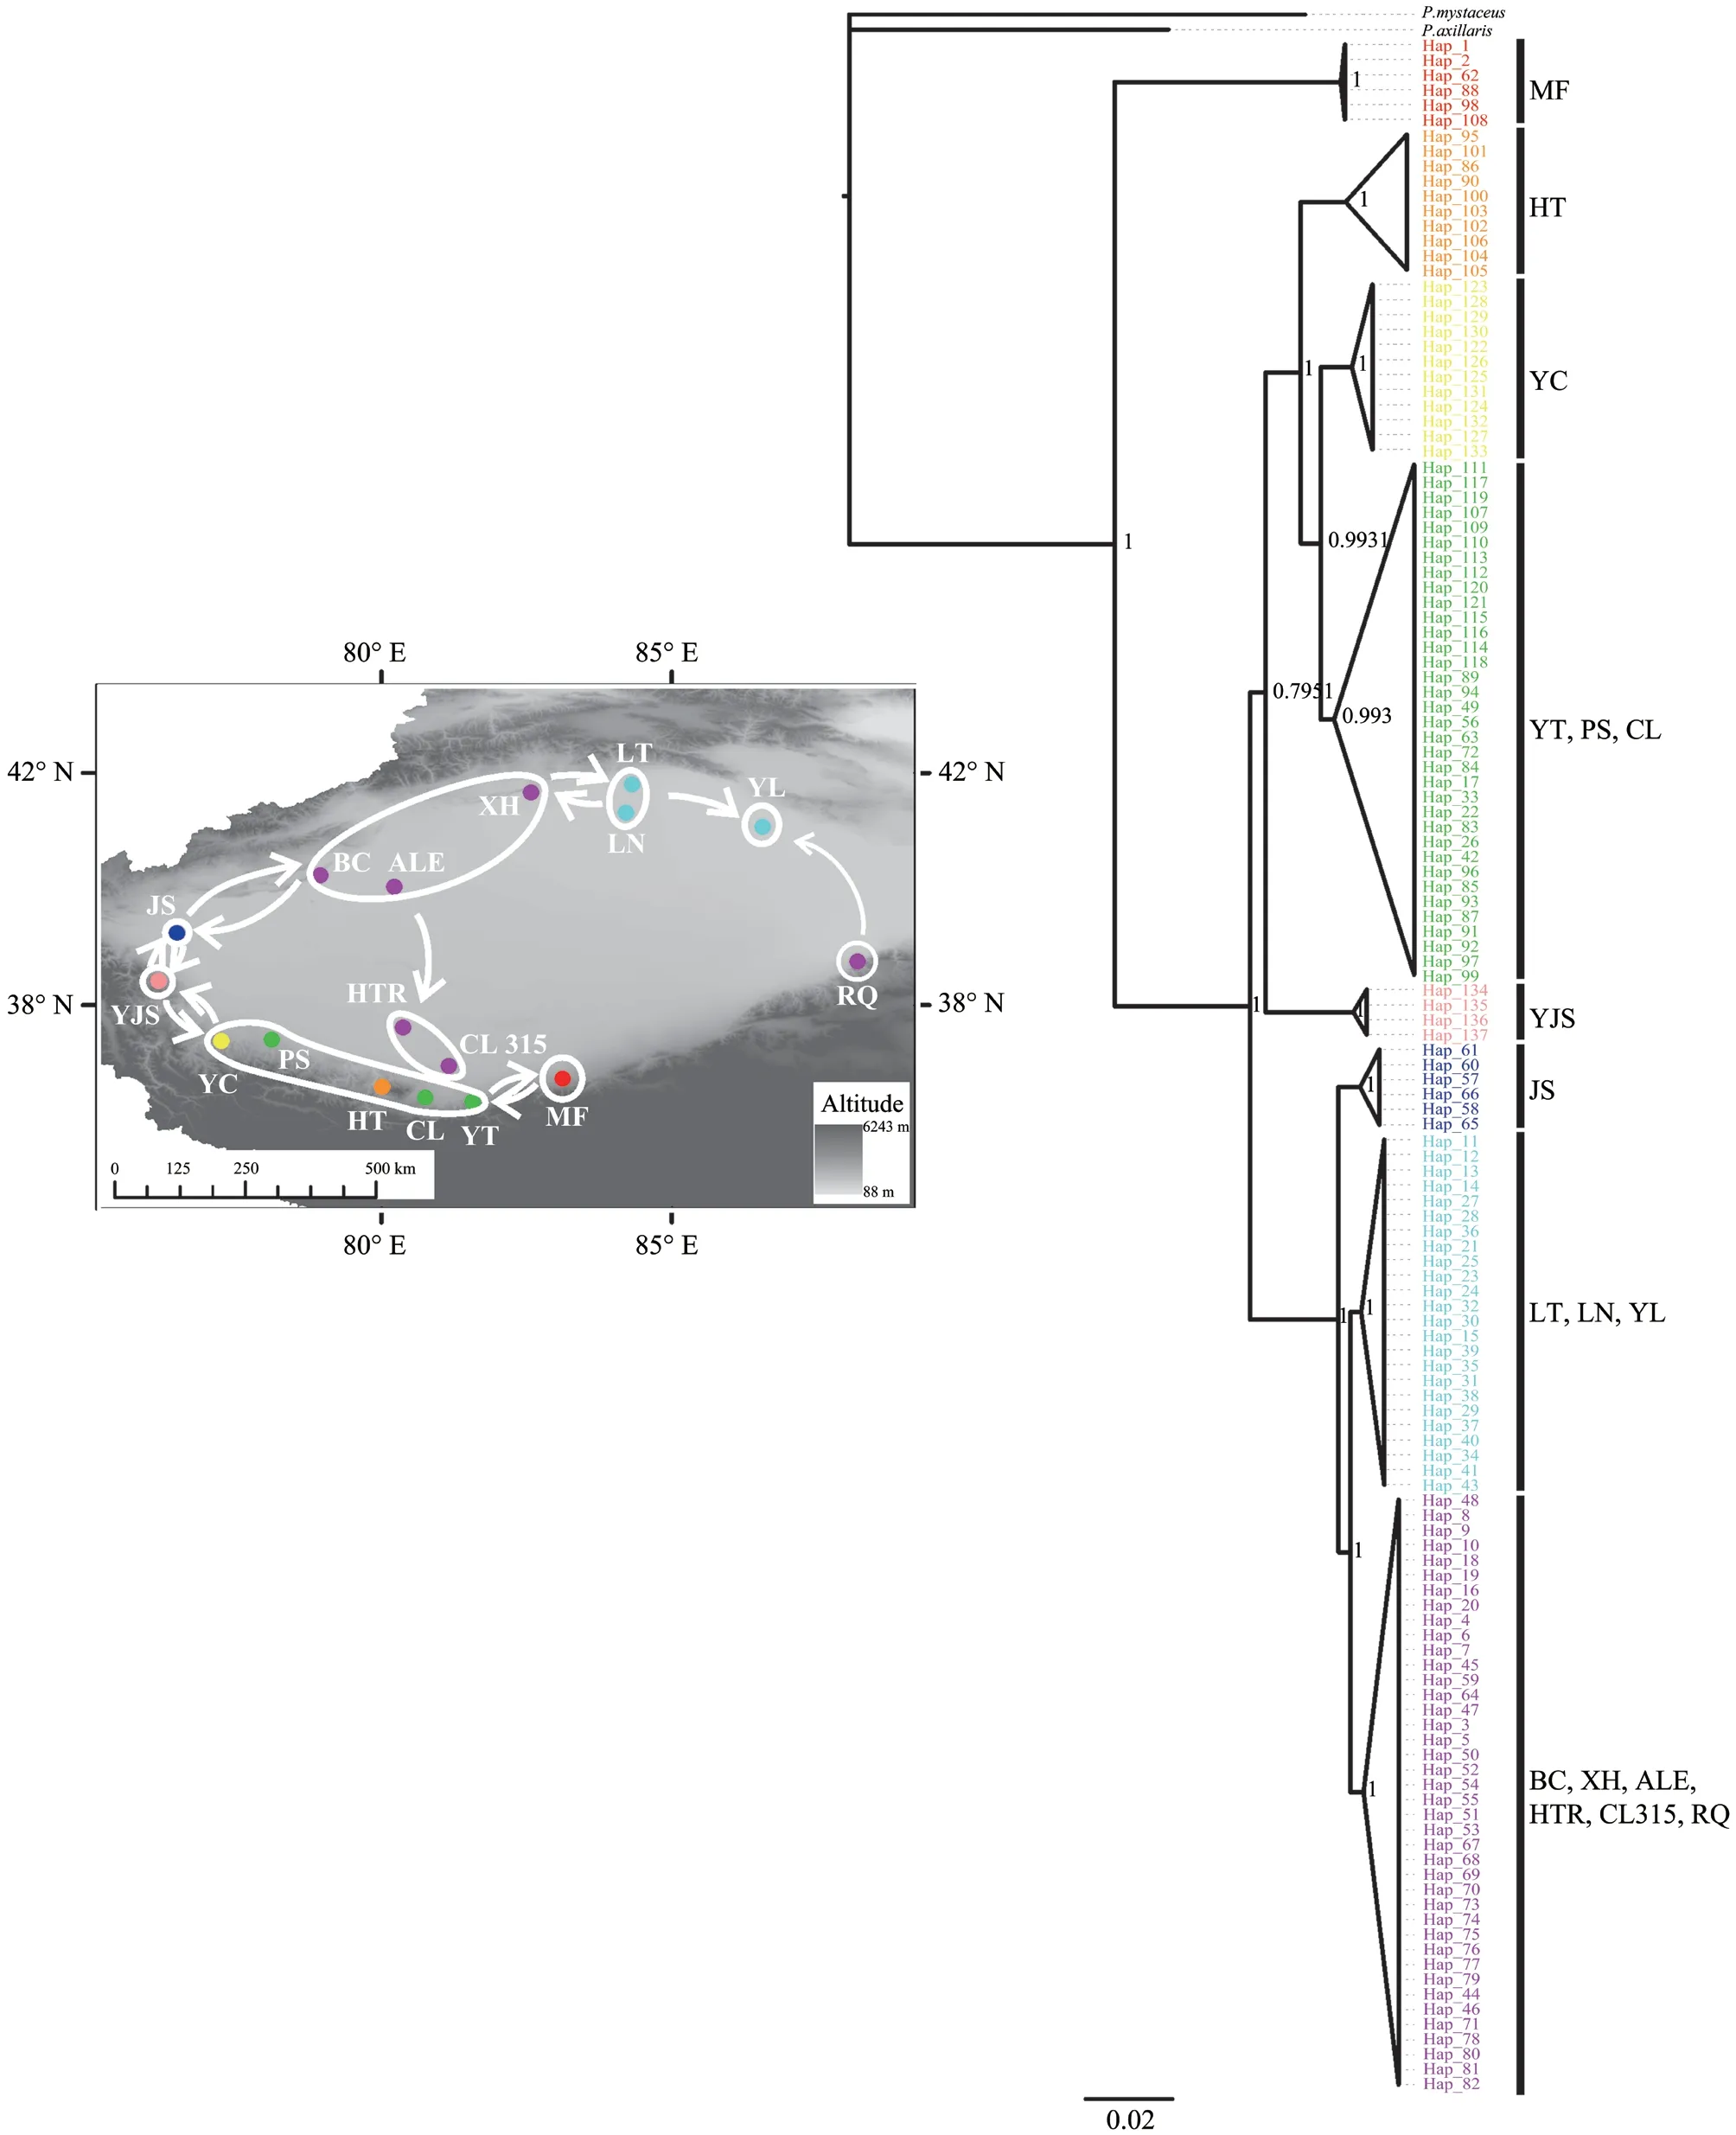
Figure 1 Geographical features and locations of sampling sites.For locality names,see Table S1.Dot color corresponds to population structure derived from the phylogenetic tree.Arrows represent direction of gene flow.All populations were divided into nine groups based on phylogeny:Group1,MF; Group 2,HT,YT,YC,PS,CL; Group 3,YJS; Group 4,BC,XH,ALE; Group 5,LN,LT;Group 6,JS; Group 7,YL; Group 8,RQ; Group 9,HTR,CL315.
Gene flow between populationsUsing maximum-likelihood migration rates,between-population gene flow was estimated using Migrate 3.7.2 (Beerli,1997).This approach uses MCMC searches to account for unequally effective population sizes and asymmetrical gene flow (Beerli and Felsenstein,1999).As in some lineages,populations were not continuously distributed geographically; rather,they were divided by populations from other lineages.The present grouping strategy was thus determined through the phylogenetic structure and geographic distribution of all populations.All populations were divided into nine groups,and gene flow was determined (Figure 1).Initial values of effective population sizes and gene flow were estimated fromFST.The analysis involved 10 short chains (500 trees used out of 10,000 sampled) and three long chains (5000 trees out of 100,000).Results from 10 runs were averaged and 95% confidence intervals were summarized.
Furthermore,population divergence and mixing patterns were inferred fromP.forsythiiSNP data in TreeMix 1.13(Pickrell and Pritchard,2012; Wanget al.,2015).Custom Perl scripts were used to enumerate the variation of all individuals into populations.Thereafter,a maximum-likelihood tree was estimated and migration events were superimposed over it,such that the tree with the added migration episodes accounts for a greater proportion of the overall genetic variance.We allowed for 10-11 migration events.The final results were visualized using R 3.6.1.
To better estimate historic gene flow between populations from MF and RQ,we used IMa2 based on the IM model(Hey,2010b) with mtDNA data.In this analysis,demographic parameters,including divergence time (t),effective population size of each extant population (q0andq1) and the ancestor (q2),and migration rates (m0andm1) between two groups,scaled by the mutation rate,were estimated.The maximum priors for the parameters used for IMa analyses weret=5,q=10,andm=100.In the simulations,we conducted each IMa simulation for 100000 steps with a burn-in of 100000 steps.
3.Results
3.1.Prediction of species distributionSDM analysis revealed that this model was a good fit with an AUC of >0.9.The most suitable habitats forP.forsythiiwere around the Basin (Figure 2),with the western region being more habitable than the eastern region.Finally,we observed a gap in the inhabitable region along the eastern region.
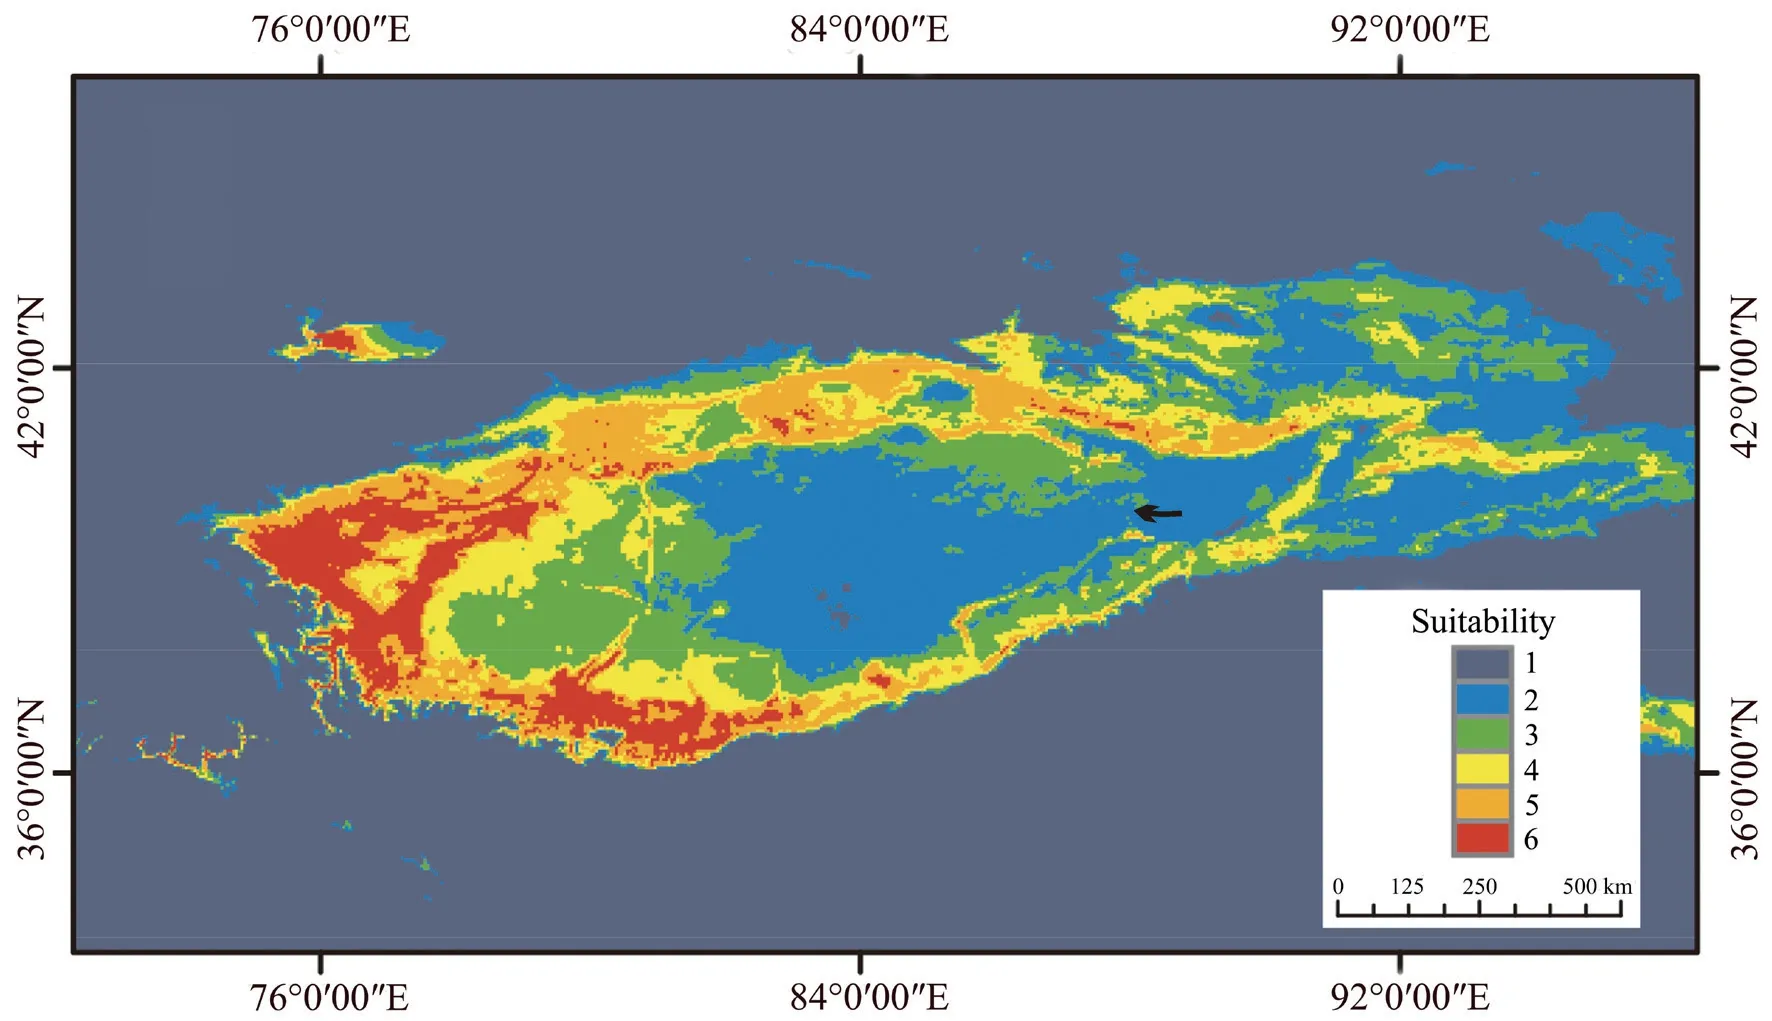
Figure 2 Distribution models for Phrynocephalus forsythii.Warmer colors represent greater likelihood of occurrence (red=6,blue=1).Scale bar indicates occurrence probability.The arrow points represent the distributed gap points.
3.2.Sequence data
Mitochondrial DNAWe obtained 210 mitochondrial gene sequences with an average length of 3538 bp and identified 137 haplotypes (Table S1).The nucleotide composition was as follows:A=0.351,C=0.270,G=0.132,and T=0.247.
Single-nucleotide polymorphismsSequencing of the GBS library comprising 146 samples yielded 786522636 clean reads with an average of 5387141 reads per sample.We successfully mapped 755235460 reads,and the average mapping rate was 96.05%.Finally,544574 SNPs were filtered from 11710171 raw SNPs.
3.3.Population genetic analysis
Phylogeographic analysesHaplotypes derived from the Bayesian analysis of the 17 populations formed three distinct clusters:first,the population from Minfeng (the Minfeng Group),was separated from all other populations,and the other populations were grouped into two clades with nonoverlapping distribution:six populations located to the north of the Tarim Basin formed a large distinctive group (the northern group:JS,LT,LN,YL,BC,XH,ALE,HTR,CL315 and RQ),and nine populations located in the south of Tarim Basin formed a second distinctive group (the southern group:HT,YC,YT,PS,CL and YJS) (Figure 1).
Population analysesPairwiseFSTdiffered significantly from zero (P< 0.001) (Table S5).PairwiseFSTwas the greatest between MF and RQ despite their adjacent distribution.Genetic distance and ring distances were positively correlated(Mantel’sr=0.407,P< 0.001),consistent with a pattern of isolation by distance around the ring (Figure 3).Furthermore,the correlation between straight-line geographic distances and genetic distance was significant (Mantel’sr=0.243,P=0.02)(Figure 3).
Gene flowMost adjacent groups exhibited gene flow except for groups 1 (MF) and 8 (RQ) (Figure 1; Table S6).Concurrent with the mtDNA results,predicted migration events revealed frequent gene exchange between adjacent populations (Figure 1).Integrating Migrate and TreeMix data revealed a geneflow model of ring species,thereby indicating that almost all adjacent populations displayed gene flow except for MF and RQ.Furthermore,historic gene flow analysis based on IMa2 indicated no gene flow between MF and RQ.The migration rates (2NM) from MF to RQ and vice versa were 0.05062 and 0.04556,respectively.However,gene flow was confirmed only when 2NM values were significant in an LLR test (P< 0.05 or less) (Hey,2010a; Nielsen and Wakeley,2001).The present results showed that the migration rate (2NM) from MF to RQ and vice versa was not significant.Therefore,we considered that there was no gene flow between MF and RQ (Table 1).
4.Discussion
Our results show thatP.forsythiiconforms to the ring species model.First,theP.forsythiirecorded distribution and SDM data indicated that it had a continuous circular distribution around the Tarim Basin.Second,populations of MF and RQ are linked by a chain of interbreeding populations wrapping around the Tarim Basin.Finally,these two terminal populations,MF and RQ,are genetically distinct.

Figure 3 Genetic distance (calculated from mtDNA) increases with geographic distance around the ring.A:Correlation when “ring distances” are used.B:Correlation when straight geographic distances between sites are used.We assumed no direct gene flow between MF and RQ or across the center of the ring.Ring distances approximate potential gene flow between populations around the Tarim Basin.
The distribution ofP.forsythiipopulations along the ring structured in a manner similar to that of the ring species model (Alcaideet al.,2014).Although SDM implied the presence of a gap in the eastern region of the basin,the distribution between MF and RQ was continuous.Therefore,we consider theP.forsythiidistribution to be ring-shaped.Such a ringshaped structure may result from the development of a dense hydrological network around the Tarim Basin and the expansion of the Taklimakan desert.Phylogeographic analysis revealed that after populations first differentiated from MF,the western populations (e.g.,JS and YJS) diverged from the northern and southern groups,respectively.Accordingly,we speculated thatP.forsythiioriginated from the northern side of the Kunlun Mountains.Thereafter,the remaining populations dispersed northward and eastward along the edge of Tarim Basin.The divergence time of the northern group and the southern group coincide with the formation of rivers and oases around the Tarim Basin and the expansion of the Taklimakan(Qiet al.,unpublished data).These geological features probably explain the ring-shaped distribution structure observed herein inP.forsythii.Furthermore,the Taklimakan Desert is a barrier similar to that observed withPhylloscopus trochiloides,a classic ring species in Asia,which is isolated by a large treeless gap(Irwinet al.,2001).We thus speculate that after MF initially differentiated,the remainingP.forsythiipopulations expanded along the basin.
Our Migrate and TreeMix results provided the strongest evidence for a gene flow pattern that supportedP.forsythiias a ring species.In particular,we found no break in gene flow throughout the ring of populations,except between MF and RQ (Figures 1 and 4).This generally uninterrupted gene flow is due to short-distance dispersal in a continuously distributed species (Josephet al.,2008).Our previous studies onP.forsythiipopulation history indicate that they have not experienced rapid expansion (Qiet al.,unpublished data).Therefore,we can speculate that,after initially differentiating from the northern and southern groups,the westernmost populations gradually spread eastward.Therefore,the short-distance dispersal was probably a gradual process amongP.forsythiithat eventually led to gene flow between adjacent populations (Slatkinet al.,1993).
Finally,ourFST,migration and IMa analyses among populations consistently displayed restricted gene flow among terminal populations MF and RQ,suggesting some degree of reproductive isolation (Figure 1 and Table S5).As expected ina ring species,MF and RQ are associated with populations within the chain.Although these other populations exhibit gene flow,we could also detect gradual and continuous genetic variation among them.The finding of a markedly strong correlation between genetic distance and geographic distance(Figure 3) indicates that variation in genomic composition will increase as populations move further away from each other during species dispersal.Adjacent populations would therefore possess very few genetic differences,whereas distant populations will accumulate enough differences,resulting in reproductive isolation (Slatkin,1993).Previous studies have similarly suggested that long-distance dispersal in a continuously distributed species results in isolation by distance(Irwinet al.,2005).

Table 1 Maximum-likelihood estimates (MLE) and 90% highest posterior density (HPD) intervals of demographic parameters from IMa multilocus analyses

Figure 4 Inferred maximum-likelihood trees of mixture events.Abbreviations are the same as in Table S1.Graphs inferred for all populations,allowing ten (A) and eleven (B) migration events.Migration arrows are colored in accordance with their weight.
Owing to the lack of a direct evidence of reproductive isolation,we cannot definitively claim thatP.forsythiiis a ring species (Irwinet al.,2001; Pereiraet al.,2011).However,the ring-shaped diversification ofP.forsythiiis notable as a clear manifestation of speciation processes,and we can consider our study populations as intermediate transition species (Niemilleret al.,2008; Nosil,2008).Environmental changes may interrupt the ring-species model by breaking these populations into two or more species that do not exchange genes (Gavriletset al.,1998; Doebeli and Dieckmann,2003).Global warming,a known threat toP.forsythii(Sinervoet al.,2018; Qiet al.,2019),may cause the obliteration of some populations and interrupt the chain.Thus,a major challenge for modern evolutionary biology is to develop strategies that can protect the balance between gene flow and isolation mechanisms among potential ring species such asP.forsythii.In addition to these long-term implications,our work also deepens our existing understanding of species formation.
AcknowledgementsThe study was supported by the National Natural Science Foundation of China (No.31471988 and No.31200287).
 Asian Herpetological Research2020年4期
- Asian Herpetological Research的其它文章
- Characterization of Skin Symbiotic Bacteria of Sympatric Amphibians in Southeastern China
- Taxonomic Revision of Raorchestes menglaensis (Kou,1990) (Amphibia:Anura),with Descriptions of Two New Species from Yunnan,China
- Description of a New Species of the Asian Newt Genus Tylototriton sensu lato(Amphibia:Urodela:Salamandridae) from Southwest China
- Reevaluation of the Holotype of Odorrana schmackeri Boettger,1892(Amphibia:Anura:Ranidae) and Characterization of One Cryptic Species in O.schmackeri sensu lato through Integrative Approaches
- The Effect of Attendance Patterns on the Lek Mating System in the Omei Treefrog (Rhacophorus omeimontis)
- No Male Preference for Large Females in the Asian Common Toad(Duttaphrynus melanostictus):Effect of the Sex Ratio and Breeding System