
Use of the alkaline phosphatase to prealbumin ratio as an independent predictive factor for the prognosis of gastric cancer
2021-01-13 07:43YangLiJinShenWangYunGuoTaoZhangLePingLi
World Journal of Gastroenterology 2020年44期
Yang Li, Jin-Shen Wang, Yun Guo, Tao Zhang, Le-Ping Li
Abstract
Key Words: Gastric cancer; Prognosis; Alkaline phosphatase; Prealbumin; Evaluating efficiency
INTRODUCTION
Gastric cancer (GC) is a malignant tumor with a high mortality and recurrence rate worldwide[1]. Although the prognosis of GC has significantly improved due to technological advancements, it is still not satisfactory[2,3]. Hence, researchers are conducting studies with the aim of identifying effective and independent prognostic factors for the evaluation of postoperative survival among GC patients[4,5].
Alkaline phosphatase (ALP) is widely distributed in the human liver, bone, intestine, kidney, placenta, and tissues. Clinically, it is mainly used for the diagnosis and differential diagnosis of skeletal and hepatobiliary system diseases, particularly those characterized by jaundice[6,7]. Patients with some tumors have elevated serum ALP levels[8,9]. Moreover, ALP levels can be used as an independent prognostic factor for GC, with preoperative high ALP levels being a poor prognostic factor. However, there are only a few articles supporting these findings[10-12].
Prealbumin (PA) is synthesized by hepatocytes and is mainly used as a sensitive nutritional protein index in the diagnosis and differential diagnosis of hepatopathy and nephropathy[13]. Moreover, it is used as a nutritional index to evaluate the prognosis of cancer patients[14,15]. Furthermore, previous studies have shown that patients with low preoperative PA levels have poor prognosis[16,17].
However, there are no relevant reports on the significance of the serum ALP to PA ratio (APR) on the prognosis of GC. This is the first study to propose the use of the preoperative APR as an independent factor for the evaluation of GC prognosis.
MATERIALS AND METHODS
Study population and data collection
A total of 985 patients with different types of gastric tumors underwent treatment. Of these patients, 409 GC patients were included in the study, from January 2016 to December 2016. The diagnosis of GC was mainly based on esophagogastroduodenoscopy, biopsy specimen analysis, computed tomography (CT) scan, or magnetic resonance imaging (MRI) findings. Of the 409 patients, 353 underwent surgery, and 56 patients who experienced metastasis refused surgery and chose other treatment methods, such as radiotherapy or chemotherapy.
Based on the patients’ medical history and relevant examinations such as CT, MRI, positron emission tomography or laboratory tests, the exclusion criteria were as follows: (1) Patients with other types of gastric tumors, such as gastric stromal tumor, lymphoma and so on; (2) Patients with hepatitis; (3) Pregnant women; (4) Those with other primary tumors in addition to gastric lesions; (5) Those with a recent fracture or those recovering from a fracture; (6) Those undergoing chemoradiotherapy or other treatments affecting the serological examination results within 1 mo before hospitalization; (7) Those taking drugs significantly affecting the ALP level within a week before the collection of blood samples; and (8) Patients with significant renal or lung problems.
Clinical characteristics of the participants
The tumor stage in each patient was based on pathology and was reclassified according to the 8thedition of the American Joint Committee on Cancer/Union for International Cancer Control[18]. Detailed data on clinical characteristics, including age, gender, tumor-node-metastasis (TNM) stage, degree of differentiation, human epidermal growth factor receptor 2 (HER-2) status, and tumor markers, including glycoprotein antigen 199 (CA-199) (U/L), carbohydrate antigen 125 (CA-125) (U/L), and carcinoembryonic antigen (CEA) (ng/mL), were collected. The degree of differentiation and HER-2 status were identified based on biopsy and immunohistochemistry findings. The results of the patients’ preoperative examinations, such as routine blood and liver function tests, were also collected. The ALP (U/L) to PA (mg/L) ratio (APR), neutrophil (109/L) to lymphocyte (109/L) ratio (NLR)[19], C-reactive protein (CRP) (mg/L) to albumin (g/L) ratio (CAR), platelet (109/L) to lymphocyte ratio (PLR), and lymphocyte to monocyte (109/L) ratio (LMR) in each patient were calculated based on the relevant serum concentrations using blood samples. For comparison, we considered stages 1 and 2 as early stage and stages 3 and 4 as advanced stages. The same division strategy was also adopted for T and N stages. The degree of differentiation was categorized as low, moderate-low, moderate, highmoderate, and high differentiation. Data on overall survival (OS) and disease-free survival (DFS) after treatment were recorded.
Statistical analyses
Patients were divided into two groups according to the best APR cut-off value, which was calculated using R software (version 3.6.1). Differences in continuous variables between the two groups were evaluated using the Mann–WhitneyUtest. The chisquare test was used to compare categorical variables. The Kaplan–Meier method was used to assess survival rates, and the log-rank test was utilized for comparison. A multivariate Cox regression analysis was performed to identify factors independently associated with survival. Statistical analyses were performed using the statistical package for the Social Sciences software (version 23.0). GraphPad Prism 8, Photoshop, and R software (version 3.6.1) were used for analyses.
RESULTS
Clinical characteristics of the participants
The number of patients for each index is shown in Table 1. Missing APR and CAR values were attributed to the missing PA and CRP values. Missing data on T and N stages were mainly attributed to unresectable tumor or lack of surgery. Thus, the exact T and N stage could not be identified. Missing data on differentiation and HER-2 status was attributed to a lack of relevant immunohistochemical pathology results.
According to the optimal cutoff APR value (0.388), patients were divided into the APR-high (n= 207) group and the APR-low (n= 199) group (Table 2). There weresignificant differences in terms of age, gender, and TNM stage between the two groups. Patients in the APR-high group were older than those in the APR-low group (average age: 62.1 yearsvs58.7 years,P< 0.05), and the proportion of female patients was also higher (26.1%vs17.6%,P= 0.0385). In addition, the proportion of patients with advanced disease (stages 3 and 4) was higher in the APR-high group than in the APR-low group (76.3%vs47.2%,P< 0.05). In terms of T stage, the proportion of patients with T3 and T4 was higher in the APR-high group than in the APR-low group (84.0%vs54.9%,P< 0.05). In terms of regional lymph node metastasis (N stage), the proportion of patients with N2 and N3 was also significantly higher in the APR-high group than in the APR-low group (55.2%vs32.4%,P< 0.05). The comparison of M stage between the two groups was also significant, and approximately 18.4% of patients in the APR-high group presented with distant metastasis. There was no significant difference in terms of tumor differentiation and HER-2 status between the two groups. Overall these results showed that patients with a higher preoperative APR presented with a more advanced clinical stage of the disease.
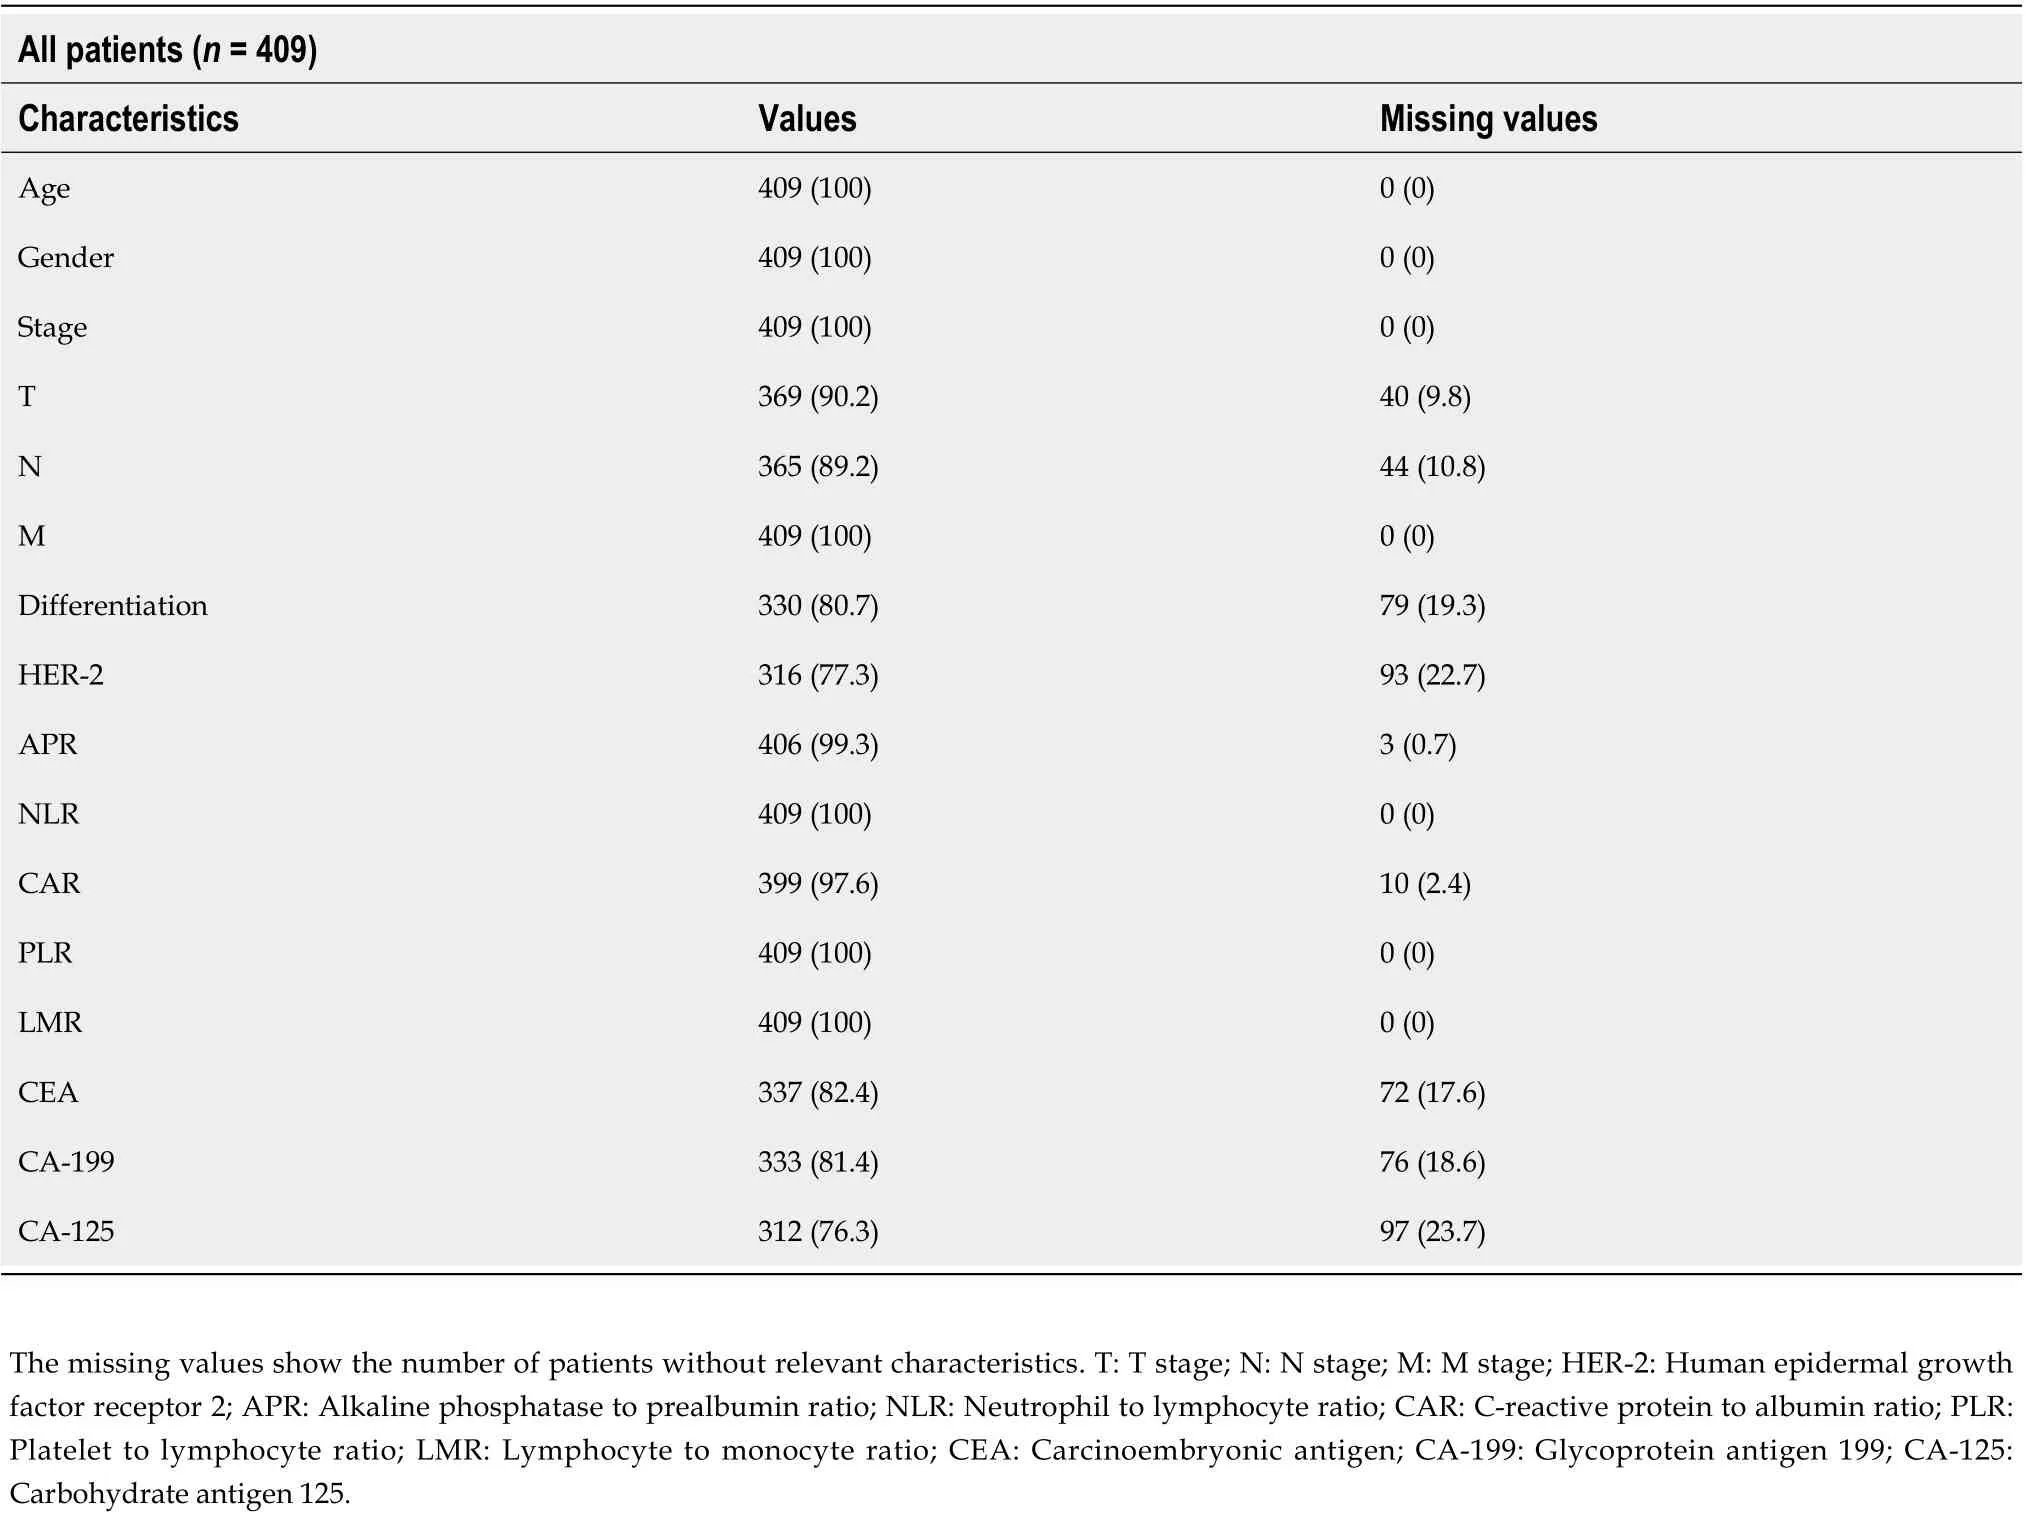
Table 1 Values and missing values of patients according to each characteristic, n (%)
Comparison of NLR, CAR, PLR, LMR, and tumor marker levels
We also compared the NLR, CAR, PLR, LMR, and tumor marker levels between the two groups, which are considered important prognostic factors for GC (Table 3)[19-23]. We found that the median NLR, CAR, and PLR in the APR-high group were higher than those in the APR-low group (2.09vs1.87, 0.07vs0.02, 162.5vs133.5,P< 0.05), and the LMR of the APR-high group was lower than that of the APR-low group (3.79vs4.57,P< 0.05). Regarding tumor markers, patients in the APR-high group had higher median CA-199 (13.74vs11.52,P= 0.0374) and CA-125 (12.76vs10.14,P= 0.002) levels than those in the APR-low group. The CEA level in the APR-high group was also higher than that in the APR-low group. However, the difference was not significant (median: 3.0vs2.42,P= 0.053).
These results showed that GC patients with a high APR had higher inflammatory indices, such as NLR and PLR, and tumor marker levels, which indicated a worse prognosis.
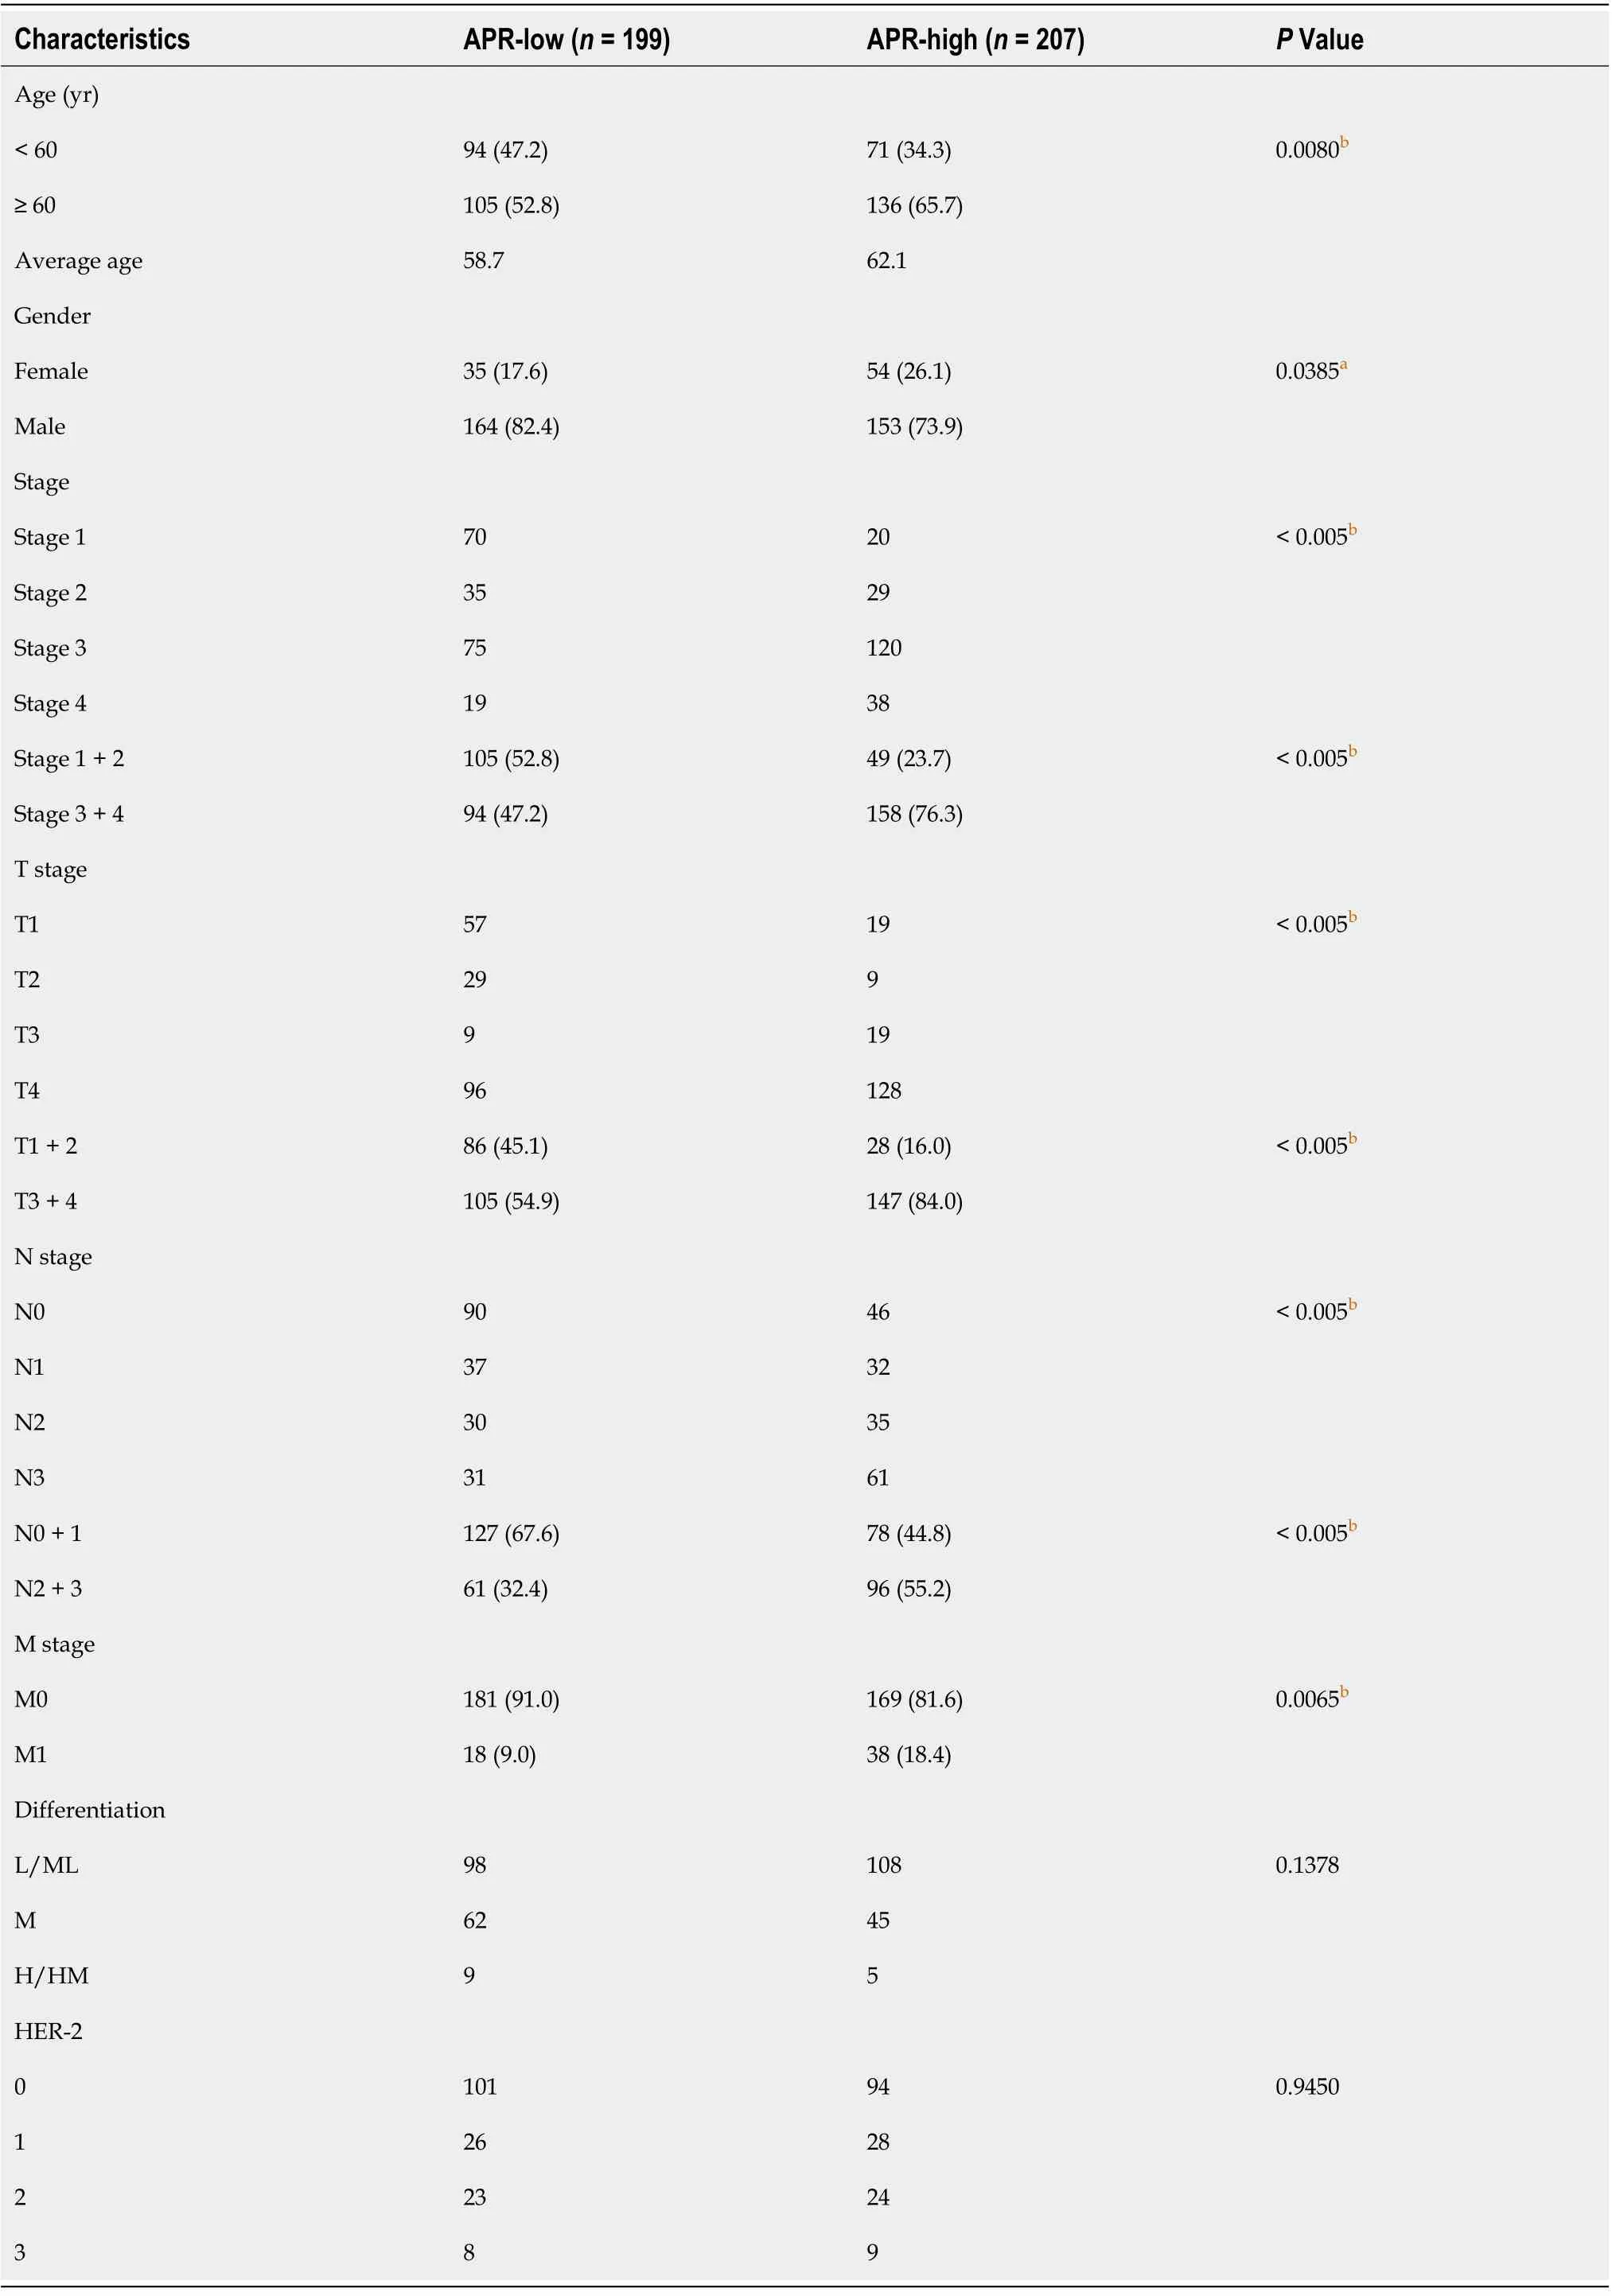
Table 2 Clinical characteristics of patients in the alkaline phosphatase to prealbumin ratio-low and -high groups, n (%)
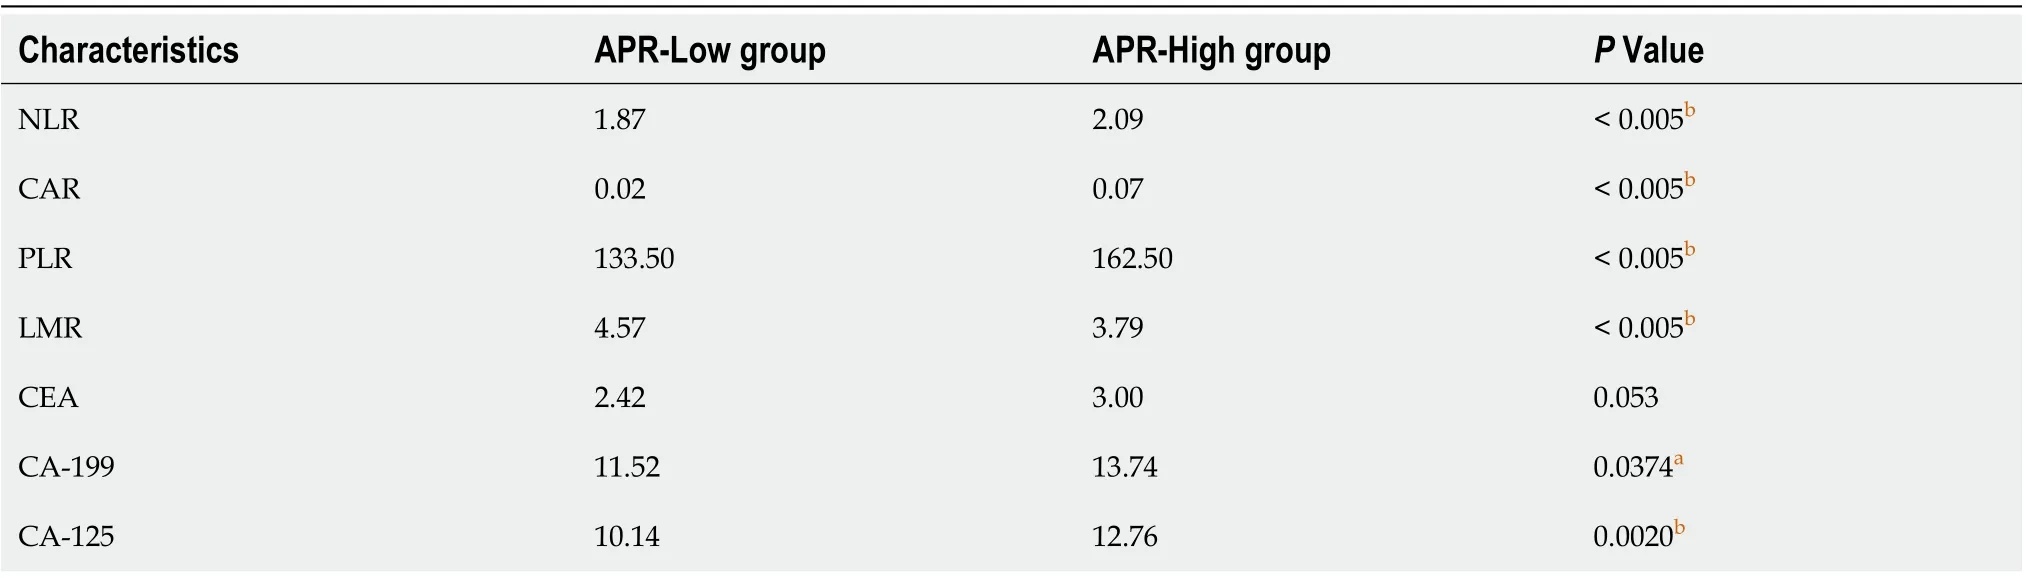
Table 3 Median neutrophil and lymphocyte ratio, C-reactive protein to albumin ratio, platelet to lymphocyte ratio, lymphocyte to monocyte ratio, and tumor marker levels
Association between APR and survival
A total of 83 patients were lost to or refused follow-up. Kaplan–Meier (KM) survival analysis of OS and DFS in the remaining 323 patients was performed, and the results showed that OS and DFS in the APR-high group were significantly poorer than those in the APR-low group (Figure 1). In addition, KM survival analysis was also performed according to NLR, CAR, PLR, and LMR. The results showed that the group with low NLR, CAR, and PLR had better survival than the group with high NLR, CAR, and PLR (Figures 2A-C). However, patients with a low LMR had poorer survival than those with a high LMR (Figure 2D). These results were consistent with those of other studies showing the effect of NLR, CAR, PLR, and LMR on GC[24].
Multivariate survival analysis
A multivariate survival analysis was conducted to identify independent prognostic factors by converting the indices to categorical variables (stage 1 + 2/stage 3 + 4; age < 60/≥ 60; APR, NLR, CAR, PLR, and LMR grouped with the category used in the KM analysis). Following multivariate analysis, and excluding stage, we found that the APR was an independent prognostic factor for both OS (HR: 0.4; 95%CI: 0.31-0.70;P< 0.01) and DFS (HR: 0.51; 95%CI: 0.34-0.76;P< 0.01) (Figure 3A). Furthermore, NLR was an independent prognostic factor for DFS (HR: 0.57; 95%CI: 0.37-0.89;P= 0.01). The function of other indices was not significant.
Subsequently, using different independent indicators, we constructed Cox regression models and analyzed the receiver operating characteristic curve to compare their efficiency. All patients were randomly divided by R software (seed = 123) into a training (n= 150) and a validation group (n= 165). As shown in Figure 3B, the efficiency of the model with APR and stage was better than that of stage alone for OS [area under the curve (AUC)-OS: Training 0.877vs0.84, validation 0.846vs0.794]. On the other hand, the AUC of NLR and stage model for DFS was better than that of stage alone, but poorer than the model with APR and stage (AUC-DFS: Training 0.876vs0.858vs0.852, validation 0.836vs0.813vs0.796).
Patients were divided into two groups according to the risk score established by the APR and stage and, as shown in Figure 4, the survival time of the high-risk group was significantly shorter than that of the low-risk group. Furthermore, the number of deaths was significantly higher than that in the low-risk group (Figure 4). Overall, the results indicated that the APR is an independent prognostic factor for GC, and that the combination with stage could help us make a more accurate judgment of the prognosis of patients.
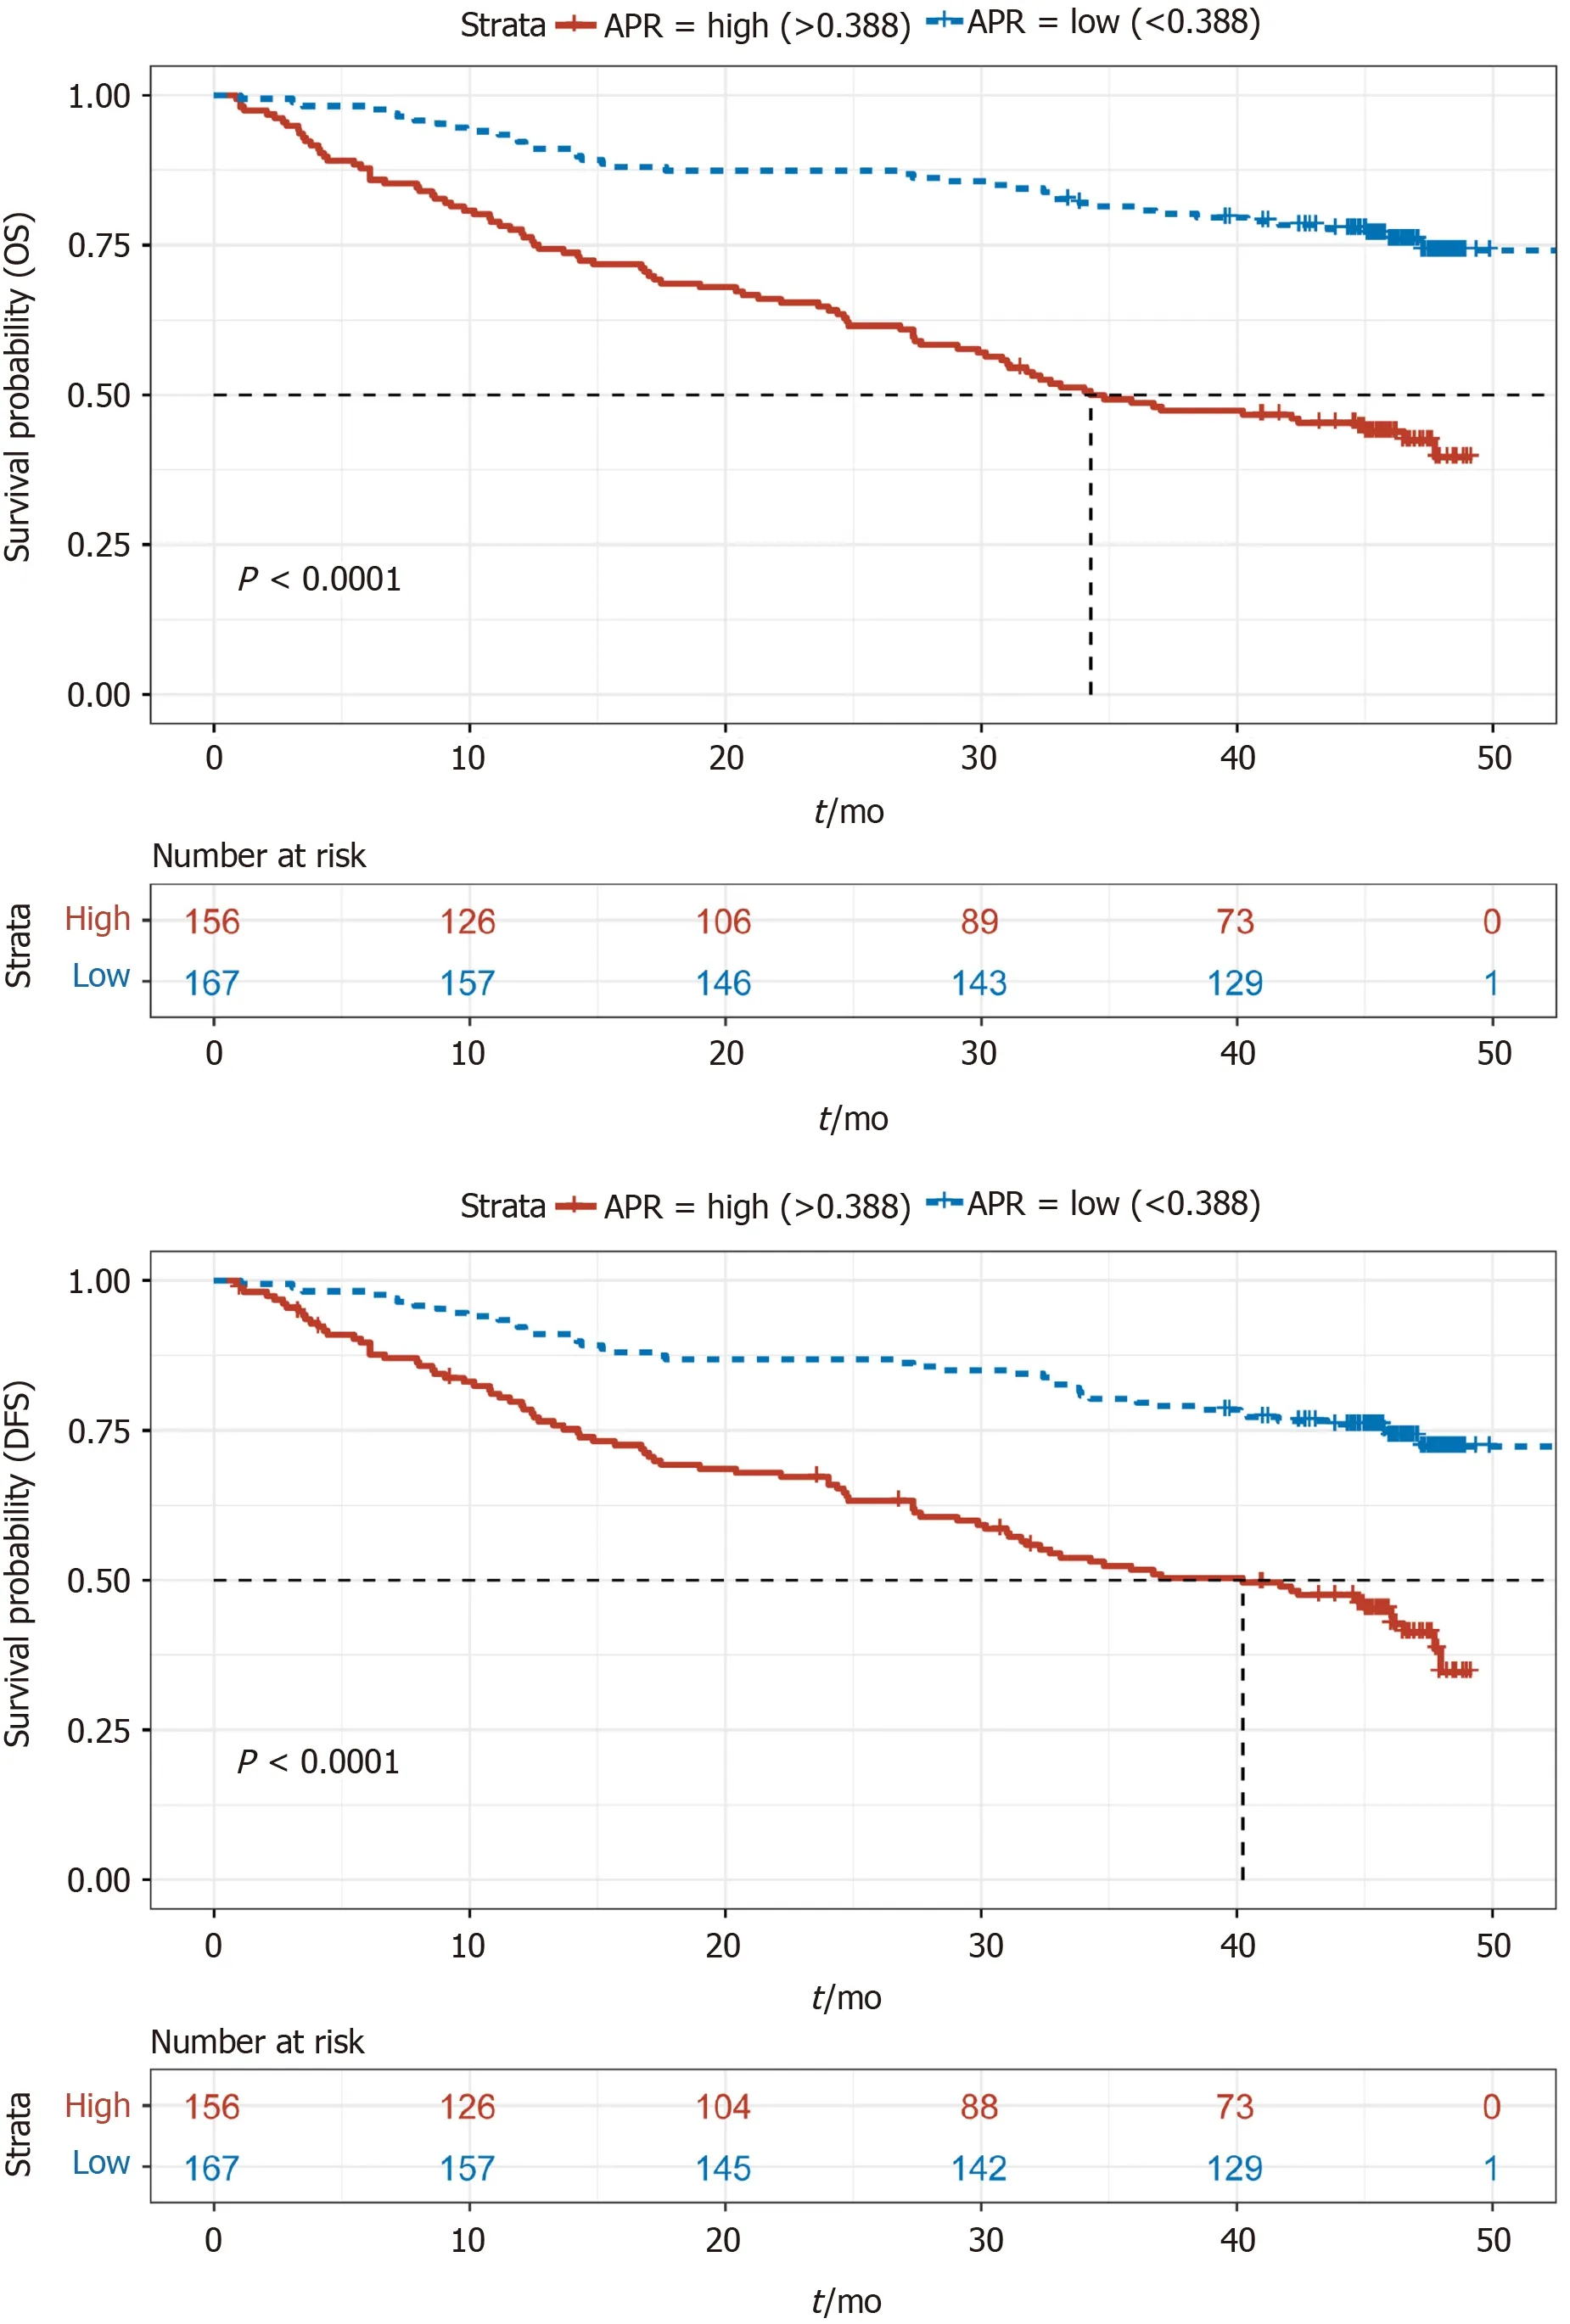
Figure 1 Comparison of overall survival and disease-free survival between the alkaline phosphatase to prealbumin ratio-low and -high groups. APR: Alkaline phosphatase to prealbumin ratio.
DISCUSSION
GC has a high recurrence and mortality rate, and its 5-year survival rate is still not ideal. Thus, there is a need for new indicators that could be used to evaluate patient outcomes.
ALP is widely distributed in the human liver, bone, intestine, kidney, and placenta, and its levels are significantly increased in some individuals, such as those with liver diseases, pregnant women, and those with fractures. Previous studies have also shown that patients with tumors, such as bone, colorectal, and breast tumors also have increased serum ALP levels[25-28]. Furthermore, some studies have indicated that GC patients with a higher preoperative ALP level may have a worse prognosis. Although only a few articles support this notion[10,29], this result suggests that ALP may have a potential role in the evaluation of tumor prognosis, including GC.
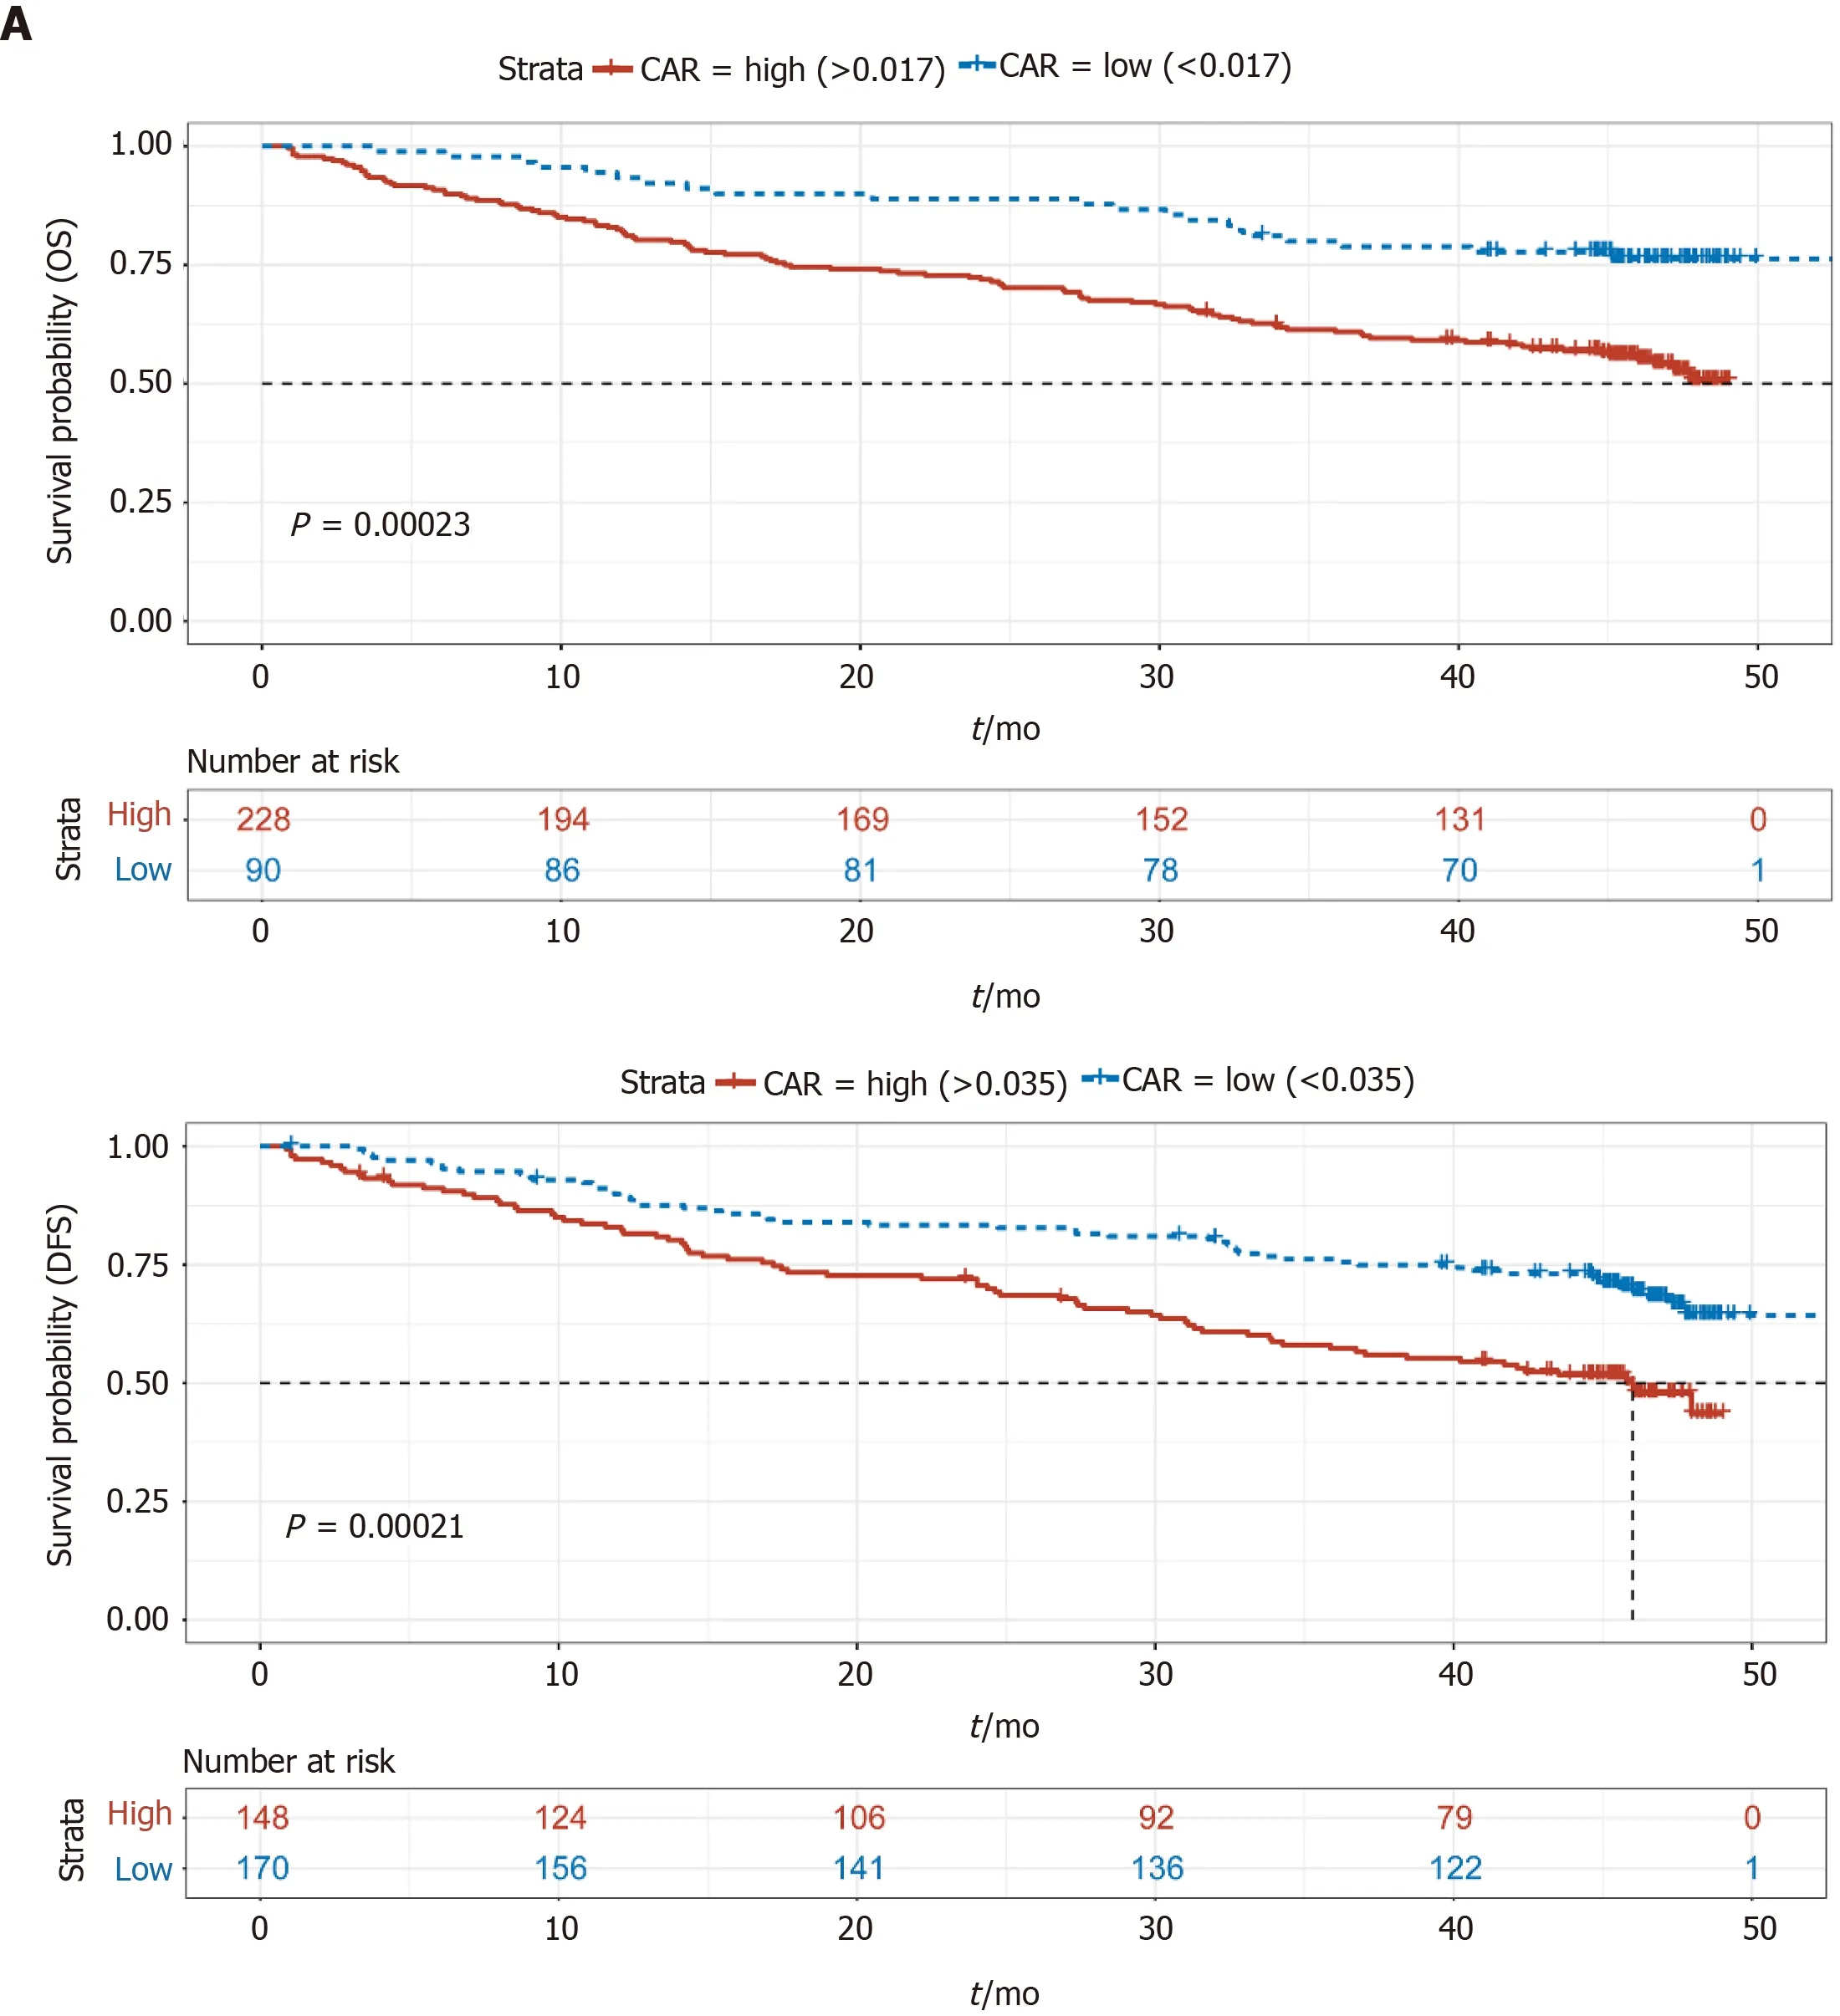
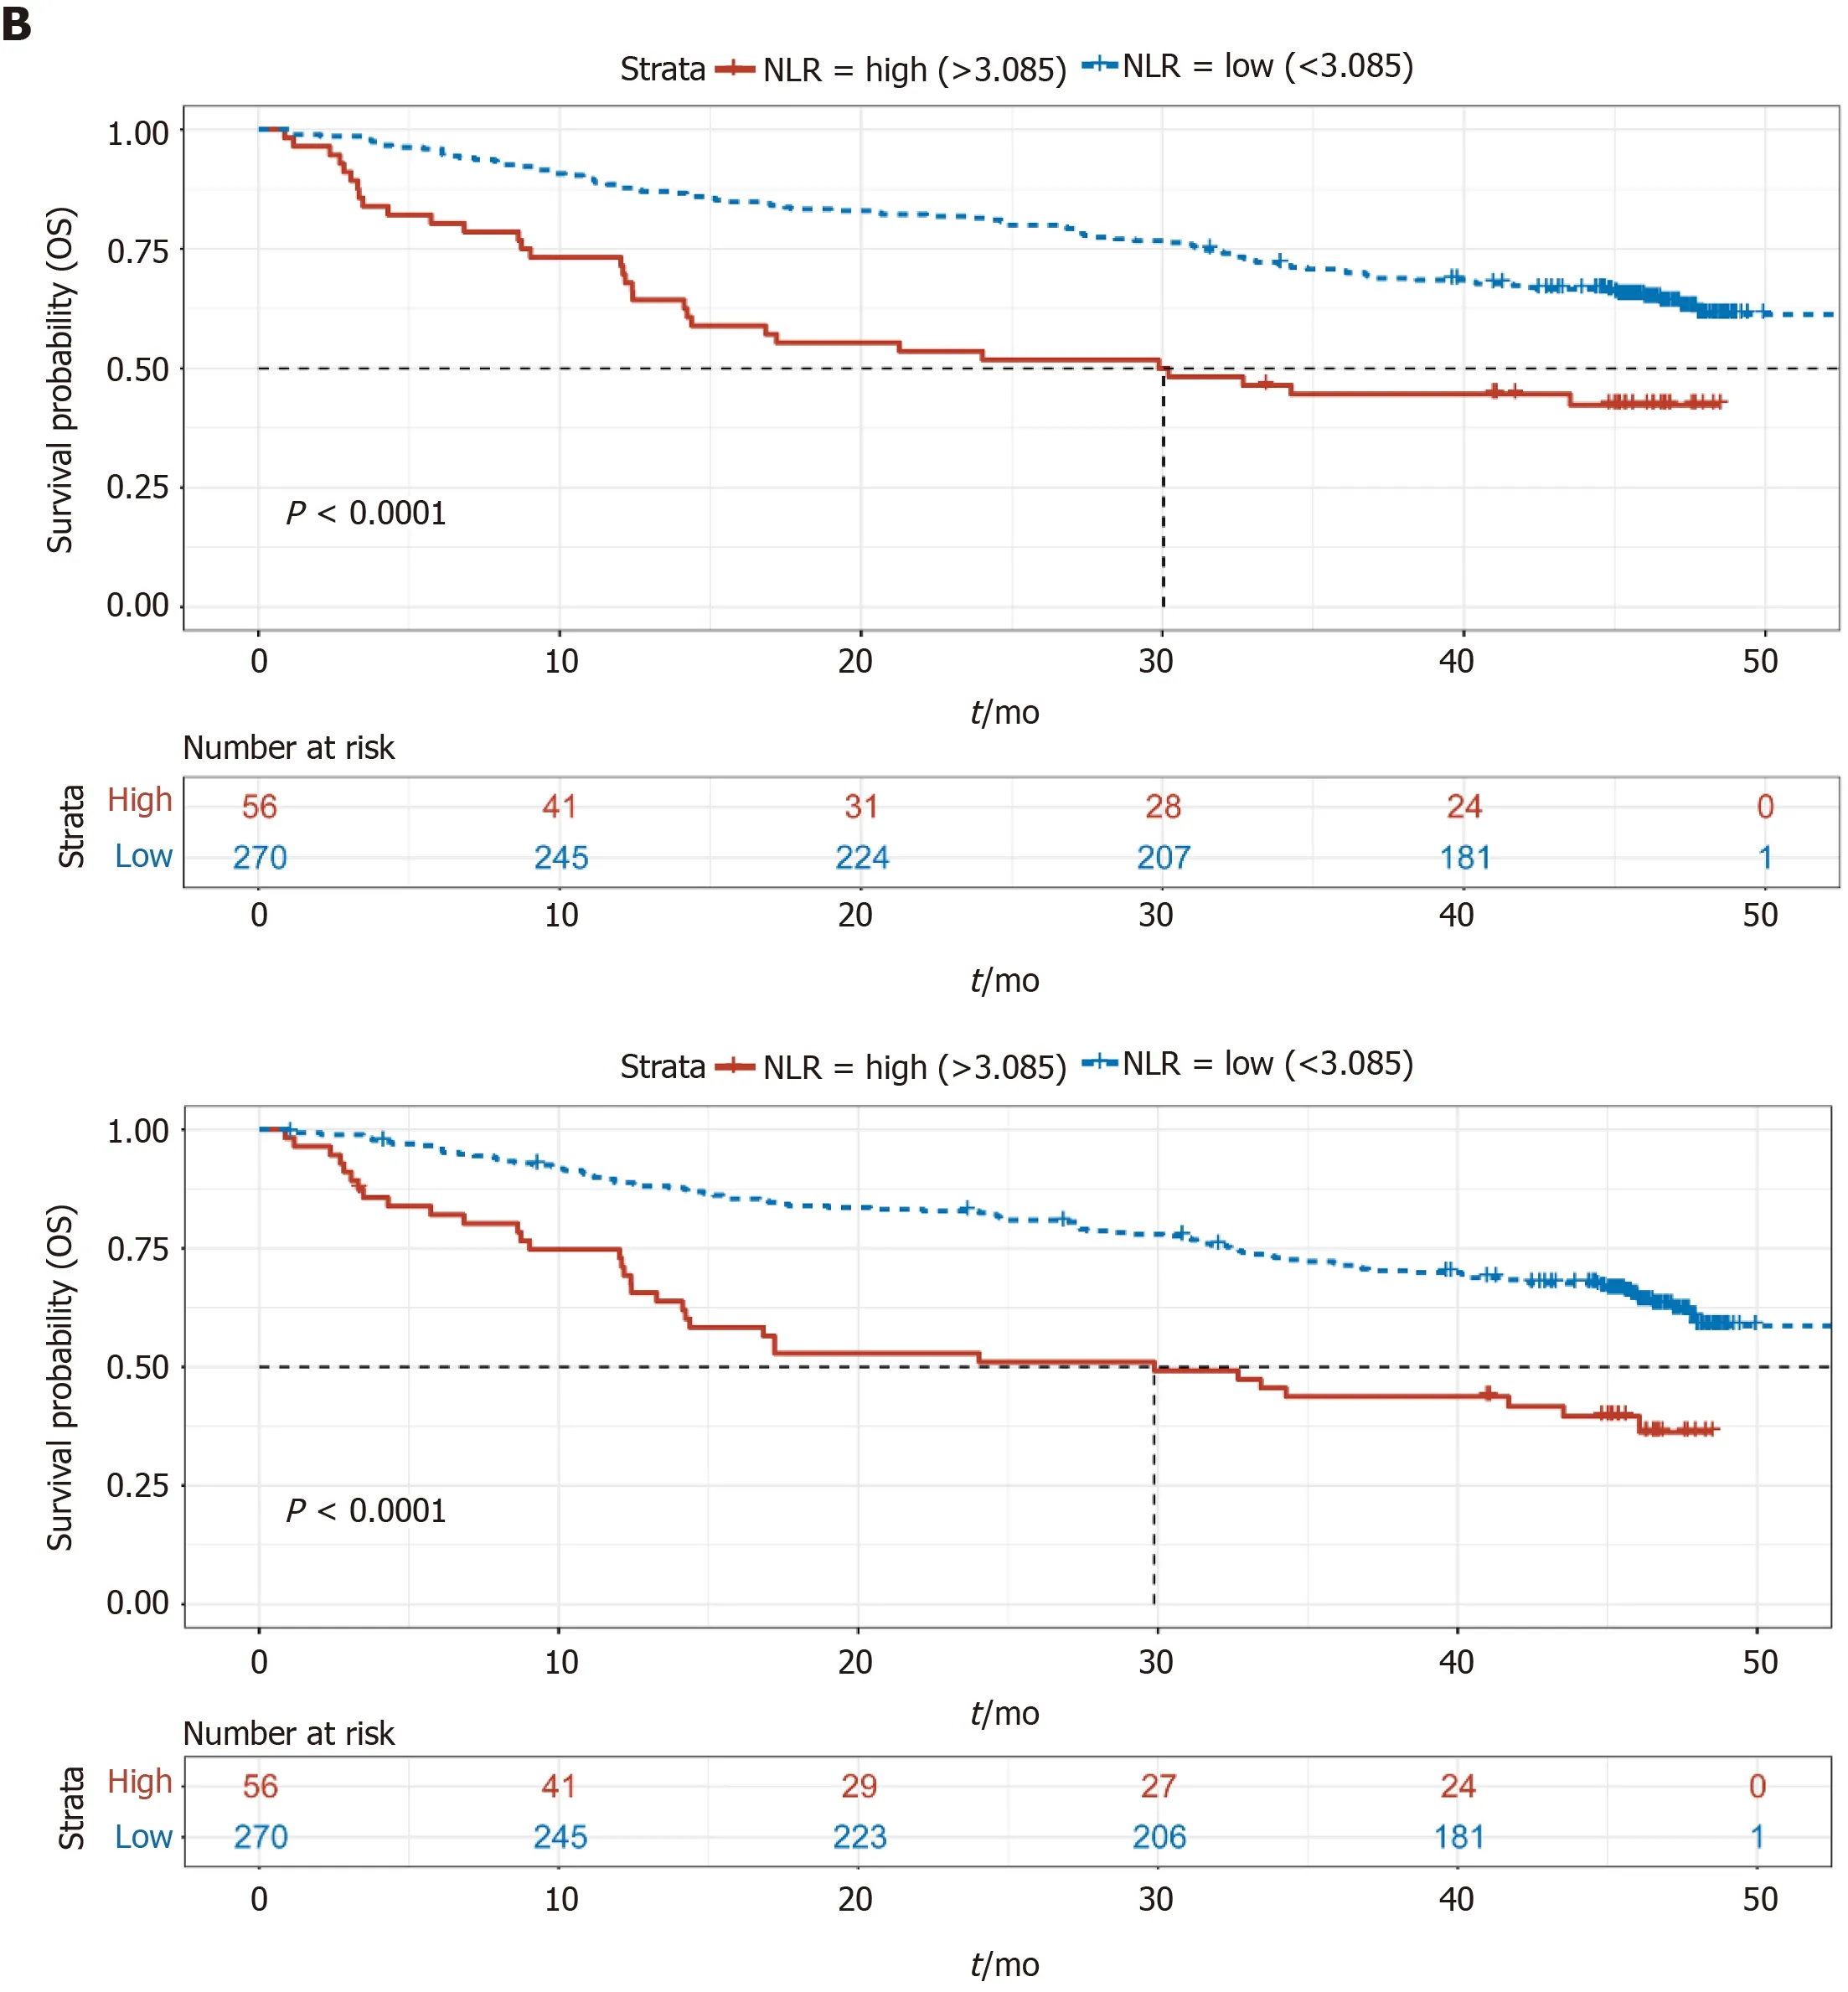
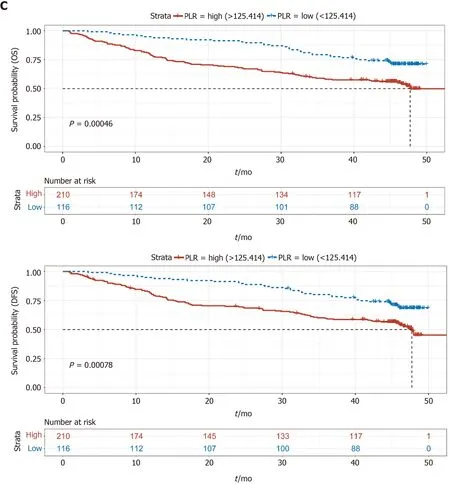
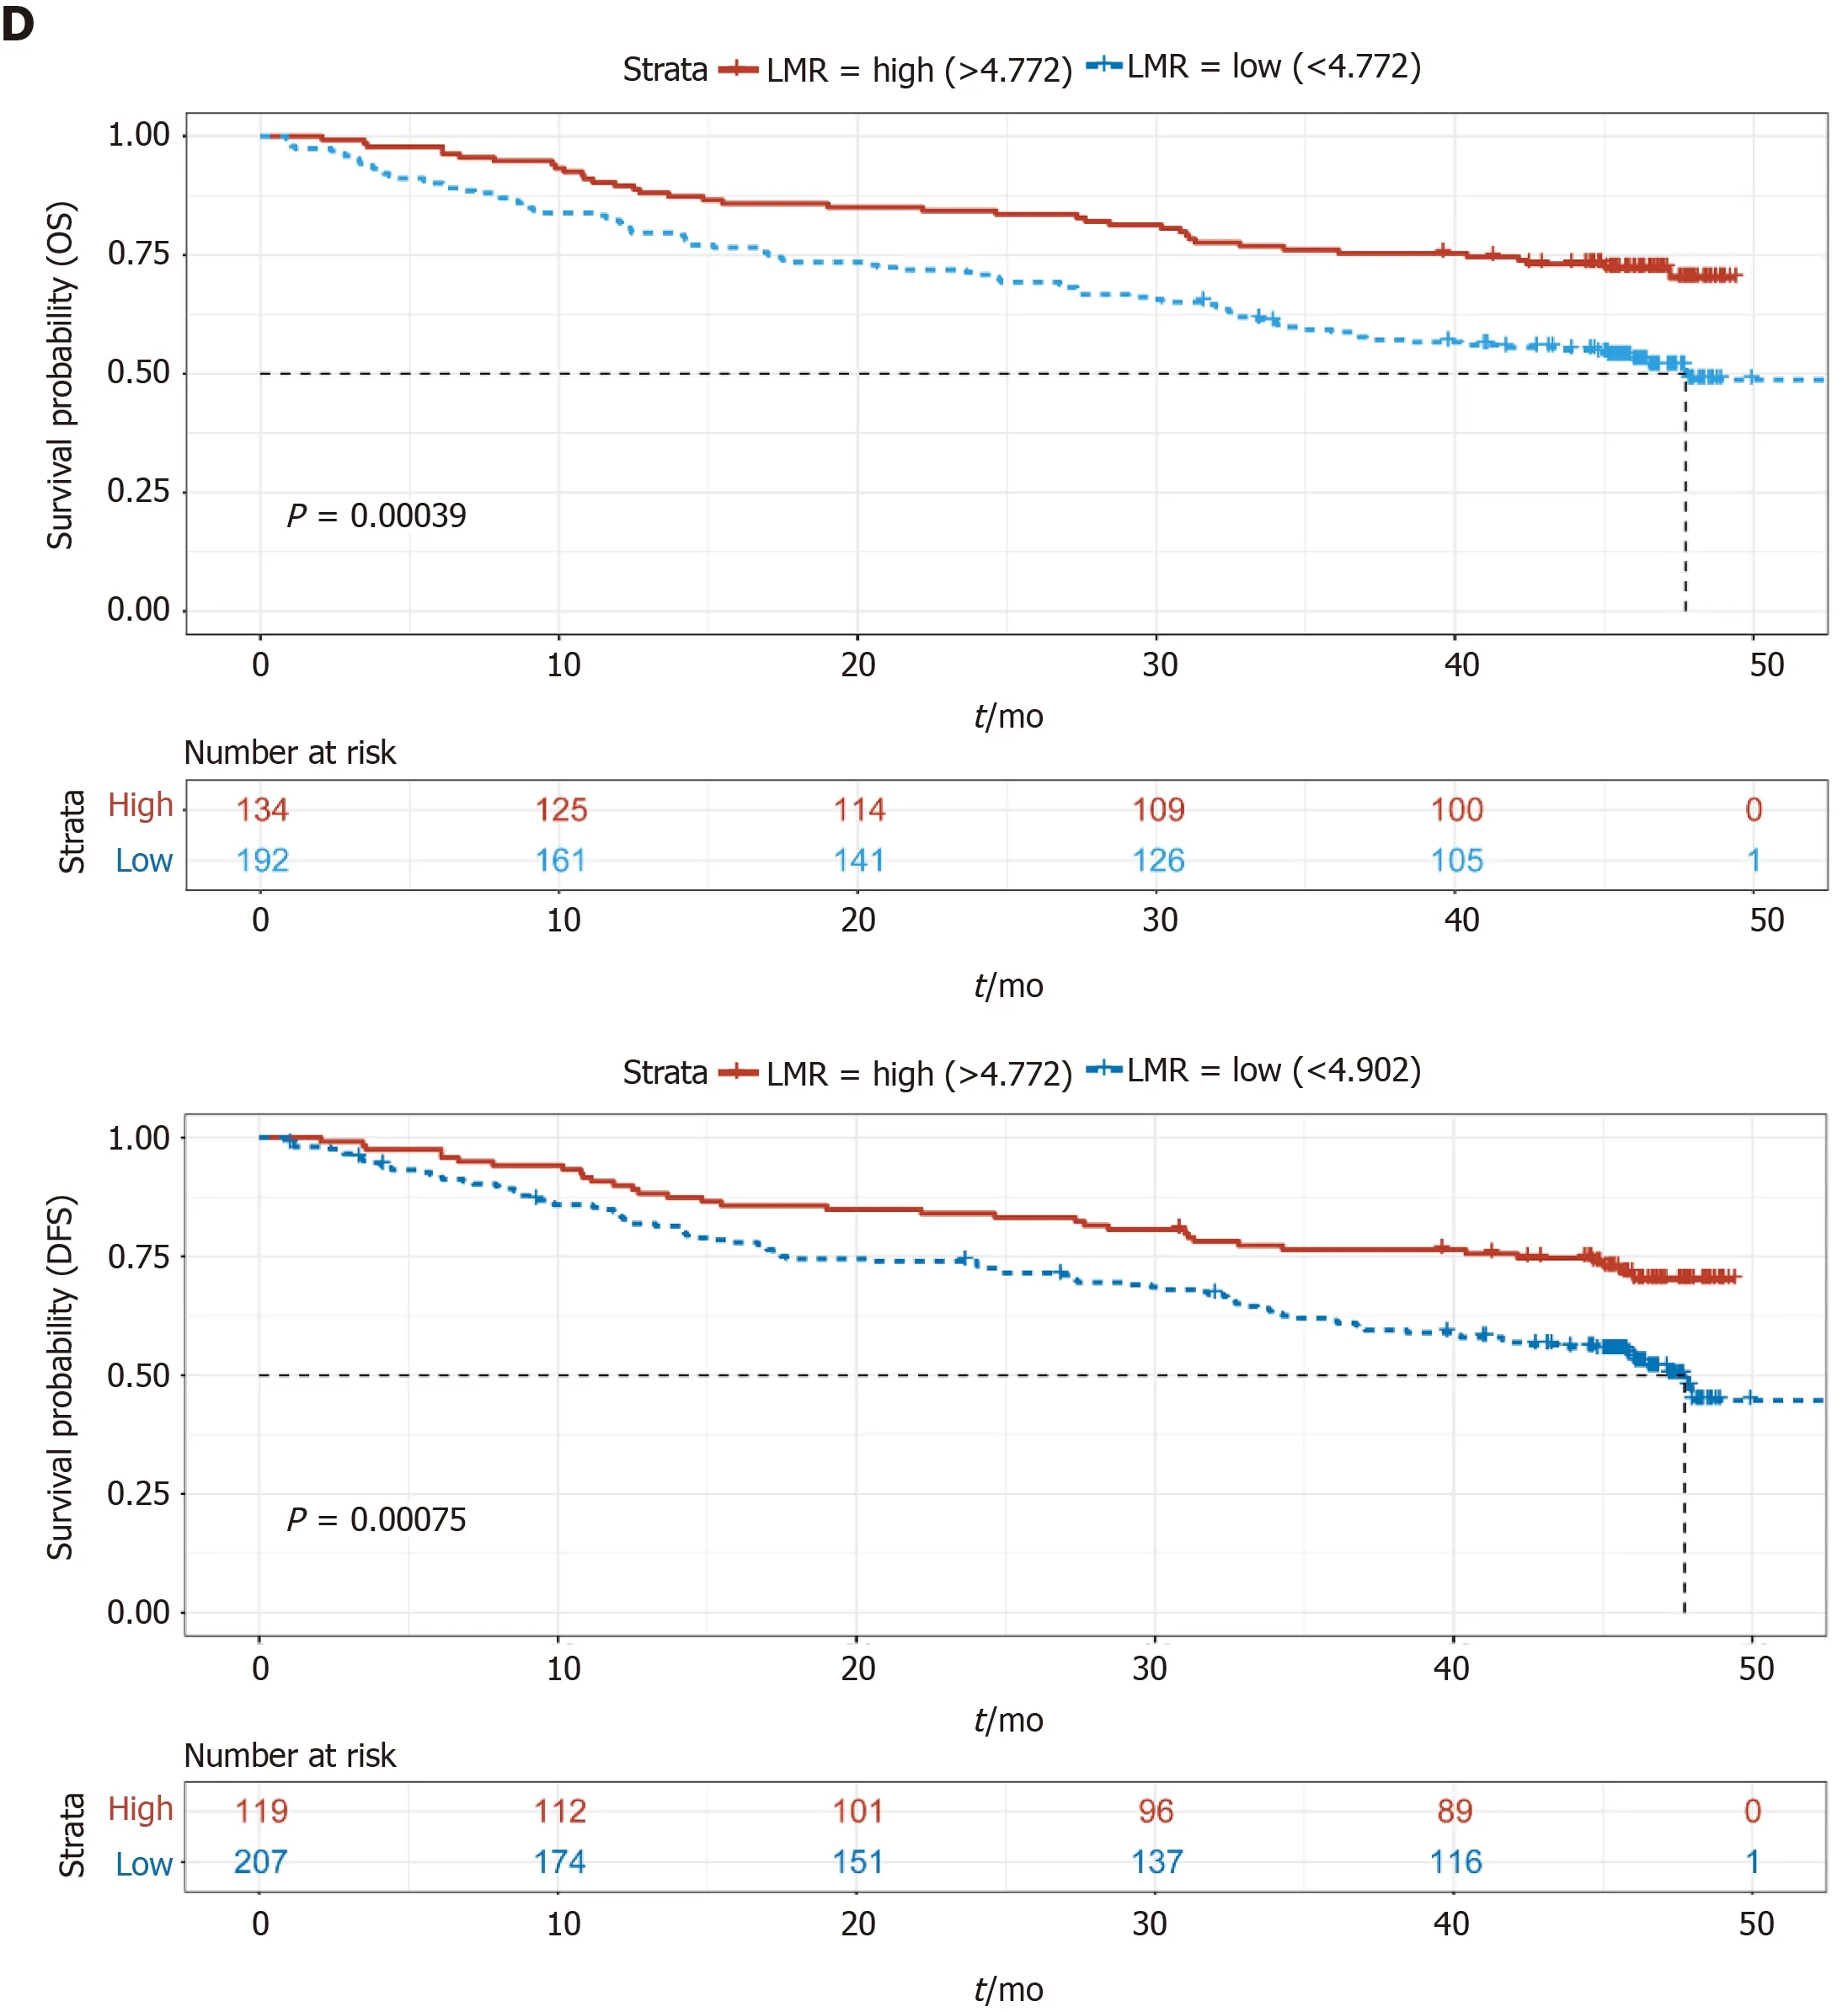
Figure 2 Comparison of overall survival and disease-free survival between the two groups in terms of C-reactive protein to albumin ratio, neutrophil and lymphocyte ratio, platelet to lymphocyte ratio, and lymphocyte to monocyte ratio. A: Comparison of overall survival (OS) and disease-free survival (DFS) between the C-reactive protein to albumin ratio (CAR)-low and CAR-high groups; B: Comparison of OS and DFS between the neutrophil and lymphocyte ratio (NLR)-low and NLR-high groups; C: Comparison of OS and DFS between the platelet to lymphocyte ratio (PLR)-low and PLR-high groups; D: Comparison of OS and DFS between the lymphocyte to monocyte ratio (LMR)-low and LMR-high groups. CAR: C-reactive protein to albumin ratio; NLR: Neutrophil and lymphocyte ratio; PLR: Platelet to lymphocyte ratio; LMR: Lymphocyte to monocyte ratio.
PA is a sensitive nutrient protein index, and its concentration in plasma is helpful for the evaluation of nutritional status and liver function. In addition, PA can also transport thyroxine and vitamin A. It has thymic hormone property, which can enhance the body’s immune response by promoting the maturation of lymphocytes[13,14,30,31]. The metabolism in tumor patients is accelerated, and thus their nutritional status becomes extremely poor, particularly in advanced-stage cancers. In this context, the concentration and function of PA also decreases, negatively affecting the ability of the body to fight against the tumor. Thus, PA is also an important index for the evaluation of prognosis in cancer patients[16]. In view of the abovementioned points, we calculated the APR in order to assess its effect on the prognosis of GC.
In our study, we first proposed the hypothesis that the APR could be an important factor in the evaluation of GC prognosis. After excluding patients with factors that could significantly affect the APR, we collected data on the preoperative serological examination results of 409 patients with GC, and the differences in clinical characteristics and prognostic indicators were compared between the APR-high and APR-low groups. We found that the APR-high group had deeper tumor infiltration and more extensive lymph node metastasis than the APR-low group. There was a larger proportion of patients with distant metastasis in the APR-high group than in the APR-low group. In addition, the average age of the APR-high group was relatively higher than that of the APR-low group, and there was a higher proportion of female patients in the APR-high group than in the APR-low group.
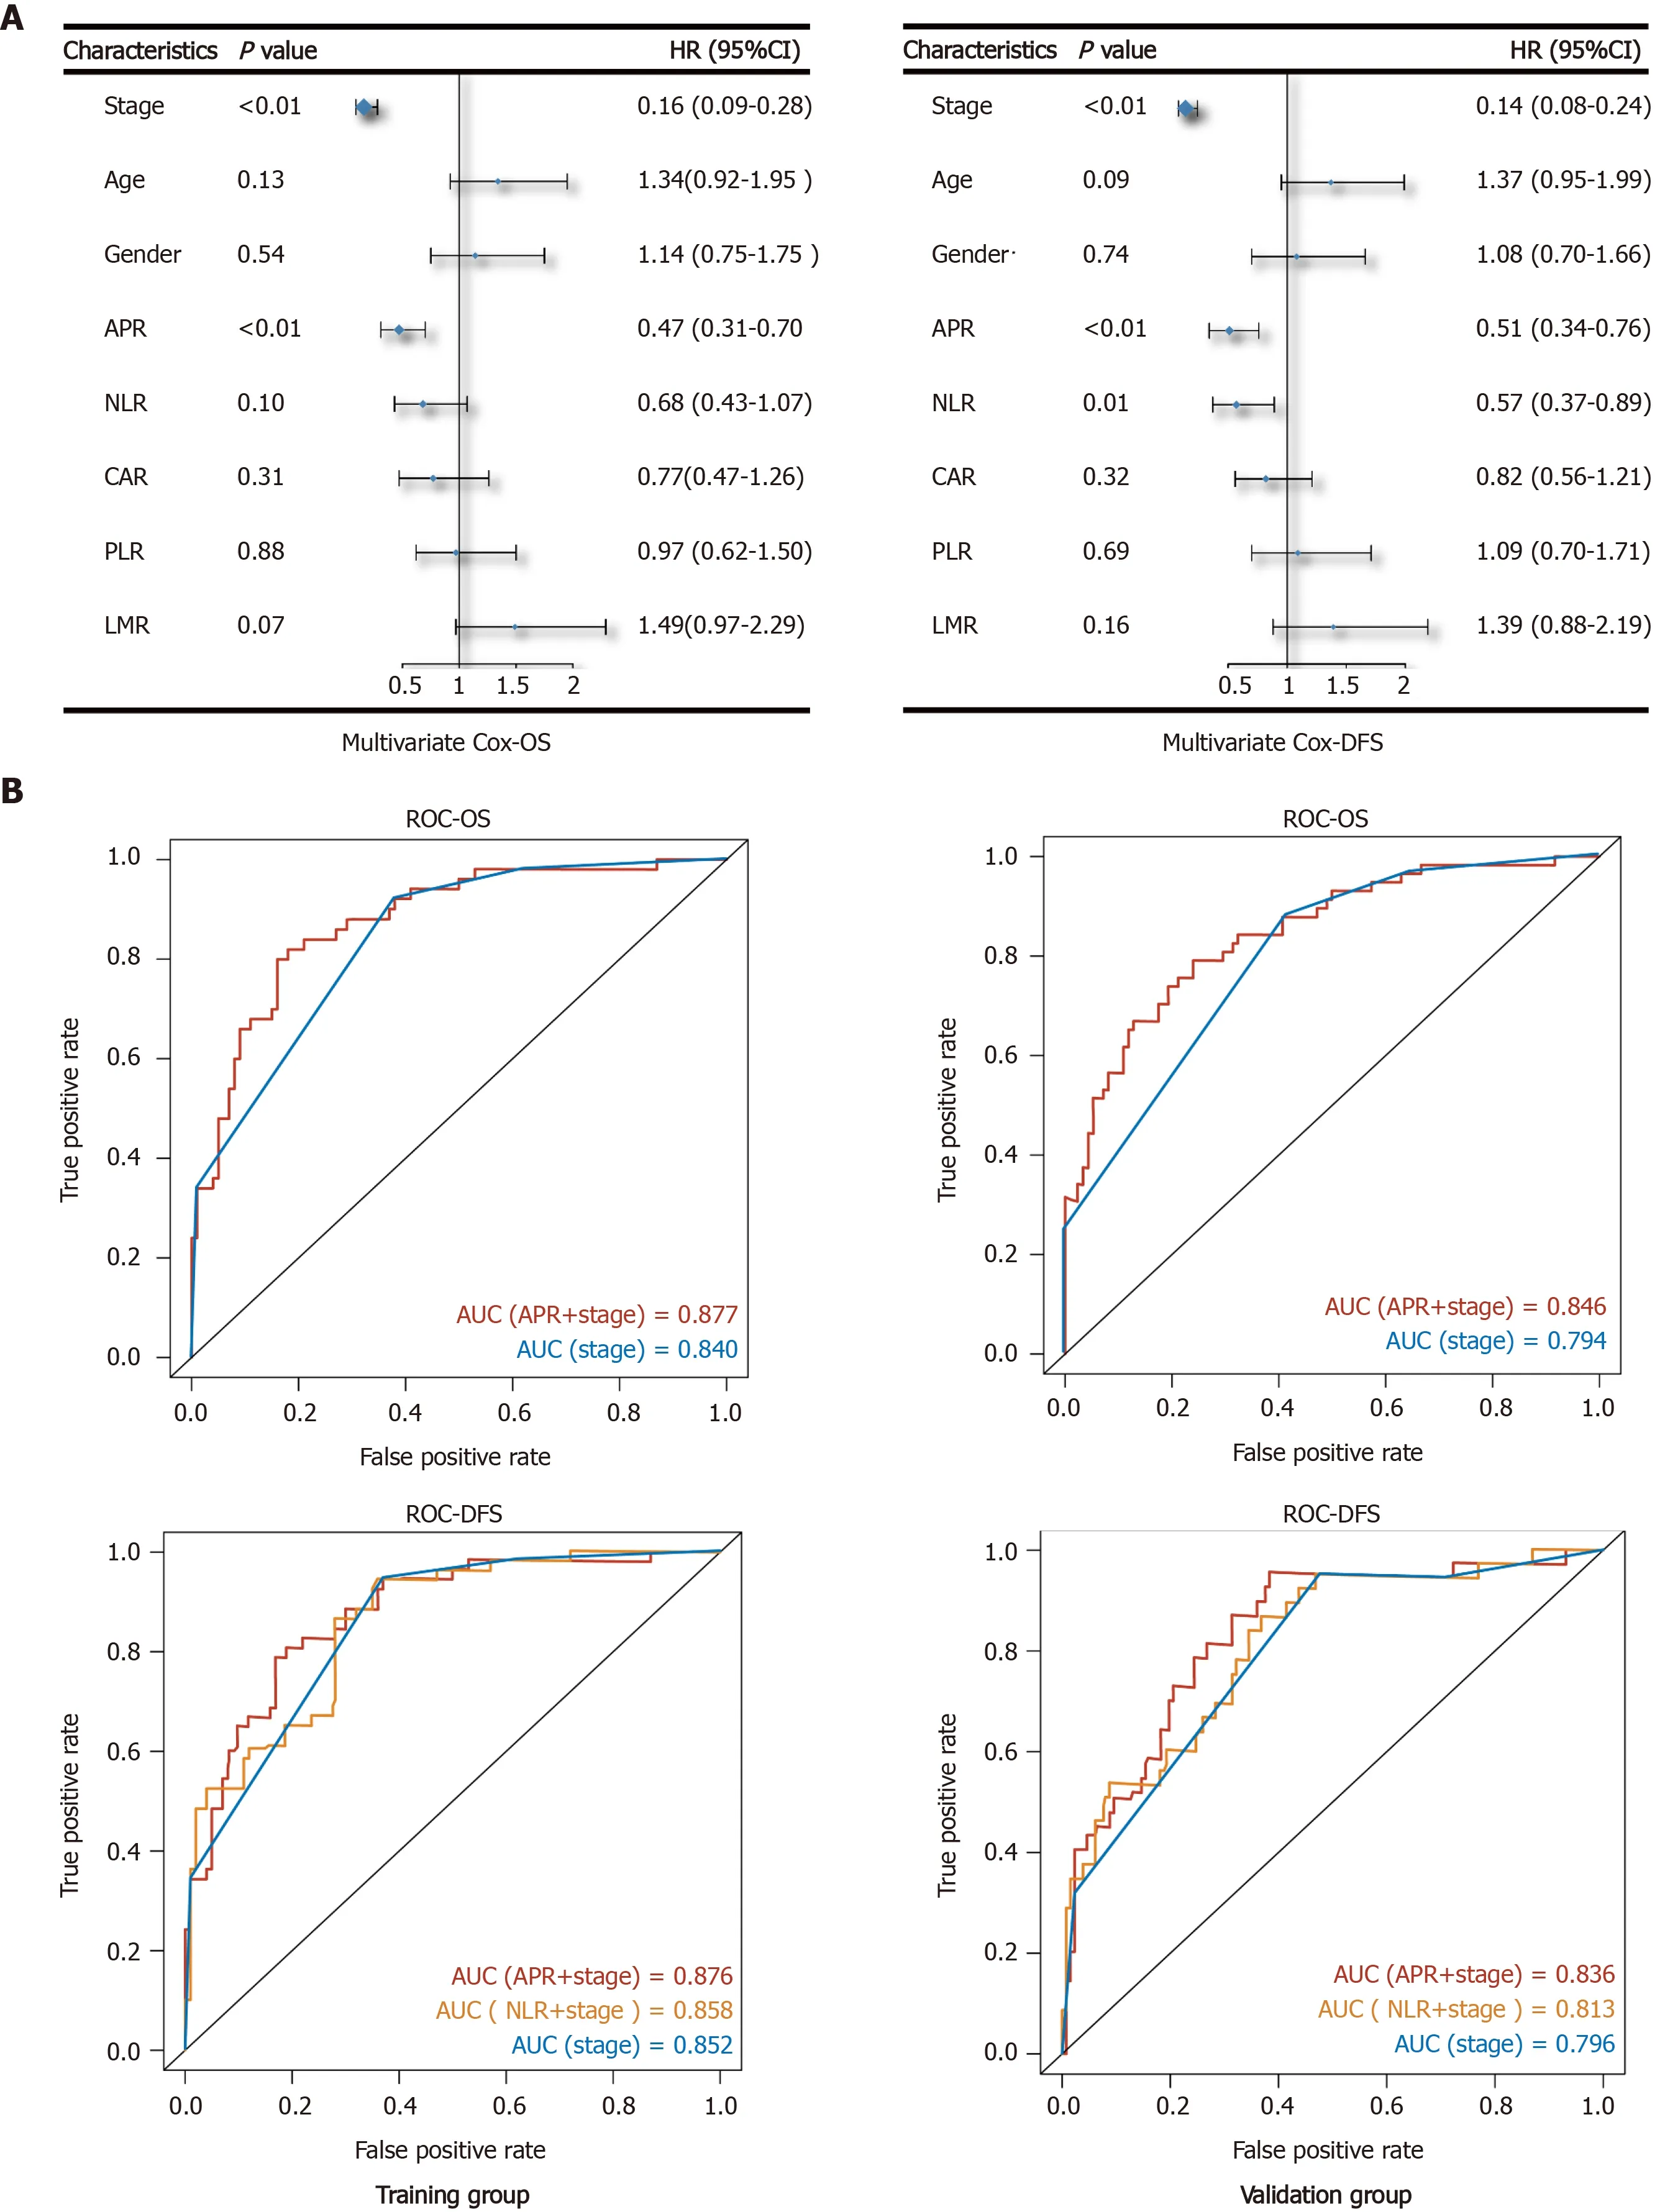
Figure 3 Multivariate Cox analysis and evaluating efficiency of indices. A: Shows the results of multivariate Cox analysis of overall survival and disease-free survival by forest plot; B: Shows the comparison of evaluating efficiency among different Cox models. OS: Overall survival; DFS: Disease-free survival; AUC: Area under the curve; ROC: Receiver operating characteristic.
The NLR, CAR, PLR, and LMR, which were assessed and considered as important factors for evaluating the prognosis of GC, were compared. These indicators mainly reflect the degree of the inflammatory response in the body according to the proportion of inflammatory cells, while CAR reflects both the inflammatory response of the body and nutritional status. Previous studies have shown that GC patients with high NLR, PLR, and CAR and low LMR have a poorer prognosis[20,22,23]. In our study, the APR-high group had a worse prognosis than the APR-low group, and patients in this group also presented with a higher NLR, CAR, PLR, and lower LMR, which was consistent with previous studies. Furthermore, APR showed the same trend in the evaluation of GC prognosis compared with NLR, CAR, and PLR, while, LMR showed the opposite trend.
As observed by multivariate Cox regression, the effect of APR was more obvious than that of NLR, CAR, PLR, and LMR in evaluating the prognosis of GC. The evaluating efficiency of APR and stage model was better than that of stage alone or the NLR plus stage model. APR is easy to obtain by preoperative serum examination, and when combined with accurate clinical stage obtained from pathological diagnosis after surgery, the evaluating efficiency of the patients’ prognosis is more accurate. Surgeons make a preliminary judgment on the clinical prognosis of patients through imaging examination. This, combined with the APR, can help us make a more accurate and efficient judgement during the general assessment of the tumor and patient prognosis before surgery.
Although previous studies have shown that ALP can be used to evaluate the prognosis of GC, the mechanism behind it remains unclear. ALP is mainly used for the diagnosis of liver diseases, and the liver is the most common site of distant metastasis in advanced-stage GC[32,33]. Patients with GC who have a worse clinical stage may have a higher risk of liver damage[34]. However, even in cases where serum ALP is within the normal range, it does not indicate that the liver is healthy and without damage. In fact, it is possible that tumor or inflammatory mediators, or even circulating tumor cells, have damaged the liver. PA, on the other hand, has a high sensitivity in detecting the nutritional status of the body. Thus, the ratio of the ALP and PA indices can, to some extent, reveal the physical status of GC patients. In contrast, the NLR and other inflammatory indicators mainly reflect the inflammatory state of the body and thus, when there is no obvious inflammatory response in the body, the sensitivity of these indicators may be significantly reduced. However, as the ARP is not an absolute inflammatory indicator, it is less affected by the condition. Hence, the sensitivity and predictive efficacy of ARP are higher than that of NLR or other inflammatory indicators.
CONCLUSION
In conclusion, the APR can be used as an independent prognostic factor for GC, and its efficiency is higher than that of NLR and other inflammatory indicators. Furthermore, the combination of the APR and clinical stage can help us improve the accuracy in evaluating the condition of patients. This also allows for the establishment of relevant treatment plans to improve the prognosis of patients. In order to confirm the role of the APR in the diagnosis and prognosis of GC future studies must include a larger sample size.
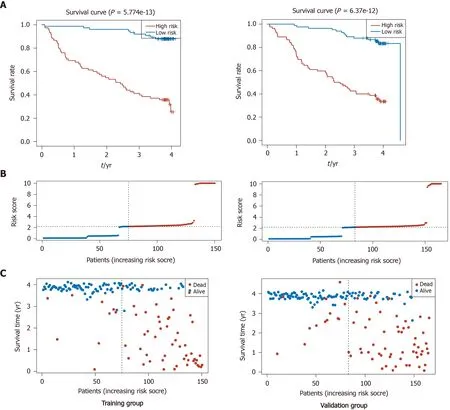
Figure 4 Survival status of the model estimated by stage and alkaline phosphatase to prealbumin ratio. A: Risk score plot of training and validation groups; B: Status plot of training and validation groups; C: Receiver operating characteristic curve of the model in training and validation groups.
ARTICLE HIGHLIGHTS


Research results
Patients with a higher preoperative APR had more advanced clinical stage, a higher neutrophil and lymphocyte ratio (NLR), C-reactive protein, platelet to lymphocyte ratio, glycoprotein antigen 199, and carbohydrate antigen 125 (P< 0.05). In addition, median overall survival and disease-free survival were significantly poorer in the APR-high group than in the APR-low group. The Cox model based on the APR and stage was more effective in evaluating the prognosis of patients than models based on stage alone or stage plus NLR.
Research conclusions
Preoperative APR can be an independent factor for the prognosis of GC, with a higher APR indicating a worse prognosis.
Research perspectives
The APR can be easily acquired and calculated. Thus, by facilitating a more comprehensive judgment of patient prognosis, and combined with other tests, it can help surgeons develop and adjust treatment plans.
ACKNOWLEDGEMENTS
All clinical and follow-up information on each patient was collected by our authors. We especially thank Professor Tao Zhang and Miss Yun Guo for their contribution to our study.
 World Journal of Gastroenterology2020年44期
- World Journal of Gastroenterology的其它文章
- Prognostic value of changes in serum carcinoembryonic antigen levels for preoperative chemoradiotherapy response in locally advanced rectal cancer
- Development and validation of a three-long noncoding RNA signature for predicting prognosis of patients with gastric cancer
- Active tuberculosis in inflammatory bowel disease patients under treatment from an endemic area in Latin America
- Prevalence and predictors of nonalcoholic fatty liver disease in South Asian women with polycystic ovary syndrome
- Associations between serum uric acid and hepatobiliary-pancreatic cancer: A cohort study
- COVID-19 in a liver transplant recipient: Could iatrogenic immunosuppression have prevented severe pneumonia? A case report