
Plasma activation towards oxidized nanocarbons for efficient electrochemical synthesis of hydrogen peroxide
2021-02-27 09:17WeiCAI蔡伟YanWANG王燕ChangshanXIAO肖长山HaobinWU吴浩斌andXinyaoYU遇鑫遥
Plasma Science and Technology 2021年2期
Wei CAI (蔡伟), Yan WANG (王燕), Changshan XIAO (肖长山),Haobin WU (吴浩斌)and Xinyao YU (遇鑫遥)
1 School of Materials Science & Engineering, Zhejiang University, Hangzhou 310027, People’s Republic of China
2 Institutes of Physical Science and Information Technology, Anhui University, Hefei 230601, People’s Republic of China
3 Wendian College, Anhui University, Hefei 230601, People’s Republic of China
Abstract Oxidized nanocarbons (ONCs) have been regarded as efficient electrocatalysts for H2O2 production.However,wet chemical procedures involving large volumes of strong acid and long synthetic time are usually needed to obtain these ONCs.Herein, a plasma activation strategy is developed as a rapid and environmentally benign approach to obtain various ONCs, including oxidized multiwalled carbon nanotubes, single-walled carbon nanotube, graphene, and super P carbon black.After a few minutes of plasma activation,oxygen-containing functional groups and defects can be effectively introduced onto the surface of nanocarbons.Enhanced electrocatalytic activity and selectivity are demonstrated by the plasma-ONCs for H2O2 production.Taking oxidized multiwalled carbon nanotubes as an example,high selectivity(up to 95%)and activity(0.75 V at 1 mA cm−2) can be achieved in alkaline solution.Moreover, ex situ x-ray photoelectron spectroscopy and in situ Raman measurements reveal that C–O, C=O, edge defect, and sp2 basal planar defect are probably the active sites.
Keywords:plasma activation,hydrogen peroxide,nanocarbon,defect,oxygen functional groups
1.Introduction
Hydrogen peroxide (H2O2) is an important chemical reagent with high application value.It has been widely used in industry, medicine, environment and military industry, for example, as a disinfectant, bleaching agent and combustion supporting agent [1–3].Until now, there have been generally two methods to produce H2O2in industry.One is the traditional anthraquinone process with high energy consumption and serious pollution [1].The other is the direct synthesis from hydrogen and oxygen, which has potential safety hazards [4–7].At the same time, the instability of H2O2makes storage and transportation problem to be solved [8].Recently,the convenient and green 2e–-based electrocatalytic oxygen reduction reaction (ORR) method forin situgeneration of H2O2is attracting more and more attention [9–11].
Generally speaking, in alkaline electrolyte, ORR can be carried out through two reaction paths [12–14]:
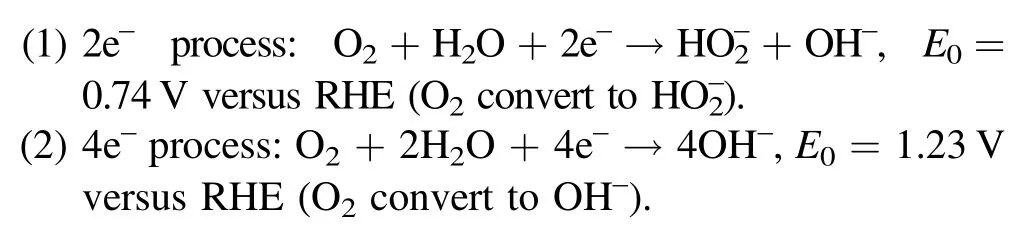
Due to the competition of two reactions in ORR processes and the limitation of the kinetics, the key is to explore an electrocatalyst with high activity and selectivity for 2e–ORR[15–17].To this end,noble metals and their alloys(such as Pd-Au [18], Pt-Hg [19], Pd-Hg [20] etc) with low onset potential and high selectivity (more than 90%) have been developed [21–23].However, their large-scale application is seriously hindered because of the expensive price and lack of resources.Most recently, carbon materials with abundant reserves and large structural adjustability have been investigated as promising noble metal substitute catalysts for the electrocatalytic synthesis of H2O2[24–29].
Among the reported carbon materials, oxidized nanocarbons (ONCs) are very efficient electrocatalysts for H2O2production.The surface oxygen-containing groups and defects of ONCs play important roles in selective synthesis of H2O2with high activity.For example,Luet al[9]used strong acid to oxidize nanocarbons to realize the regulation of the surface oxidation state, significantly improving the activity and selectivity (∼90%) for generating H2O2.However, oxidation of nanocarbons with strong acid is a wet chemical process, requiring a large number of chemical reagents and a relatively long processing time(in hour scale).Kimet al[13]employed thermally reduced graphene oxide as an electrocatalyst to synthesize H2O2with high selectivity and stability at low overpotential in alkaline condition.Nevertheless, the preparation of graphene oxide is cumbersome and requires a large number of purification steps to remove the impurities of metal ions introduced in the synthesis process.As such, it is meaningful but urgent to develop an efficient and environmentally friendly approach to obtain ONCs with enhanced activity and selectivity for electrocatalytic synthesis of H2O2.
Plasma activation technology is a low-temperature,timeefficient, and dry method to realize surface modification of carbon materials.Plasma contains a large number of ions,excited molecules, metastable particles, photons and other active particles.The energy of most of these particles is higher than that of C=C and C–C, which means that these particles can destroy the original chemical bonds on the surface of carbon materials and form new bonds [30, 31], thus endowing the surface of materials with new characteristics.In Ar/O2plasma, a large amount of Ar+ions and oxygencontaining excited species exist.The Ar+ions will etch the surface of carbon materials to generate defects and surfacebound radicals [32].On the other hand, the oxygen-containing species in Ar/O2plasma can interact with the dangling bonds to form corresponding functional groups [33].
Herein, we develop an O2/Ar plasma activation strategy instead of the traditional chemical activation technology, and it was experimentally proved that this strategy is applicable for commercial carbon nanomaterials with various morphologies (multiwalled carbon nanotubes (MWCNTs), singlewalled carbon nanotube (SWCNT), graphene (G), and super P carbon black(SP)).O2/Ar plasma can effectively introduce oxygen-containing functional groups (C–O and C=O) and defects onto the surface of nanocarbons in 5 min without using any chemicals.In addition, the amount of oxygencontaining groups and defects can be easily controlled by the plasma parameters.Compared with raw commercial nanocarbons, the potential at 1 mA cm−2is positively shifted and the selectivity for H2O2is greatly improved in a wide voltage window.Most importantly, possible active sites (oxygen functional groups and defects) during the electrocatalytic synthesis of H2O2are identified byex situx-ray photoelectron spectroscopy andin situRaman measurements.

Figure 1.Schematic diagram of plasma activation of nanocarbons.
2.Experimental
2.1.Materials
MWCNTs (purity >95%, length: 0.5–2 μm, diameter:8–15 nm), SWCNT (purity >95%, diameter: 1–2 nm, length:1–3 μm), and G powder synthesized with a physical method(sheet diameter: 0.5–5 μm, thickness: around 0.8 nm, single layer rate: 80%) were provided by Nanjing XFNANO Materials Tech Co., Ltd.SP was purchased from Shenzhen Ruiheda Technology Co., Ltd.Nafion solution (5 wt%) was provided by Sigma-Aldrich.Potassium hydroxide (KOH),perchloric acid (HClO4), H2O2(30%), sodium dihydrogen phosphate, and disodium hydrogen phosphate were provided by Sinopharm Chemical Reagent Co., Ltd.Potassium titanium oxalate and phenol were purchased from Macklin Inc.Hydrophobic carbon paper was provided by Shanghai Hesen Electric Co., Ltd.
2.2.Preparation of ONCs
The specific preparation process of ONCs is shown in figure 1; 30 mg of nanocarbons were evenly spread onto a quartz glass dish and put into the plasma enhanced chemical vapor deposition (PECVD) equipment with a RF plasma source (13.56 MHz, 0–500 W) for plasma oxidation.The plasma oxidation process was carried out at room temperature.Up to about 0.5 g of nanocarbons can be processed per hour.The ratio of O2to Ar was 9:1, 3:7, and 5:5.The gas pressure was 40 Pa, 50 Pa, and 60 Pa.The RF plasma power was 150 W, 250 W, and 350 W, and the activation time(3 min,5 min,and 10 min)was varied.MWCNTs were stirred with nitric acid (12 M) at 80 °C for 48 h to realize traditional chemical oxidation and the obtained sample is denoted as O-MWCNTs.
2.3.Physio-chemical characterizations
Transmission electron microscopy(TEM)and high-resolution TEM (HRTEM) images were measured by FEI Tecnai G2 F20.HRTEM images with spherical aberration correction were taken by FEI Titan G2 60–300.X-ray diffraction(XRD)patterns in the 2θ range from 5° to 80° were obtained by PANAlytical X’Pert PRO instrument.The x-ray photoelectron spectroscopy (XPS) was measured by Thermo Fischer ESCALAB 250 Xi.Fourier transform infrared (FT-IR)spectra were obtained from the Nicolet 5700 spectrometer.A LabRam HRUV ultraviolet laser Raman spectrometer was used to obtain Raman spectra.A confocal microscopy(Confotec™MR 520)using 532 nm laser was used to collectin situRaman spectra.The concentration of H2O2was determined by MAPADA-P4CP UV spectrophotometer.Before the above-mentioned characterizations, the obtained samples were kept in sealed conditions, except for the unavoidable contact with air.
2.4.Electrode preparation and electrochemical characterizations
First, 5 mg of carbon material was dispersed in 950 μl of alcohol and 50 μl of Nafion,and the slurry(0.5 mg ml−1)was obtained by ultrasound for about 30 min.Then, 10 μl of the catalyst ink was dropped onto the surface of a glassy carbon electrode with an area of 0.2475 cm2as the working electrode.A CHI 760E electrochemical workstation was used to perform the electrochemical measurements.A saturated calomel electrode and a carbon rod were employed as reference electrode and counter electrode, respectively.Three electrolytes (0.1 M KOH with pH ∼ 13, 0.1 M phosphate buffered saline (PBS) with pH ∼ 7 and 0.1 M HClO4with pH ∼ 1) were used for testing.A rotating ring disk electrode(RRDE)was employed to evaluate the activity and selectivity for ORR in oxygen saturated electrolyte [19, 34, 35].
To investigate the ORR activity, linear sweep voltammogram (LSV) curves were recorded in the range of 0.4–1.1 V versus reversible hydrogen electrode (RHE).The scan rate in the LSV test was 5 mV s−1.The electrochemically active surface area (ECSA) was assessed by the electrochemical double-layer capacitance (Cdl) of the electrocatalysts.A series of cyclic voltammetry(CV)curves were measured at various scan rates(5,10,15,20 and 25 mV s−1).At 0.115 V versus RHE, theCdlcan be obtained from the function between disk current density (j) and scan rates.
According to equation (1) and the relationship between the ring current and the disk current of the rotating ring disk electrode, the 2e−ORR selectivity of the catalysts was obtained easily.During the testing process, the speed of rotation was controlled at 1600 rpm and the potential on the ring of the working electrode was set at 1.2 V versus RHE.
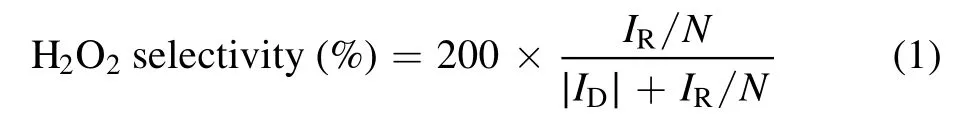
whereIRis the ring current,IDrepresents the disk current,andNstands for the collection efficiency.In our workN= 0.37.
2.5.Measurement of H2O2 concentration
The Teflon-treated carbon fiber paper (CP) was cut into a proper size, and the catalyst slurry (Valcohol:Vdeionizedwater:VNafion= 470: 470: 60) was painted uniformly onto CP(1×1 cm2) with controlled loading of about 0.5 mg cm−2.Then, the CP loaded with catalyst was used as the working electrode and the accumulation of electrochemically synthetized H2O2was performed in an H-cell in 0.1 M KOH solution, using Nafion®117 membrane as a separator.In the two compartments, the volume of electrolyte was controlled at 25 ml and O2was continuously supplied at a flow rate of 200 ml min−1to ensure that the electrolyte reaches oxygen saturation state.
The H2O2concentration was measured by a titanium salt spectrophotometry method [36].The color depth of the complex is directly proportional to the content of H2O2in the sample.The specific operation process is as follows: an appropriate amount of electrolyte in the compartment of ORR was added to the 0.05 M potassium-titanium oxalate K2TiO(C2O4)2solution.After that,the pH value was adjusted by adding deionized water and sulfuric acid and the sample was placed stably for 10 min.The absorption coefficient at 400 nm wavelength was observed by spectrophotometer and the concentration of H2O2was determined by comparing with the standard curve.
Based on the equation(2),the current efficiency of H2O2generated can be calculated:

wherenis the number of electrons in reducing O2to H2O2(n= 2),Fis the Faraday constant,Cis the concentration of H2O2,Vrepresents the volume of electrolyte,andQstands for the amount of passed charge.
2.6.Degradation of phenol
The degradation device is similar to the H2O2generation device and only the electrolyte was changed into an acid solution with pH = 3 regulated by sulfuric acid.Phenol was added into the electrolyte as an organic pollutant with a concentration of 50 mg l−1.The concentration of phenol was analyzed by high-performance liquid chromatography(HPLC, DGU20A3R, Shimadzu, Japan).
3.Results and discussion
3.1.Characterization of the MWCNTs and PO-MWCNTs
We first employ MWCNTs as a typical nanocarbon to demonstrate the role of plasma activation in promoting the selectivity and activity for H2O2production.The optimized plasma-oxidized MWCNTs (denoted as PO-MWCNTs) are obtained at the plasma power of 250 W,gas pressure of 40 Pa,O2/Ar ratio of 9/1, and activation time of 5 min.TEM images (figures 2(a) and (b)) and XRD patterns (figure 2(f))show that no obvious changes in structure and phase after plasma oxidation can be found, confirming that plasma activation is a mild process without destroying the original structure of carbon nanotubes.However, HRTEM images demonstrate that a coarse and irregular defect layer with a thickness of about 2 to 3 nm is generated on the surface of PO-MWCNTs (figures 2(c) and (d)) due to the etching effect of plasma.The introduction of defects can also be verified by the Raman spectrum with slightly increased intensity ratio of D band to G bandfrom 1.09 to 1.16 after plasma oxidation (figure 2(e)), and the amount of defects can be tuned by the plasma processing time (figure S1 available online at stacks.iop.org/PST/23/025502/mmedia).
From the above analysis,it can be concluded that plasma oxidation mainly occurs on the surface of the MWCNTs.To further explore the effect of plasma activation on elements and chemical states of the MWCNTs and PO-MWCNTs,XPS measurement is performed.As shown in figure 3(a), the intensity of O 1s peak is significantly enhanced in POMWCNTs and the oxygen content is increased from 1.6% to 8.4%.The C 1s spectrum can be fitted by C–C in graphite at 284.5 eV, defects (carbon atoms lose their regular arrangement) at 285.4 eV, C–O at 286.1 eV, O–C=O at 288.7 eV(such as –COOH), and π-π*transition at 290.5 eV corresponding to the shakeup line of carbon in aromatic compounds.Meanwhile, the O 1s spectrum can be fitted by O–C at 533.2 eV and O=C at 531.6 eV.The introduction of C–O and C=O can also be confirmed by FT-IR(figure S2).Comparing the C 1s and O 1s spectra of MWCNTs and PO-MWCNTs(figures 3(b)–(f)), it can be seen that after plasma oxidation the defect proportion and the ratio of C–O to C=O increase obviously.The ratio of C–O/C=O and the content of surface defects achieve the maximum at the oxidation time of 5 min(figure S3,tables S1 and S2).The above results evidence that the Ar/O2plasma can effectively introduce controllable defects and oxygen-containing functional groups onto nanocarbons.
3.2.Electrochemical performance of MWCNTs and POMWCNTs
RRDE is employed to evaluate the effect of plasma activation on the electrochemical properties of the electrocatalysts.As mentioned above, ORR can follow the 4-electron or 2-electron pathways, of which the 2-electron pathway is the focus of this work, because H2O2is the target product.The oxygen reduction currents are measured on the disk electrode(solid lines), while the H2O2oxidation currents are measured on the platinum ring electrode(dashed lines).The potential on the platinum ring (1.2 V versus RHE) ensures that only the oxidation of H2O2can be allowed rather than ORR.
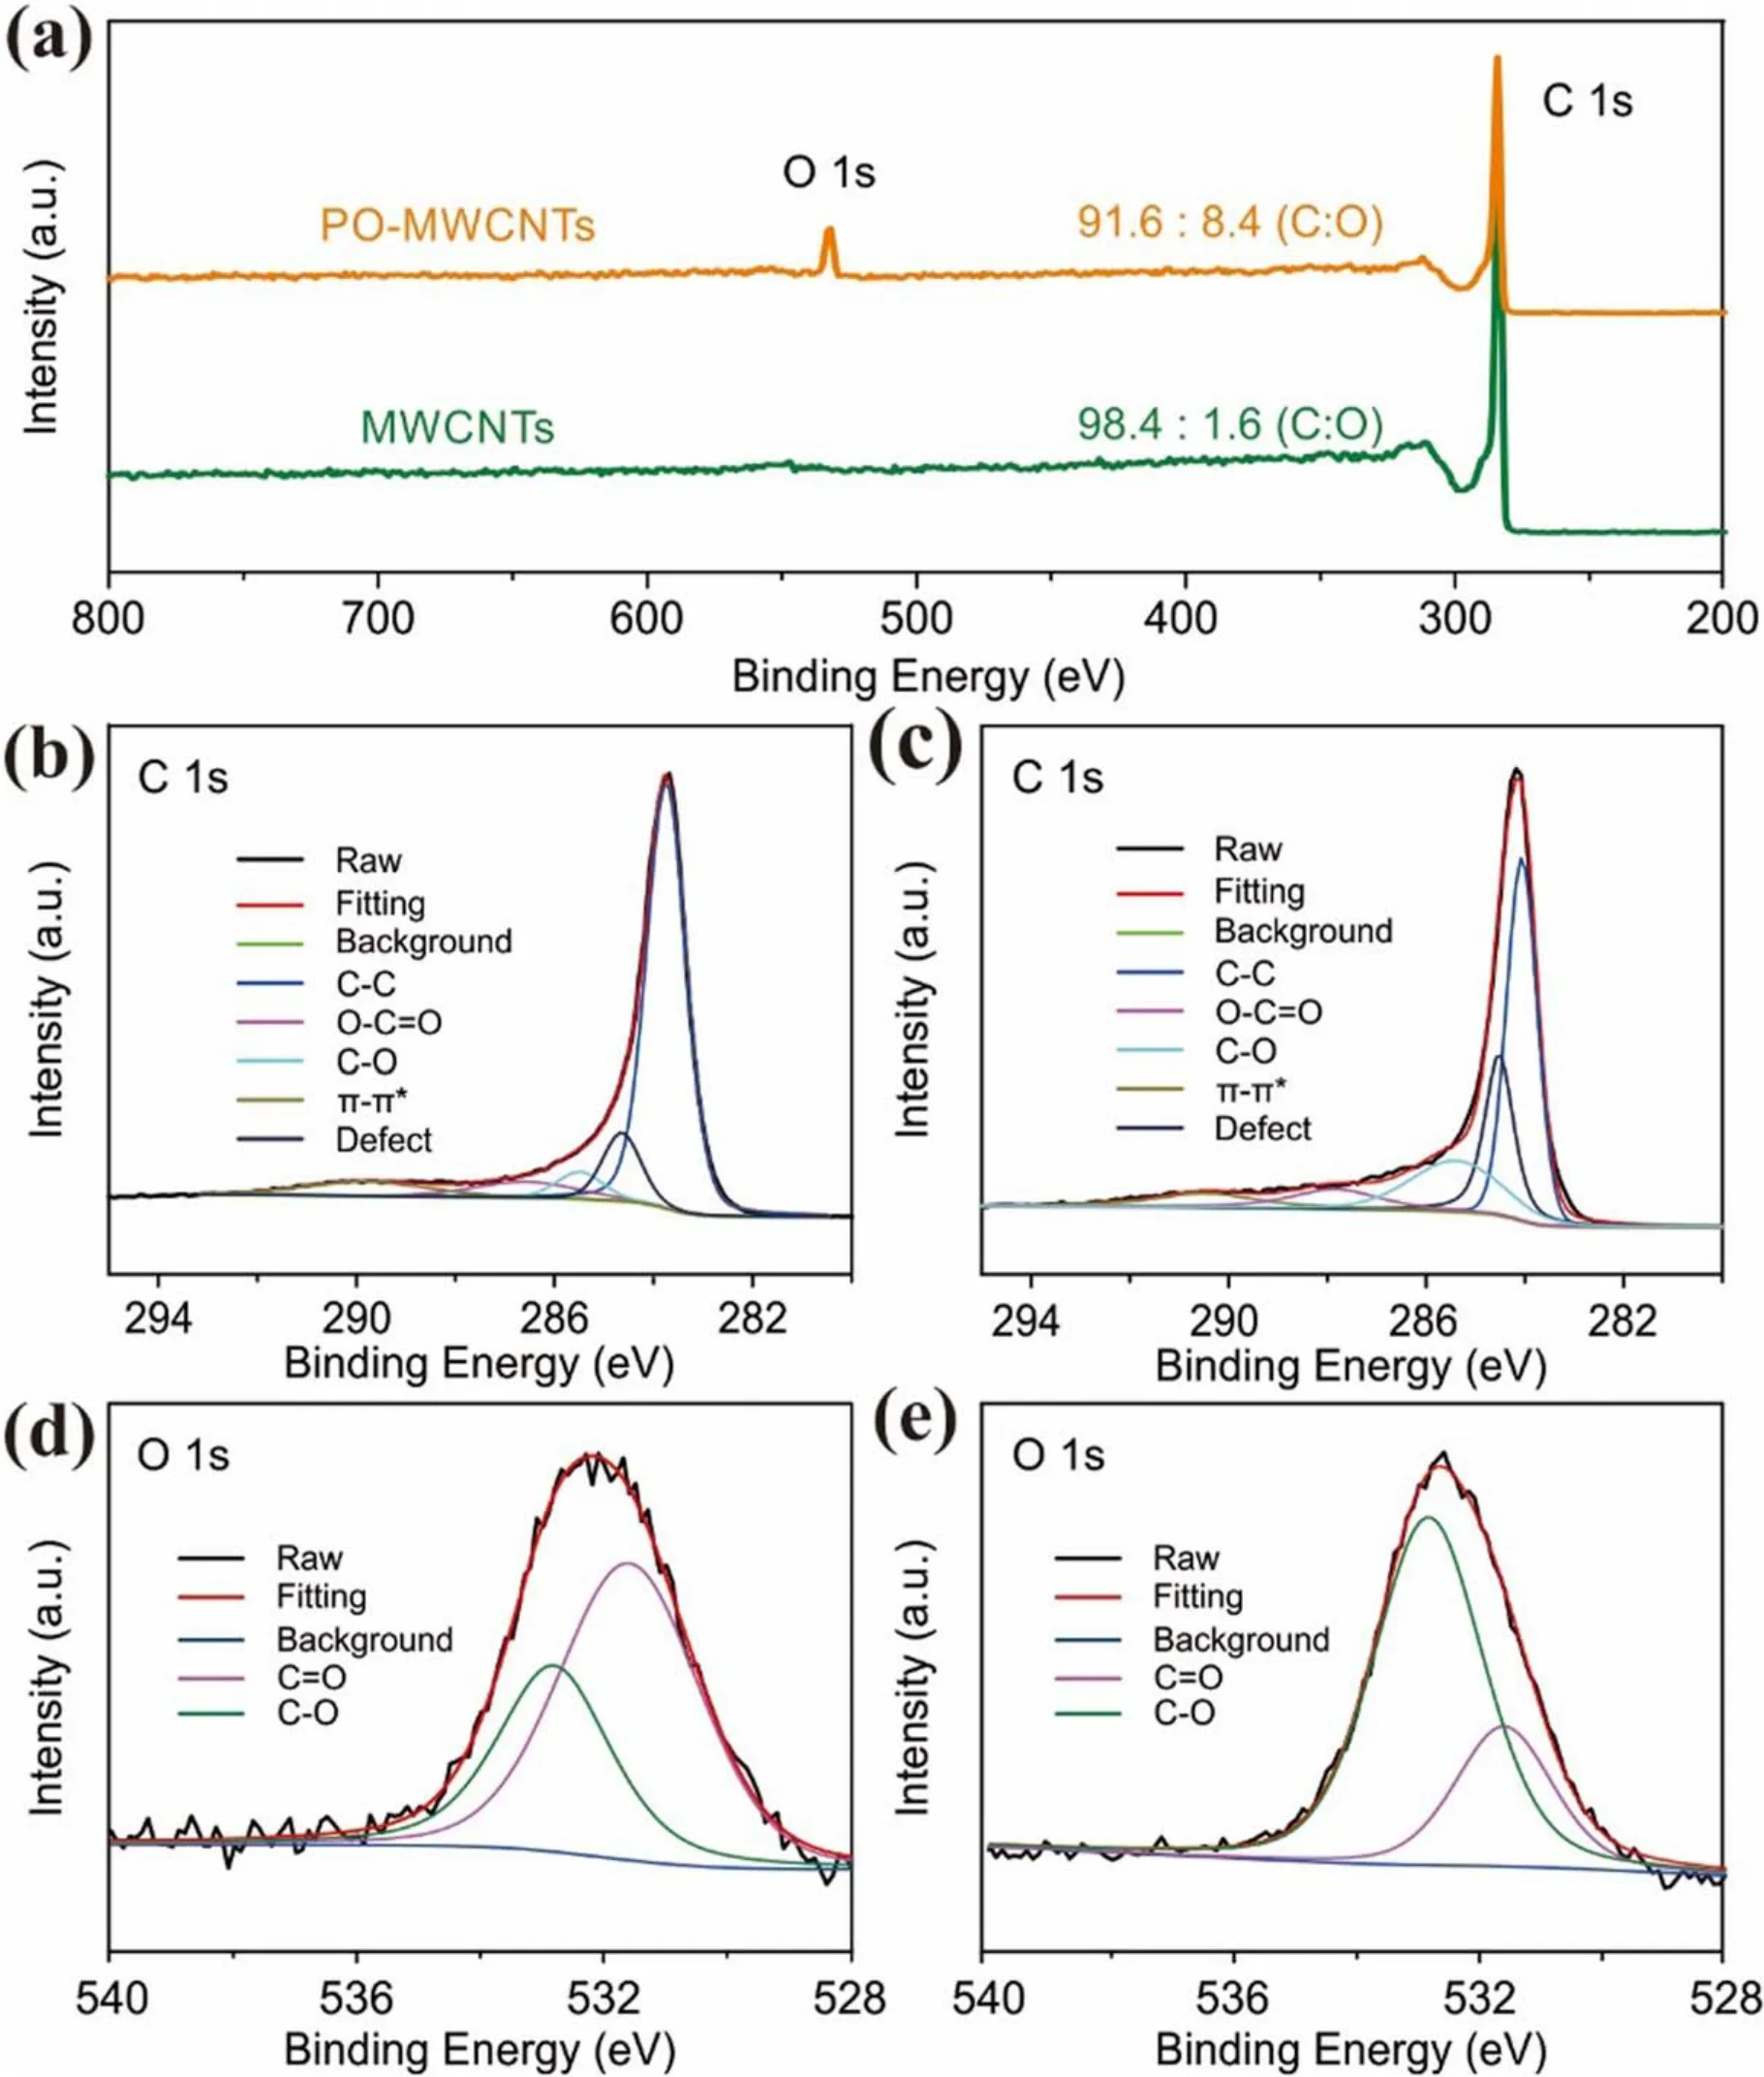
Figure 3.(a) XPS survey spectra of MWCNTs and PO-MWCNTs.High-resolution C 1s XPS spectra of (b) MWCNTs and (c) POMWCNTs.High-resolution O 1s XPS spectra of (d) MWCNTs and (e) PO-MWCNTs.
The LSV curves demonstrate that the activity of MWCNTs is significantly improved after plasma oxidation(figure 4(a)).The potential corresponding to the current density of 1 mA cm−2is increased from 0.71 to 0.75 V versus RHE and the limiting current is raised obviously.As can be seen from figure 4(b),the selectivity is greatly enhanced after plasma oxidation.In the voltage interval of 0.5–0.75 V versus RHE, the selectivity is nearly doubled.Remarkably, at 0.7 V versus RHE,a high selectivity up to 95% is obtained by POMWCNTs.In addition,the Tafel slope is decreased from 59.8 to 38.2 mV dec−1, demonstrating the faster ORR kinetics(figure 4(c)).Cdlmeasurement demonstrates that the ECSA of PO-MWCNTs (3.07 mF cm−2) is about ten times that of MWCNTs(0.303 mF cm−2)(figures 4(d)and S4(a)and(b)),revealing that more active sites are exposed by POMWCNTs.The above results demonstrate that plasma activation can enhance both the activity and selectivity of MWCNTs for H2O2synthesis.For comparison,the traditional chemical oxidation method is also employed to oxidize MWCNTs (denoted as O-MWCNTs).As can be seen, the activity and selectivity of O-MWCNTs are inferior to those of PO-MWCNTs,further demonstrating that the plasma method is more effective (figures S5(a) and (b)).Apart from high activity and selectivity, long-term stability over 10 h is also displayed by PO-MWCNTs with no significant changes in the ring and disk current (figure 4(e)).In addition to excellent activity and selectivity in alkaline electrolyte, the POMWCNTs also exhibit high activity and selectivity under acidic (0.1 M HClO4) and neutral (0.1 M PBS) conditions(figures 5(a) and (b)).The selectivities of PO-MWCNTs under these two conditions are higher than 80%(figure 5(c)).
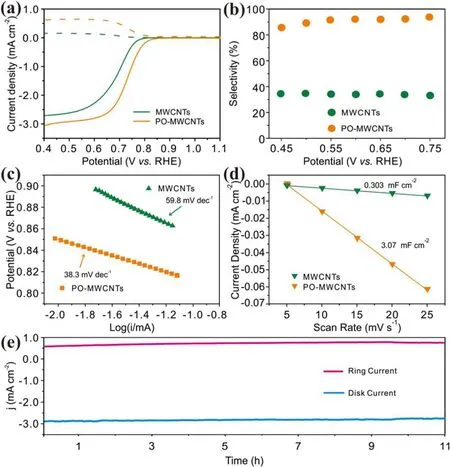
Figure 4.(a)Polarization curves and (b)H2O2 selectivity of MWCNTs and PO-MWCNTs in 0.1 M KOH.(c)Tafel and(d) ECSA plots of MWCNTs and PO-MWCNTs in 0.1 M KOH.(e) Stability of PO-MWCNTs in 0.1 M KOH.
To obtain the optimal plasma parameters, the oxidation time,plasma power,pressure,Ar/O2ratio,and electrocatalyst loading is optimized to 5 min, 250 W, 40 Pa, 1/9, and 0.2 mg cm−2, respectively (figures S5–S7(a), (b)).With the increase of plasma time(figure S5(c)–(h)),the oxygen content(table S1) increases and the H2O2production performance of MWCNTs is greatly improved, indicating that oxygen functional groups play an important role in improving the selectivity and activity of nanocarbons.Previous theoretical calculations have revealed that all the oxygen-containing functional groups may act as the active sites for H2O2production and–COOH and C–O–C groups may be more active[9].In our work, the selectivity of the plasma-oxidized MWCNTs is positively correlated to the ratio of C–O/C=O and surface defects, as confirmed by XPS analysis (tables S1 and S2).Therefore, the C–O site may be more active than C=O for 2e−ORR.
3.3.In-situ Raman spectroelectrochemical analysis
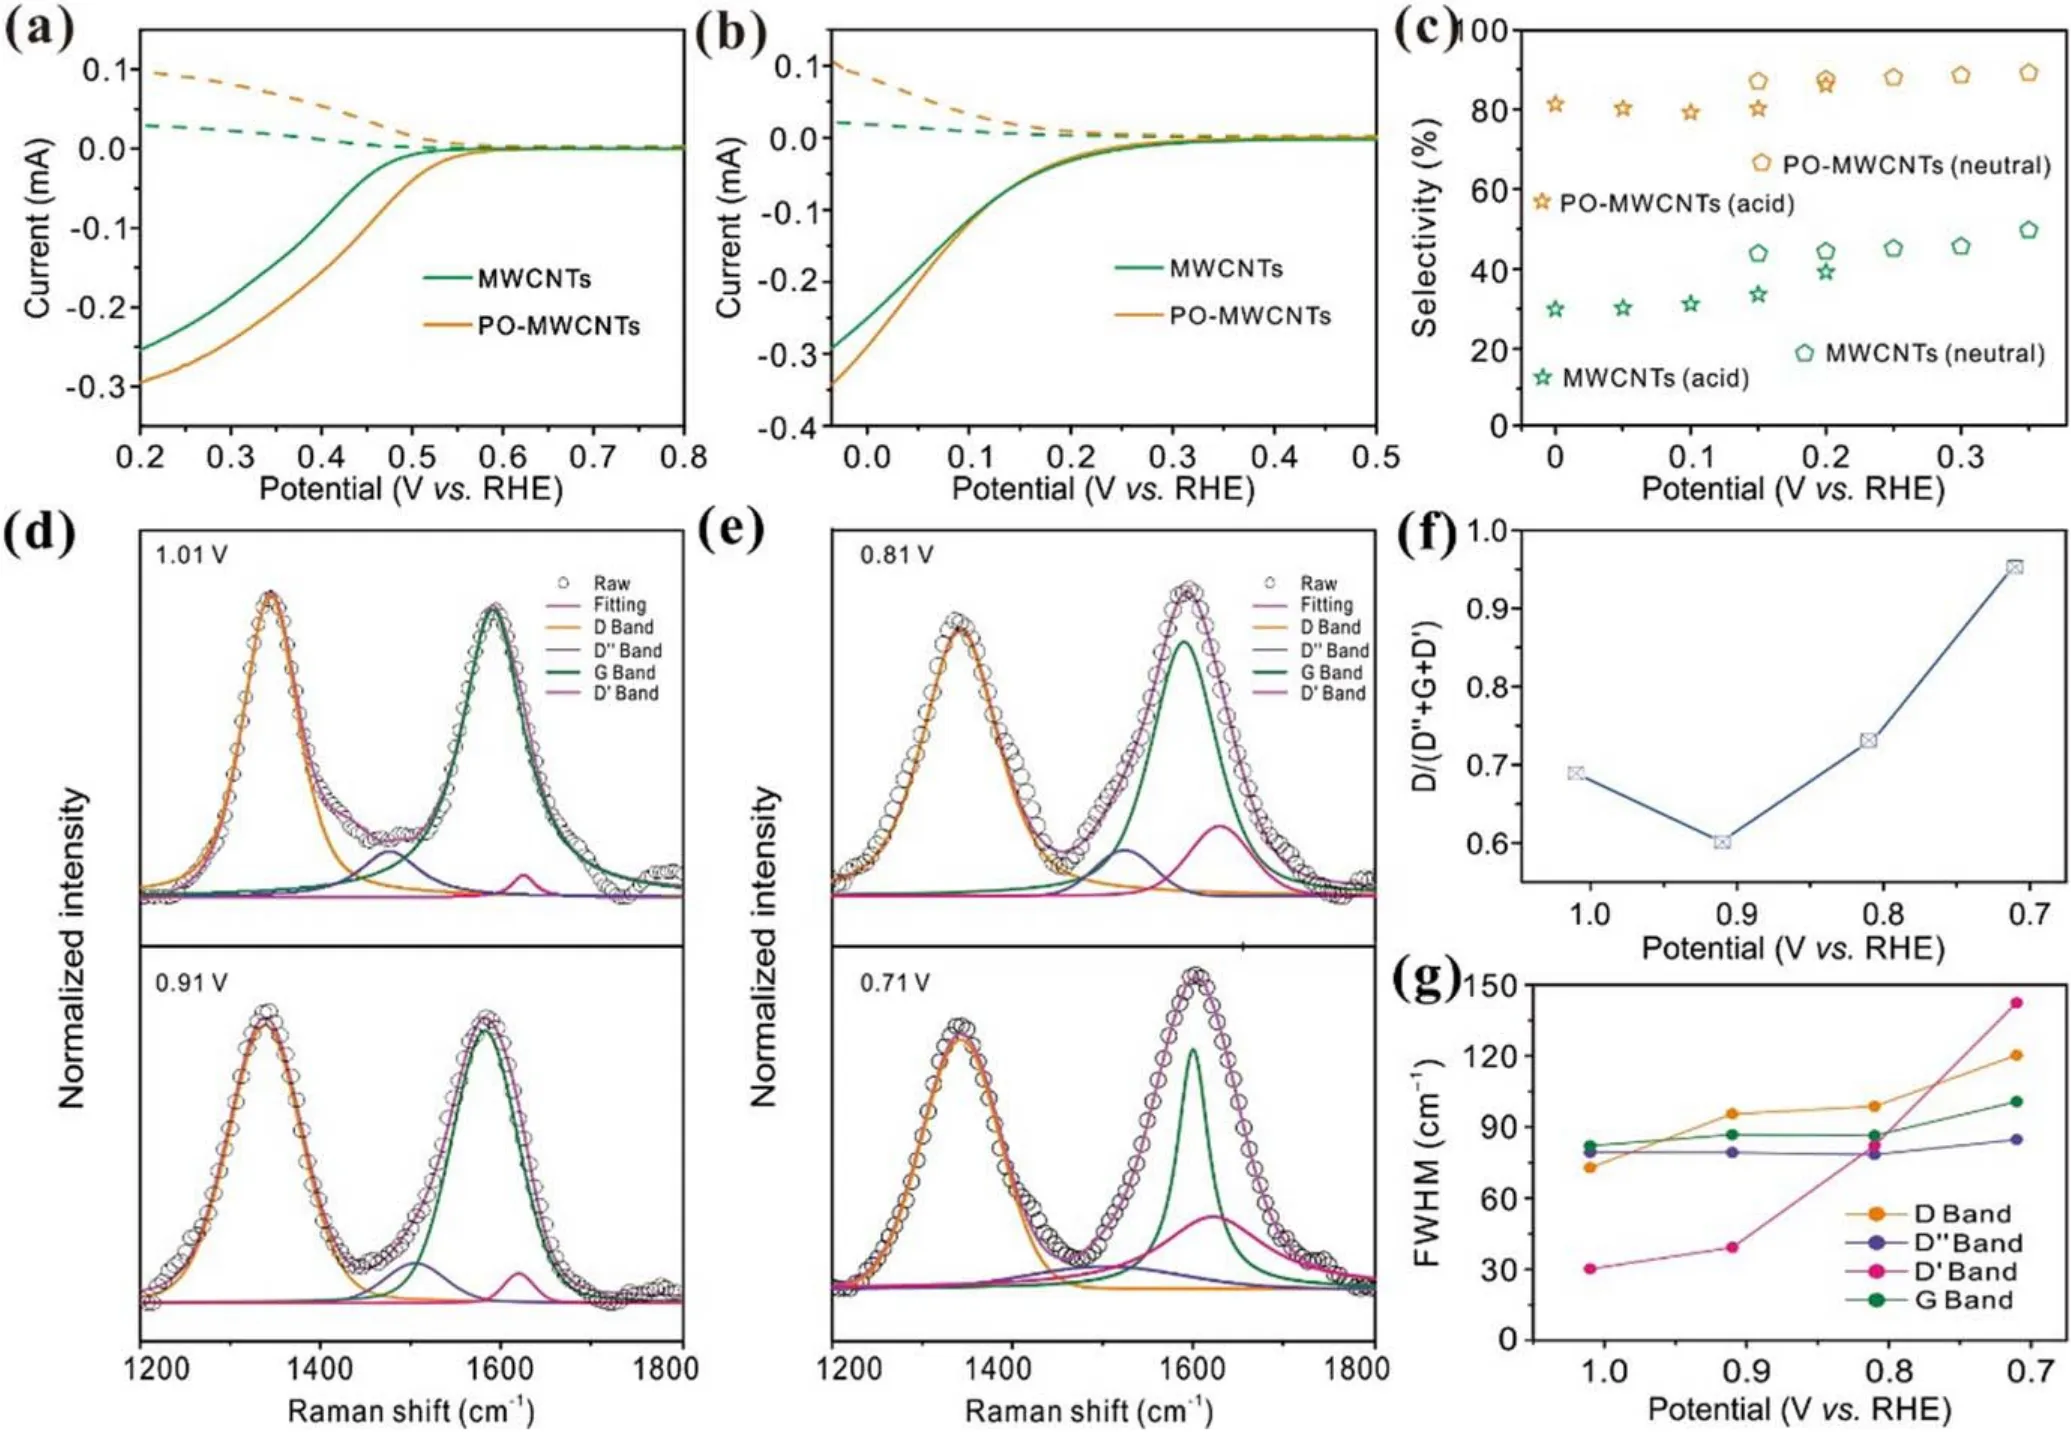
Figure 5.(a),(b)Polarization curves and(c)H2O2 selectivity of MWCNTs and PO-MWCNTs in(a)neutral and(b)acid electrolyte.(d),(e)In-situ Raman spectra with calculated Voigt deconvolutions of PO-MWCNTs at various potentials.ORR occurs below 0.84 V.(f), (g)FWHM and D/(G + D′ + D″) ratio of PO-MWCNTs as a function of applied potentials.0.1 M oxygen-saturated KOH is used as the electrolyte.
As shown in the XPS results, the density of defects in nanocarbons after plasma activation is significantly increased.As such,it is worth exploring what role the defects generated by plasma play in H2O2production.The Raman spectra of nanocarbons are usually composed of five major Raman bands.In terms of the location of their existence, they are defined as D band at ∼1350 cm−1, D″ band at ∼1500 cm−1,G band at ∼1580 cm−1, D′ band at ∼1620 cm−1, and 2D band at ∼2680 cm−1.However, the 2D band mainly reflects the graphene sheet stacks and layer number changes.Therefore,the influence of the 2D band can be excluded during the analysis.Additionally, the D″ band, which is ascribed to amorphous carbon,should be excluded,as amorphous carbon is unavoidable in commercial carbon materials.Therefore,the D and D′ bands corresponding to certain defects which may interact with the intermediates in the ORR process are investigated.The difference between the D and D′ bands is that the D band mostly represents the defects at the edge of the graphene layer, while the D′ band mainly reveals the defects on the sp2basal plane of graphene layer.For the convenience of analysis,the Raman spectra collected between 1.01 and 0.71 V versus RHE are selected as the investigated object(figures 5(d)–(f)).The onset potential of PO-MWCNTs for ORR is around 0.83 V versus RHE, indicating that the ORR cannot happen when the applied voltage is higher than 0.83 V versus RHE.Therefore, no obvious changes are observed on the D and D′ bands at the voltage above 0.83 V versus RHE(figures 5(d)and(e)).However,when the voltage is lower than 0.83 V versus RHE,the intensity of these peaks and full-width at half peak maximum (FWHM) change significantly (figures 5(f) and (g)).As can be observed from figure 5(f), the relative content of the D band (D/D′ + G + D) increases significantly, evidencing possible interaction between the ORR intermediate and the defects related to the D band(edge defect sites).However,the growth rate of the D band between 0.91 and 0.81 V versus RHE is lower than that between 0.81 and 0.71 V versus RHE, suggesting that there may be other active sites interacting with the intermediates to drive the ORR process at lower overpotential.The FWHM value of the D′ band increases obviously from 39.2 cm−1to 142.4 cm−1at the overpotential of 0.91–0.71 V versus RHE,while the FWHM value of the D band only exhibits a more notable increase below 0.81 V versus RHE.It can be concluded that with the increase of defect concentration both edge defect and sp2basal planar defect may be the active sites of 2e−ORR.However, the dominance is highly dependent on the applied voltages [13].
3.4.Characterization and electrochemical performance of other ONCs
Importantly, the plasma activation strategy is universal and can be extended to promote the activity and selectivity of other nanocarbons including SWCNT, G, and SP (figures 6 and S8–S16).The same plasma oxidation method can also maintain the morphology and phase of other nanocarbons and introduce oxygen functional groups (figures 6(a)–(f) and S8,S9,S11,S12,S14,S15).Similarly,the activity and selectivity of these nanocarbons can also be improved after plasma activation.At the same time,the ECSA and Tafel slopes also further reflect the improvement of exposed active sites and reaction kinetics(figures S10,S13,and S16).Remarkably,all the plasma-ONCs in this work exhibit comparable/better selectivity to/than the reported electrocatalysts for H2O2production (table S3) [9, 35–43].
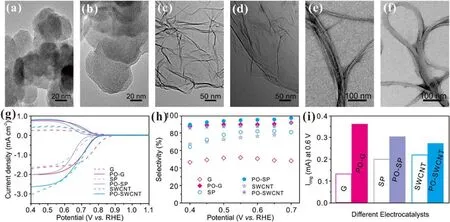
Figure 6.(a),(b)HRTEM images of SP before(a)and after(b)plasma oxidation.(c),(d)HRTEM images of G before(c)and after(d)plasma oxidation.(e), (f) HRTEM images of SWCNT before (e) and after (f) plasma oxidation.(g) Polarization curves and (h) H2O2 selectivity of SP, G, SWCNT and their plasma-oxidized derivatives in 0.1 M KOH.(i) Ring current (at 0.6 V) comparison of G, PO-G, SP, PO-SP,SWCNT, and PO-SWCNT.
3.5.H2O2 production with large electrode and phenol degradation
To verify the practical application of plasma-ONCs, POMWCNTs inked on CP is used as working electrode for demonstration (figures S17 and S18).In order to explore the appropriate voltage range for H2O2generation, the produced H2O2concentration at various voltages for 20 min is shown in figure S17(a).The H2O2yield and current efficiency under different voltages are also calculated (figure S17(b)).At the voltage of 0.5 V versus RHE, high production rate of 54.5 mmol l−1h−1and current efficiency of almost 100%are achieved (figure S17(b)), outperforming most reported electrocatalysts (table S4) [40, 43–46].Strikingly, after 5 h of operation, the electrode performance presents no obvious attenuation, demonstrating good durability (figure S17(c)).Due to the strong oxidation capability of H2O2, the electrochemically synthesized H2O2can be used for on-site degradation of organic pollutants.As such, phenol with a concentration of 50 mg l−1is employed as a model organic pollutant.Only in 3 h, the concentration of phenol can be reduced to 80% (figures S17(d) and S18), verifying the potential real application of plasma-ONCs.
4.Conclusions
In summary,we have developed a rapid and dry O2/Ar plasma activation method to realize the mild oxidation of various nanocarbons and replace the complex and long-term traditional chemical treatment methods.Due to the introduction of oxygencontaining functional groups and defects on the surface of nanocarbons during the plasma activation process,the selectivity and activity for H2O2generation by 2e−ORR have been significantly improved.The possible active sites are revealed byex situXPS andin situRaman tests.The production rate of H2O2reaches as high as 54.5 mmol l−1h−1and the on-site organic pollutant degradation is also demonstrated.This work provides a new strategy to construct ONCs for electrocatalytic H2O2production.Thein situRaman method can be also extended to characterize the active sites of carbon materials in other electrolysis process.
Acknowledgments
This work is supported by National Natural Science Foundation of China(No.12075002),the Outstanding Youth Fund of Anhui Province (No.2008085J21), the Anhui Provincial Supporting Program for Excellent Young Talents in Universities (No.gxyqZD2019005), and the Innovation and Entrepreneurship Project of Overseas Returnees in Anhui Province(No.2019LCX018).Hao Bin Wu acknowledges the funding support from the ‘Hundred Talents Program’ of Zhejiang University.The authors also acknowledge the help of Prof.Zhijuan Hai at Anhui University for HPLC measurement and Miss Ying Yang at Anhui University forin situRaman measurement.
猜你喜欢
校园英语·中旬(2022年3期)2022-04-23
当代工人·精品C(2020年3期)2020-07-04
诗林(2019年4期)2019-11-15
今古传奇·故事版(2019年2期)2019-02-14
方圆(2017年17期)2017-10-11
公务员文萃(2016年7期)2016-07-15
领导文萃(2016年2期)2016-02-29
读者(乡土人文版)(2013年10期)2013-04-12
杂文选刊(2010年7期)2010-05-14
故事林(2008年16期)2008-05-14
 Plasma Science and Technology2021年2期
- Plasma Science and Technology的其它文章
- Effect of edge turbulent transport on scrapeoff layer width on HL-2A tokamak
- An investigation on improving the homogeneity of plasma generated by linear microwave plasma source with a length of 1550 mm
- Spatio-temporal evolution characteristics and pattern formation of a gas–liquid interfacial AC current argon discharge plasma with a deionized water electrode
- Turbulent boundary layer control with a spanwise array of DBD plasma actuators
- Spatio-temporal evaluation of Zr plasma parameters in a single-beam-splitting double-pulse laser-induced plasma
- Enhanced electrocatalytic activity of carbon cloth by synergetic effect of plasma and acid treatment