
Thermal Insulation Properties of Microfibrillated Cellulose Aerogel
2021-06-22 04:22YANGSimin杨思敏LUOXinrong骆鑫荣ANYuying安昱盈TULexi屠乐希SHENHua
YANG Simin(杨思敏), LUO Xinrong(骆鑫荣), AN Yuying(安昱盈), TU Lexi(屠乐希)*, SHEN Hua(沈 华)*
1 College of Textiles, Donghua University, Shanghai 201620, China
2 Chinatesta Textile Testing & Certification Services, Shaoxing 312071, China
Abstract: Microfibrillated cellulose (MFC) aerogels are bio-based materials with high thermal resistance. In this study, MFC aerogels and MFC-kapok composite aerogels were prepared. A series of experiments were carried out in a climate chamber to study the influence of MFC concentration, the temperature gradient, testing methods and introduction of kapok fibers on the thermal insulation properties of aerogels. The results suggested that the density of MFC aerogels was less than 10 mg/cm3 and the porosity was higher than 99%. Besides, the minimum thermal conductivity of MFC aerogels was 0.035 7 W·m-1·K-1 observed at 0.8% MFC aerogels. The minimum thermal conductivity of MFC-kapok composite aerogels was 0.038 2 W·m-1·K-1 when the ratio of MFC to kapok was 2∶6.
Key words: microfibrillated cellulose (MFC) aerogel; freeze-drying; thermal resistance; kapok; thermal conductivity
Introduction
Aerogel is a novel material with a continuous three-dimensional(3D) nanoporous network[1]and uses gases as a dispersion medium. It is widely used in fuel cells[2], filtration and ultra-thin dust purification[3]and high-performance thermal insulators[4]. Some researchers worked on the issues of sustainable and environmental-friendly energy sources. Cellulose is considered as the most abundant organic compound derived from biomass. The production of such biopolymer is around 1010-1011t per year[5]. Microfibrillated cellulose (MFC) is a cellulosic material developed from high-volume cellulose[6-8].
Aerogel thermal insulation materials have been widely used in construction, chemical industry, textile, aerospace and other fields, since they have the advantages of reducing energy consumption in storage and transportation[3]. Many experimental studies have been carefully conducted to investigate the thermal properties of aerogels. Hayaseetal.[9]developed a SiO2aerogel with high insulation, high bending performance and super hydrophobicity. Sietal.[10]developed elastic aerogels with a density of 40.12 mg/cm3, which could rapidly recovery from deformation and efficiently absorb the energy. Kuhnetal.[11]demonstrated that the SiO2aerogel mixed with TiO2powder could significantly reduce the effect of radiation. The aerogel materials were also applied in aviation engines due to their light weight and low thermal conductivities.
Kapok fiber is an abundant natural cellulose fiber extracted from the seedpod of the kapok tree. It is low cost and environmentally friendly. The hollow rate of kapok fiber is high to 80%-90% and the density is low to 0.3 g/cm3. Still air is stored in the hollow structure, leading a high thermal insulation. Consequently, the kapok fiber is widely used in thermal insulation products[12-13]. In the present work, MFC aerogels and MFC-kapok composite aerogels are developed. The surface morphologies, infrared spectral characterizations and contact angles of aerogels are carefully analyzed. In addition, a series of objective tests are also carried out to find the heat transfer between aerogel and environment. The dependence of thermal conductivity and thermal resistance on different ambient temperature conditions is further researched. Besides, the influence of kapok fibers on the thermal properties is also studied. The results obtained from this study can be helpful to design suitable materials for various industrial applications.
1 Materials and Methods
1.1 Materials
Three kinds of materials, namely MFC with a mass fraction of 1.5%, hydrochloric acid (HCl, 37%) and vinyl trimethoxysilane (VTMO, 98% purity), were used in this study for the preparation of aerogels. These materials were purchased from Qihong Technology Co., Ltd. (Guilin, China), Chemical Reagent Factory (Pinghu, China) and Boiling Point Chemical Co., Ltd. (Hangzhou, China), respectively.
1.2 Aerogel preparation
1.2.1MFCsuspension
MFC suspensions with different concentrations were prepared to observe the influence of MFC concentrations on the aerogel formation. And 20 g MFC was mixed with 55 mL deionized water. The MFC suspension with the concentration of 0.4% was obtained after 1 h stirring. Then the MFC suspensions with the concentrations of 0.6%, 0.8%, 1.0% and 1.2% were separately obtained by the same method. The preparation process was carried out in a laboratory at the temperature of 25 ℃.
1.2.2Chemicaltreatment
VTMO (0.15 mL) and 0.1 mol/L HCl were mixed in the above MFC suspensions, as the cellulose and the polymer could be connected by the vinyl group and the methoxy group in the silane coupling agent. The interface properties between the polymer and the cellulose can be improved and this leads to a better formability. The value of pH was around 4. Then the modified MFC suspensions with various concentrations were obtained after 4 h stirring.
1.2.3Freezedrying
MFC suspensions were frozen in a freezer at -24.0 ℃, after which the suspensions were frozen and dried by using an FD-1D-50 vacuum freeze-dryer (Bilang Instrument Manufacturing Co., Ltd., Shanghai, China). During the freeze-drying process, the temperature of the condenser was -58.0 ℃ and the pressure of the freeze-dryer was below 9 Pa.
1.2.4MFC-kapoksuspension
Figure 1 shows the preparation process of MFC-kapok suspensions. Kapok fibers was added in the MFC suspensions to observe the influence of kapok fibers on the thermal properties of aerogels. Three MFC-kapok suspensions with different MFC/kapok ratios (6∶2, 4∶4, and 2∶6) were prepared. The aerogel was obtained by the freeze-drying process mentioned above.
1.3 Characterization
1.3.1Fouriertransforminfrared(FTIR)spectroscopy
Spectrum II FTIR (PerkinElmer, USA) was adapted to observe the difference between modified and unmodified MFC aerogels. Each test was repeated for 3 times in the range of 4 000-500 cm-1.
1.3.2Scanningelectronicmicroscope(SEM)
Surface morphologies of MFC aerogels and MFC-kapok composite aerogels were examined by using an SEM(FLEXSEM 1000, HITACHI Co., Ltd., Japan) at 10 kV. Before SEM observation, experimental samples were immersed in liquid nitrogen and then fractured to avoid deformation of the hollow lumen. Besides, thin layers of gold were deposited by sputtering onto the surface of the cross sections.
1.3.3Contactangletest
Microscopic observations of water wetting on MFC aerogels were conducted by using an optical contact angle meter (OCA15EC, Dataphysics, Germany). The sample was placed on the stage of the meter. The droplets of 5 μL were dropped at different positions on the smooth surface of the sample. Each test was repeated for 3 times to obtain the average result.
1.3.4Porositycalculation
The porosity of MFC aerogels and MFC-kapok composite aerogels, which was the fraction of void space in the sample, was calculated by
(1)
whereφis the porosity of aerogels, %;ρbulkis the density of aerogels;ρskeletalis the density of aerogels’ skeleton.ρbulkandρskeletalconsist of MFC, VTMO or kapok fibers, which can be calculated by Eqs. (2)-(3)[14], respectively.
(2)
(3)
whereMis the mass of aerogels, g;Vis the volume of aerogels, cm3;Maerogel,Mcellulose,MVTMOandMkapokare the mass of aerogels, microfibrillated cellulose, VTMO and kapok fibers, respectively;ρcelluloseis the density of cellulose, 1.500 g/cm3[15];ρVTMOis the density of VTMO, 0.968 g/cm3;ρkapokis the density of kapok fibers, 0.300 g/cm3[16].
1.3.5Thermalinsulationperformancetest
The experimental samples were MFC aerogels with various concentrations (0.4%, 0.6%, 0.8%, 1.0% and 1.2%) and MFC-kapok composite aerogels with different MFC/kapok ratios (6∶2, 4∶4, and 2∶6). The thermal conductivity and the thermal resistance of MFC aerogels and MFC-kapok composite aerogels were examined by using a KES-F7-II-B tester (Kato Tech Co., Ltd., Japan). Double-plate and single-plate methods were adopted to observe the influence of ambient air on the heat transfer. The tests were carried out in a climate chamber at the temperature of 20 ℃, with a relative humidity of 65% and a wind velocity less than 0.1 m/s.
Figure 2(a) is the front view of testing instrument that consists of hot plates and cool plates used in the double-plate method. The hot plate which was a cuboid with 50 mm in width and 50 mm in length consisted of a testing plate and guarded plate. Temperature sensors were embedded in the plates to provide the requested temperature with a standard deviation less than 0.1 ℃. The cool plate which was also a cuboid with 200 mm in both length and width was maintained at 20.0 ℃. Before the test, the hot plate was respectively set at 30.0 ℃, 37.0 ℃ and 44.0 ℃ to observe the influence of temperature difference on the thermal properties of samples. The sample was evenly placed on the surface of the cool plate. After starting the test, the hot plate was gently placed on the sample. The heat transferred from the high-temperature hot plate to the low-temperature cool plate subsequently occurred due to the energy transmission between molecules with different kinetic energy. During the measurement, the generated heat flux and the associated surface temperature were recorded.
Figure 2(b) shows the single-plate method. The interface between the inner surface of the sample and the hot plate was kept closely contact, with the outer surface of the sample being exposed to ambient air. When the measurement reached a steady state, the average temperature of the outer surface in the steady state was examined by using the infrared thermal imager (FLIR C2, FLIR Systems, Inc., America).
The thermal conductivityλand the thermal resistanceRcan be calculated according to Eqs. (4)-(5), respectively, by using the heat flux and the temperature in the steady state. The size of samples was 80 mm × 80 mm.
(4)
(5)
whereλis the thermal conductivity, W·m-1·K-1;dis the sample thickness, mm;Ris the thermal resistance, m2·K-1·W-1;Ais the surface area of the hot plate, m2;qis the heat flux, W; ΔTis the temperature difference between the hot plate and the cold plate, ℃.
2 Results and Discussion
2.1 Characteristics of aerogel
Table 1 shows the detailed characterizations of aerogel samples. Samples A-E were MFC aerogels made by MFC with various concentrations. It was observed that the thickness and the mass density increased with the increase of the MFC concentration. However, the porosity and the air permeability decreased with the concentration due to the increasing solid phase. Samples F-H were composite aerogels consisting of MFC and kapok fibers. Although the thickness of Samples F-H was higher than that of Samples A-C, the mass density and the porosity were lower than those of pure MFC aerogel (Samples A-E). This is due to the fact that the mass density of kapok fibers is lower than that of MFC and the kapok fibers intertwined with MFC. It was observed that the air permeability of Samples F-H was higher than that of pure MFC aerogels (Samples A-E) as the hollow rate of kapok fibers was high to 90%[9].

Table 1 Characteristics of samples
2.2 Surface morphology analysis
The surface morphologies of samples were examined by using an SEM, as presented in Fig. 3. The macroscopic surface morphologies of samples were shown in the top right of each picture. Samples A-E suggest the isotropic layered structure with a highly interconnected 3D cellular porous structure. This is due to the fact that ice crystals in aerogel sublimated to gases during freeze-drying treatment.

Fig. 1 Preparation process of MFC-kapok composite aerogels

Fig. 2 Testing methods: (a) double-plate; (b) single-plate

Fig. 3 Surface morphologies of samples: (a)-(h) cross section of Samples A-H; (i) amplifying structure of Sample F

Fig. 4 FTIR spectra of modified and unmodified aerogels
In addition, the porous structure of samples is associated with the solidification process[17]. The layered structure is obtained with the growth of ice crystals. The size of the hole was found to mainly range from 50 μm to 200 μm as the freezing process was carried out in the refrigerator. The temperature of the refrigerator was higher than that of liquid nitrogen, resulting in a slower freezing speed and larger ice crystals[18].
It was observed that the size of the hole decreased with the increasing concentration of MFC, as shown in Figs. 3 (a)-(e). This could be explained by the fact that greater hydrogen bonds and van der Waals forces held the fibers together and then more microfibrinolytic cellulose was aggregated to form lamellar films[19].
Besides, more loose cracks were observed on the macroscopic aerogel surface when the concentration of MFC was lower due to the less cellulose content. The forming ability of aerogels became better with the increasing concentration of MFC and the surface became more uniform. The surface of Sample D is the best uniform with 1.0% concentration of MFC, after which the cracks increased. This implies that high concentrations of MFC may lead to the weak formation.
Figures 3 (f)-(h) were the surface morphologies of MFC-kapok composite aerogels with different ratios of kapok to MFC. The 3D honeycomb porous structure and the hollow structure of kapok fibers were observed in the figures. The kapok fiber was wrapped by MFC, leading to a criss-cross network structure. Besides, it was found that with the increasing concentration of kapok fibers, the porosity of composite aerogels increased from 97.1% to 98.3%.
2.3 FTIR spectra

2.4 Contact angle analysis
The contact angle of the samples modified by VTMO was plotted against the concentration of MFC in Fig. 5. The results showed that the samples were hydrophobic as the value of all contact angles was higher than 120°. This is due to the fact that a large number of organo-hydrophobic vinyl is attached to the surface of aerogel after being modified by silane. The results implied that the VTMO was successfully grafted onto the cellulose aerogel. Such modified structure can prevent the penetration and the destruction of water[20]. Besides, as shown in Fig. 5, the contact angle of the aerogel increased with the increasing concentration of MFC and escalated to the maximum value at the MFC concentration of 0.8%, after which the contact angle decreased. This implied that the no extra VTMO could be grafted with MFC when the concentration of MFC was higher than 0.8%.
2.5 Thermal properties
Double-plate and single-plate methods were adopted to measure the thermal properties of aerogels. The single-plate method was used to observe the insulation ability of aerogels between solid and external fluid. The double-plate method simulated the aerogels applied to both sides of solid.
2.5.1ThermalpropertiesofMFCaerogelsmeasuredbydouble-platemethod
The thermal conductivity and the thermal resistance of MFC aerogels measured by the double-plate method was plotted against the concentration of MFC as shown in Fig. 6. As presented in Fig. 6(a), the thermal conductivity of MFC aerogels increased with the increasing temperature difference between the hot plate and the cold plate. The thermal conductivity of Sample C (0.8% MFC) increased by 15% and 4% at a temperature difference of 17.0 ℃ and 24.0 ℃, respectively, when compared with the thermal conductivity at temperature difference of 10.0 ℃. This can be explained by the fact that the kinetic energy of the air molecules increases with the increase of temperature[21], thus resulting in the greater conductive and convective heat transfer. In addition, the radiative heat transfer between pore walls was also enhanced with the increase of temperature.
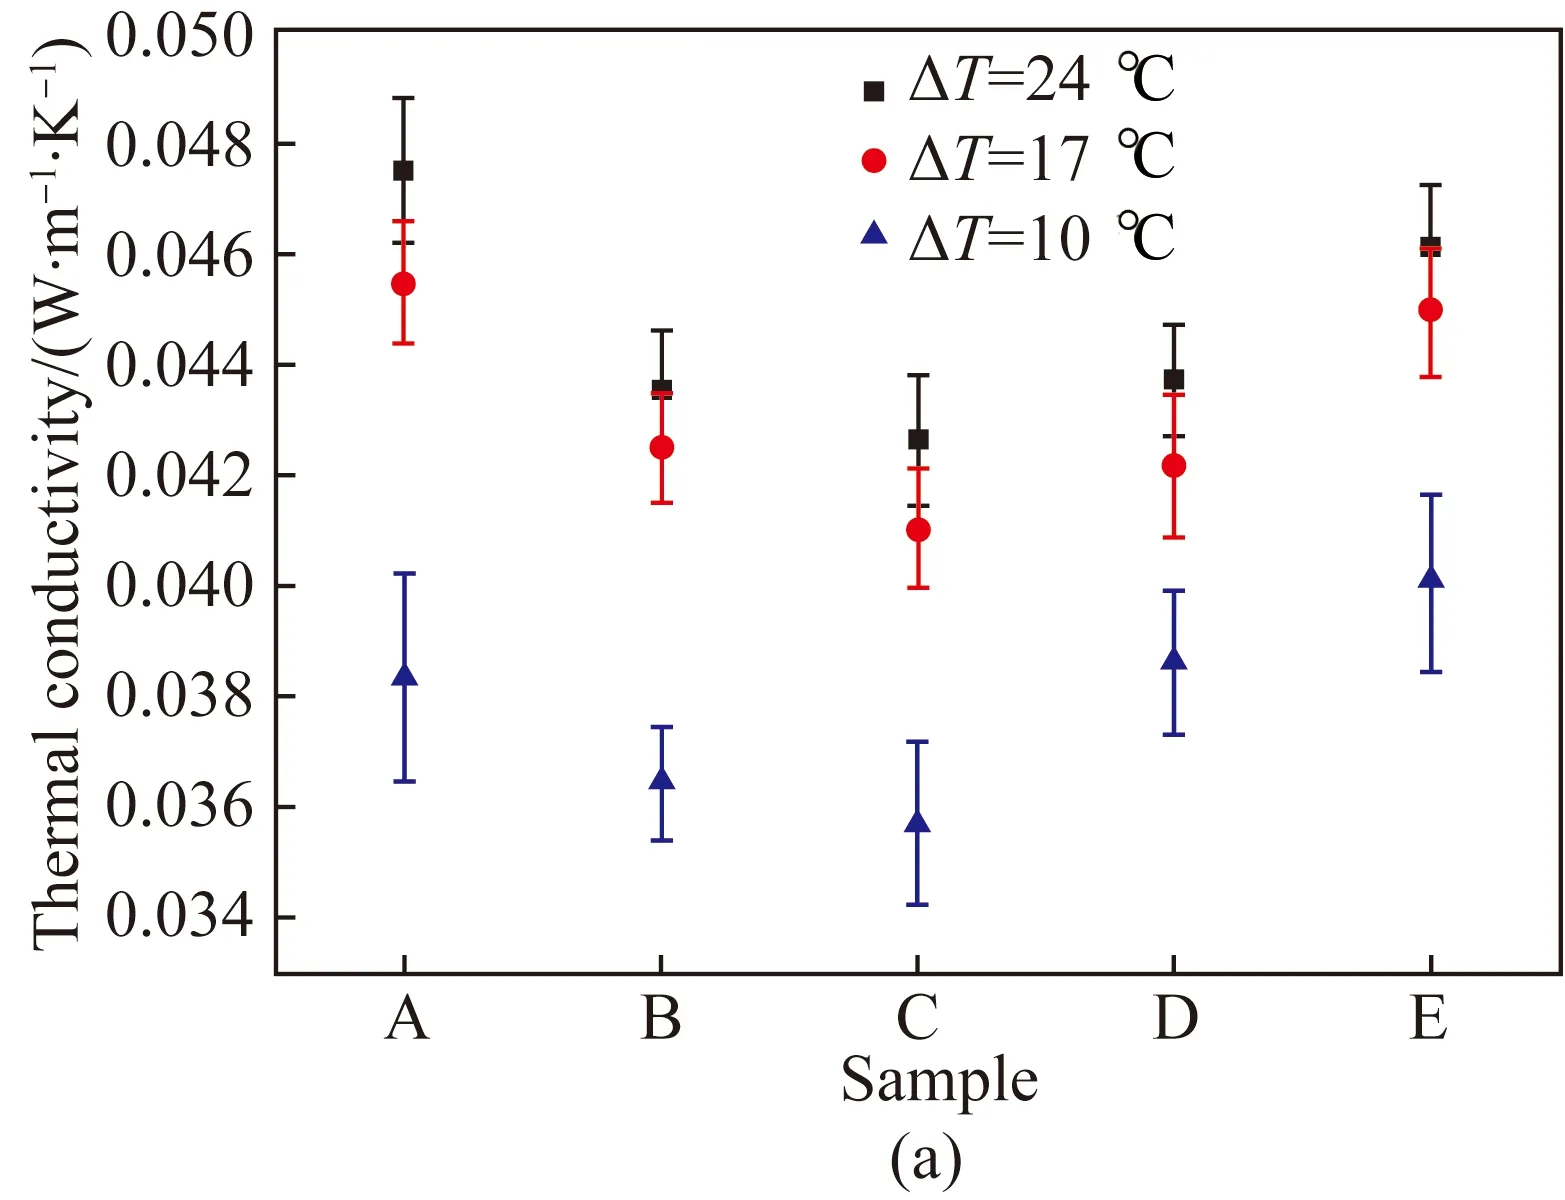
Fig. 6 Thermal properties of samples measured by double-plate method: (a) thermal conductivity; (b) thermal resistance
It was found that at a temperature difference of 10.0 ℃, the thermal conductivity of samples was observed to decrease when the concentration of MFC increased from 0.4% to 0.8% and got the minimum value 0.035 7 W·m-1·K-1, after which it increased with the higher concentration of MFC. The same tendency was also observed under other temperature differences. This was supposed to be associated with the enhanced convection in the aerogel due to the larger holes caused by the lower concentration of MFC (shown in Fig. 3). Then the holes became smaller with the higher concentration of MFC, leading to less convection and smaller thermal conductivity. When the concentration of MFC increased to 0.8%, the solid phase with higher thermal conductivity was significantly enhanced with the continuous increasing concentration of MFC. Consequently, the thermal conductivity of Sample E was increased up to 12% compared with that of Sample C. In addition, it was observed that the thermal conductivity of samples significantly increased with the increasing temperature difference from 10.0 ℃ to 17.0 ℃. However, the thermal conductivity slightly increased when the temperature difference increased from 17.0 ℃ to 24.0 ℃. This may because the thermal conductivity of MFC increased slightly with the increase of temperature[22].
As illustrated in Fig. 6(b), it was observed that the thermal resistance of samples increased when the concentration of MFC increased from 0.4% to 1.0%, after which it decreased with the increase of MFC concentration. This could be due to the fact that the thickness of samples was enhanced with the increasing concentration of MFC, as shown in Table 1. However, the porosity decreased with the increasing concentration of MFC, leading to a lower thermal resistance at Sample E. This because the thermal conductivity of air in the static state was about 0.026 W·m-1·K-1, which was much lower than that of MFC[23].
2.5.2ThermalconductivityofMFC-kapokcompositeaerogelsmeasuredbydouble-platemethod
According to the above analysis, the thermal conductivity of Sample C with the MFC concentration of 0.8% was the lowest (0.035 7 W·m-1·K-1). In this section, kapok fibers were adopted to replace the part of MFC to observe the influence of kapok fibers on the thermal conductivity of aerogels, as shown in Fig. 7. Compared with that of Sample C, the thermal conductivity of composite aerogels was higher. The thermal conductivity of Sample H was 0.038 2 W·m-1·K-1, which was 7% higher than that of Sample C. The main reason was that the heat transferred through solid-phase channels by conduction increases as part of kapok fibers were embedded by the MFC structure and the hollow structure of kapok fiber was compressed, as shown in Figs. 3(f)-(h). Besides, the thermal conductivity of composite aerogels decreased with the increase of the proportion of kapok fibers due to the increasing porosity caused by hollow kapok fibers. Furthermore, the thermal conductivity of composite aerogels increased with the temperature difference, with the maximum discrepancy up to 13% from 10.0 ℃ to 24.0 ℃ of the temperature difference.

Fig. 7 Thermal conductivity of MFC-kapok composite aerogels
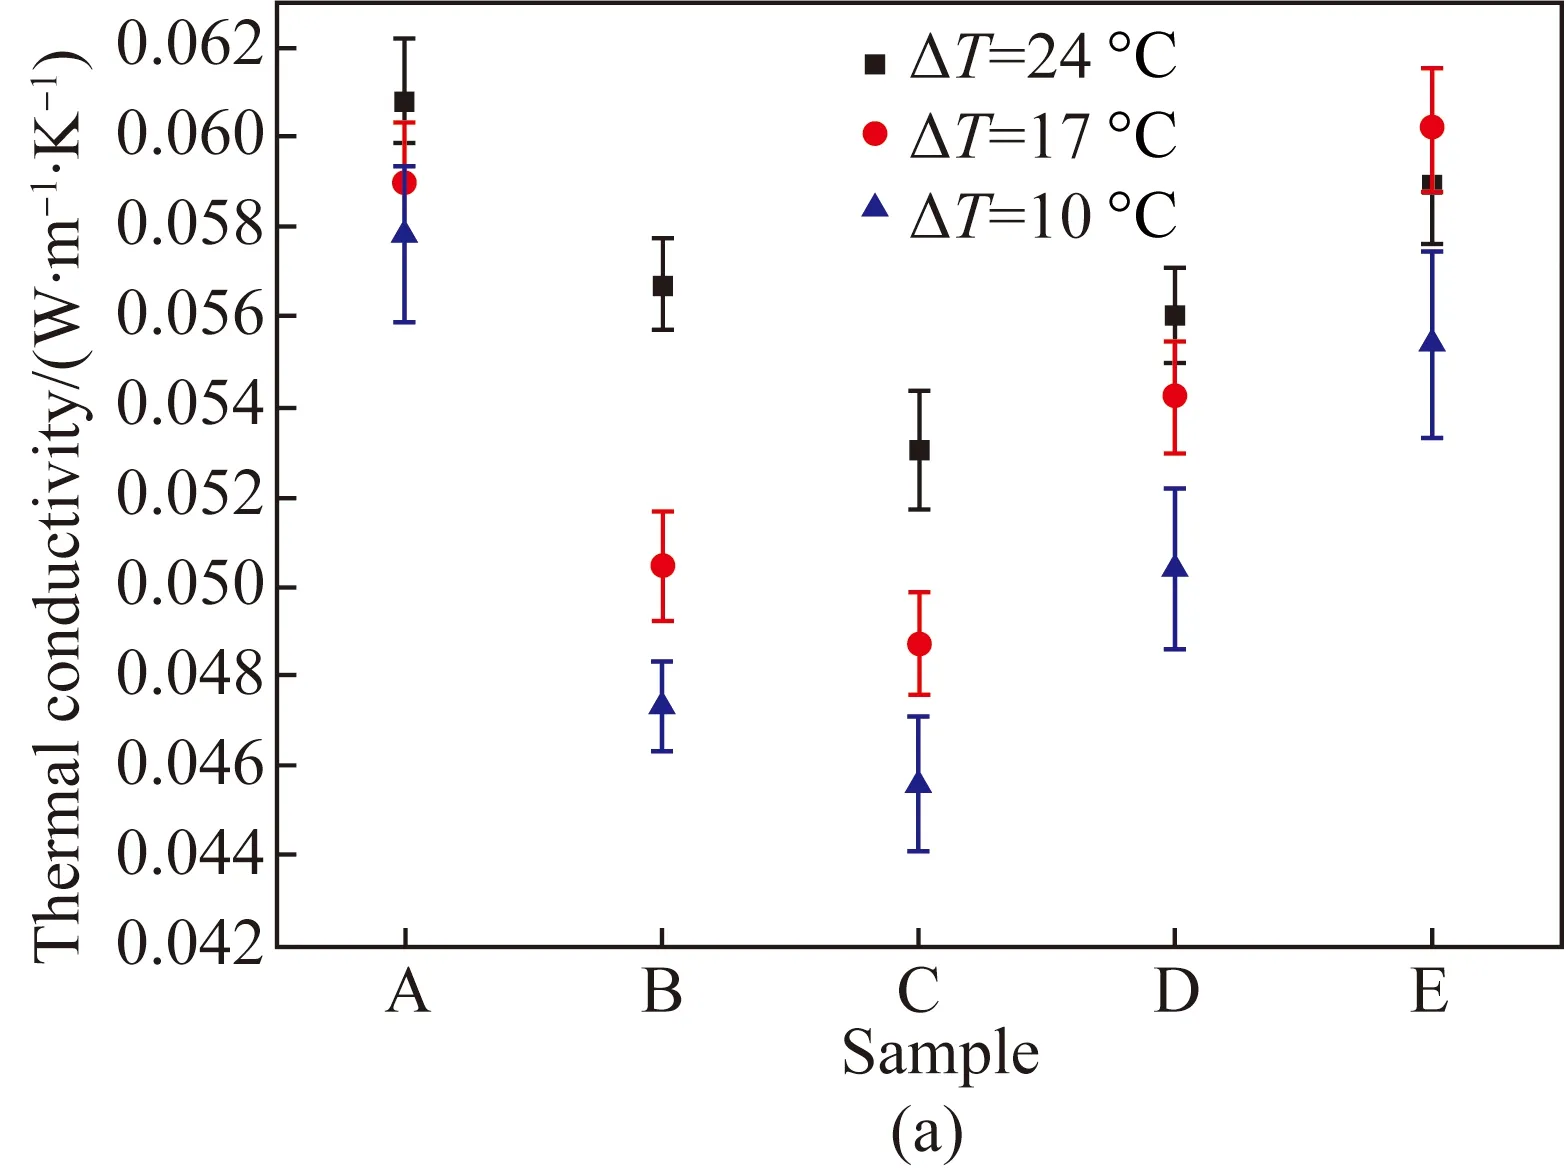
Fig. 8 Thermal properties of samples measured by the single-plate method: (a) thermal conductivity of MFC aerogels; (b) thermal resistance of MFC aerogels; (c) thermal conductivity of MFC-kapok composite aerogels
2.5.3ThermalpropertiesofMFC-kapokcompositeaerogelsmeasuredbysingle-platemethod
The single-plate method was adopted to measure the thermal properties of samples to observe the difference from the double-plate method. Figures 8(a) and (b) show the thermal conductivity and the thermal resistance of MFC aerogels with different concentrations examined by the single-plate method. Figure 8(c) shows the thermal conductivity of MFC-kapok composite aerogels. Similar tendency was also observed in single-plate method compared with the double-plate method. However, the thermal conductivity measured by the single-plate method was higher than that measured by the double-plate method. This is due to the fact that the air inside the porous aerogel exchanges more heat with ambient by convection under single-plate method. Such convection was significant in Samples A and B due to the more cracks caused by the lower concentration of MFC, with a maximum drop of 34% in the thermal resistance compared with the value obtained by the double-plate method.
3 Conclusions
In this work, modified MFC aerogels and MFC-kapok composite aerogels with different concentrations were prepared. No obvious cracks were observed in aerogels when the concentration of MFC was higher than 0.8%. The internal structure was a highly interconnected 3D cellular porous structure. With the increase of the MFC concentration, the density and the porosity of aerogels increased due to the increasing skeletons. Besides, the contact angle increased up to the maximum when the concentration of MFC was 0.8%. Then the thermal properties of aerogels were measured by two methods under various temperature differences. The thermal conductivity of samples measured by the double-plate method was observed to decrease when the concentration of MFC increased from 0.4% to 0.8% and then increased with the higher concentration of MFC. The thermal conductivity of MFC aerogels increased with the increase of the temperature difference. Besides, the thermal conductivity of composite aerogel was higher than that of 0.8% MFC aerogels due to the increasing solid-phase channels. The thermal conductivity of composite aerogels decreased with the greater proportion of kapok fibers as the porosity increased. Similar tendency was also observed in the single-plate method. However, the thermal conductivity measured by the single-plate method was higher than that of measured by the double-plate method due to the heat exchange between the air inside the aerogel and the environment.
 Journal of Donghua University(English Edition)2021年2期
- Journal of Donghua University(English Edition)的其它文章
- Electrochemical Performance of Core-Sheath Dip-Coated Lignin Derived Carbon/Wet-Spun Graphene Electrodes for Fiber-Shaped Supercapacitors
- Preparation and Properties of Polyurethane/Nickel Nanofiber with Core-Shell Structure Using Coaxial Electrospinning Method
- Trajectory Optimization and Motion Simulation of a Flexible Polishing Industrial Robot for Watchcases
- Effect of Supported Bearing Clearance on Load-Sharing Characteristics of a Double-Row Planetary Gear System
- Meta-Analysis on the associations between Prenatal Perfluoroalkyl Substances Exposure and Adverse Birth Outcomes
- Numerical Simulation of Space Fractional Order Schnakenberg Model