
Flood disaster monitoring based on Sentinel-1 data:A case study of Sihu Basin and Huaibei Plain,China
2021-09-09 07:55XuYunXiochunZhngXiuguiWngYuZhng
Water Science and Engineering 2021年2期
Xu Yun ,Xio-chun Zhng ,*,Xiu-gui Wng ,Yu Zhng
a State Key Laboratory of Water Resources and Hydropower Engineering Science,Wuhan University,Wuhan 430072,China
b Spatial Information Technology Application Research Department,Changjiang River Scientific Research Institute,Wuhan 430010,China
Abstract Summer floods occur frequently in many regions of China,affecting economic development and social stability.Remote sensing is a new technique in disaster monitoring.In this study,the Sihu Basin in Hubei Province of China and the Huaibei Plain in Anhui Province of China were selected as the study areas.Thresholds of backscattering coefficients in the decision tree method were calculated with the histogram analysis method,and flood disaster monitoring in the two study areas was conducted with the threshold method using Sentinel-1 satellite images.Through satellite-based flood disaster monitoring,the flooded maps and the areas of expanded water bodies and flooded crops were derived.The satellite-based monitoring maps were derived by comparing the expanded area of images during a flood disaster with that before the disaster.The difference in spatiotemporal distribution of flood disasters in these two regions was analyzed.The results showed that flood disasters in the Sihu Basin occurred frequently in June and July,and flood disasters in the Huaibei Plain mostly occurred in August,with a high interannual variability.Flood disasters in the Sihu Basin were usually widespread,and the affected area was between Changhu and Honghu lakes.The Huaibei Plain was affected by scattered disasters.The annual mean percentages of flooded crop area were 14.91%and 3.74%in the Sihu Basin and Huaibei Plain,respectively.The accuracies of the extracted flooded area in the Sihu Basin in 2016 and 2017 were 96.20%and 95.19%,respectively.
Keywords:Flood disaster monitoring;Sentinel-1 radar image;Remote sensing;Threshold method;Sihu Basin;Huaibei Plain
1.Introduction
Flood disasters caused by regional rainstorms have become one of the most severe types of natural meteorological disasters.An analysis based on the emergency event database(EM-DAT)showed that 1 125 flood disasters occurred in Asia from 1990 to 2010,resulting in more than 6.76 million deaths and economic losses of 132 million USD(Yang et al.,2013).The rising trend in global average temperature will not be reversed by the end of the 21st century,and the frequency of extreme weather conditions,such as heat waves and heavy rainfall,will increase(Qin,2014).
Natural disasters occur frequently in China due to geographical location and topography(Zhang et al.,2008),and increasing urbanization and climate change make China more vulnerable to floods(Rubinato et al.,2019).According to previously published statistics on heavy rain and flood disasters,172 large-scale flood disasters occurred in China between 1998 and 2013,and of these years,the impacts of disasters were particularly severe in 2002,2005,2006,and 2007(Liu,2017).The features of flood disasters in different regions of China are different because of the large geographical extent and variation of the country.In northern China,disasters alternate between droughts and floods,whereas the main disasters in southern China are floods,due to abundant rainfall.
The traditional sampling method of flood monitoring is time-consuming and laborious,whereas satellite remote sensing technology has advantages in saving time and effort(Li et al.,2018),and has therefore become an important means(Zeng et al.,2020).A synthetic aperture radar(SAR)satellite can extract images of flooded areas and calculate the soil moisture during heavy rains(Wu et al.,2019;Zhang et al.,2019).Zheng et al.(2007)combined advanced synthetic aperture radar(ASAR)images and optical images to detect flooded areas.Zhao(2012)extracted flood information using the moderate-resolution imaging spectroradiometer(MODIS)-based spectral index method and the ASAR time-series flood index method,but these radar images have low spatial resolutions.The Sentinel-1 and Sentinel-2 satellite imagery data can be downloaded for free and have the advantages of a short revisit period and high spatial resolution.They have been widely used in terrain classification,water body information extraction,land surface subsidence,soil moisture inversion,and other fields.Puno et al.(2021)used Sentinel-2 images to obtain land-cover maps.Zhao et al.(2021)monitored the water level and water area of Wuhai Lake,the Shizuishan section of the Yellow River,and Shahu Lake based on Sentinel-2 data.Zhang et al.(2020)combined Landsat8 and Sentinel-2 data to extract water surface information.Both Zhao et al.(2021)and Zhang et al.(2020)pointed out that optical satellite images without clouds should be chosen,but flood disasters were always accompanied by rainstorms and clouds.The Sentinel-1 radar satellite can obtain clearer images in rainstorm weather than the Sentinel-2 optical satellite.Chen et al.(2020)proved that Sentinel-1 data were more convenient than other images for extraction of the water area in Nanjing,China.
A variety of methods have been used to monitor flood disasters based on satellite data.Huang et al.(2016)combined the supervised and object-oriented classification method to classify the features of the Xihu District of Hangzhou,China.Chen et al.(2015)used the decision tree method to extract water bodies in Xinyuan County,Xinjiang Uygur Autonomous Region,China,with satisfactory performance.Fan et al.(2018)used the threshold method to monitor the water-body expansion after heavy rains in Anqing City,Anhui Province,China,based on Sentinel-1 images.The histogram analysis method was used by Zeng et al.(2015)to extract flood inundation area in Sri Lanka.
In this study,Sentinel-1 images of the Sihu Basin of China from 2016 to 2020 and images of the Huaibei Plain of China from 2017 to 2020 were selected.The thresholds of the backscattering coefficient in the decision tree method were calculated with the histogram analysis method,and flood disaster monitoring was conducted with the threshold method based on the Sentinel-1 data.Through the flood disaster monitoring in the Sihu Basin and Huaibei Plain,this study analyzed the differences in flood disaster features of the two study areas.The findings of this study have the potential to provide a reference for recognizing the characteristics of flood disasters and to explore the feasibility of use of Sentinel-1 images in natural disaster monitoring.
2.Study areas and data
2.1.Huaibei Plain with alternating flood and drought conditions
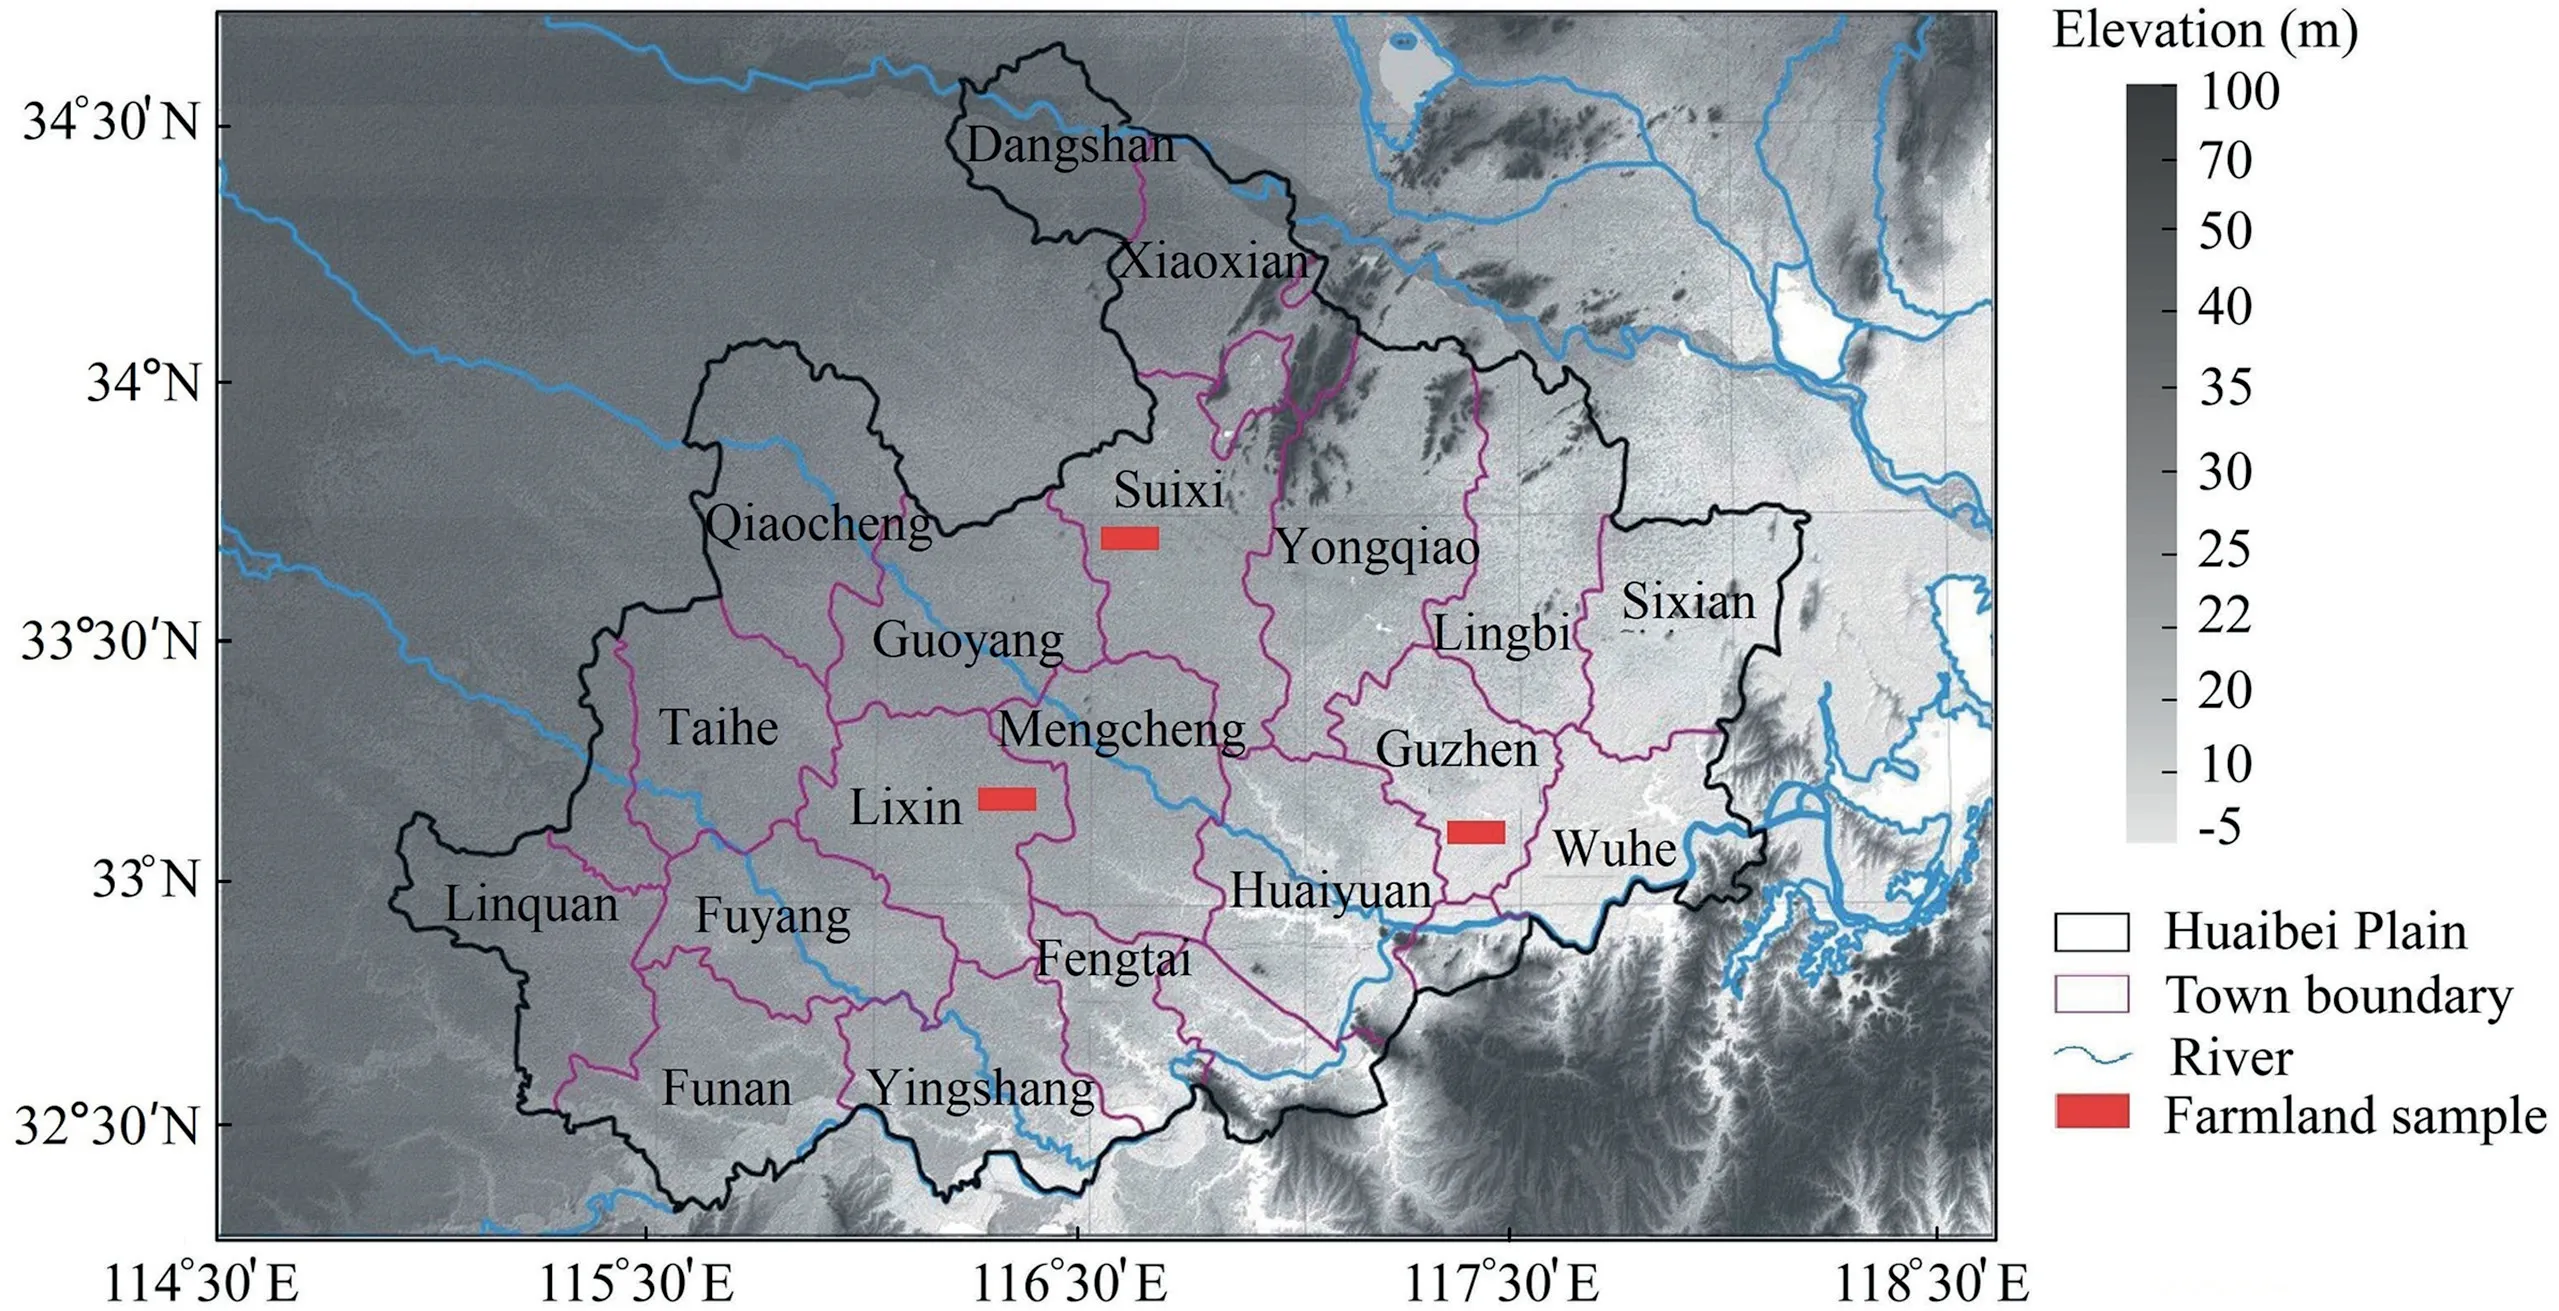
Fig.1.Geographical location of Huaibei Plain.
The Huaibei Plain is located in northern Anhui Province in China within a longitude band of 114°55′E to 118°10′E and a latitude band of 32°25′N to 34°35′N(Fig.1).This region has an area of 37 400 km2.The northwest part is slightly higher in elevation than the southeast part,and there are some lakes and shoals in the lower southern part.The Huaibei Plain has the largest agricultural population in Anhui Province.It is characterized by a semi-humid monsoon climate,being dry in spring and winter and warm and rainy in summer and autumn.Precipitation in the Huaibei Plain is mainly concentrated from June to September,accounting for more than 60%of the total annual rainfall.Precipitation distribution in the Huaibei Plain is uneven with significant interannual variation.Due to low soil permeability,the Huaibei Plain is prone to flooding during heavy rainfall.In addition,the terrain in this area is flat with no water storage carriers.Therefore,rivers and ditches are the main surface water carriers in this area.Drought is prone to occurring when the area encounters little precipitation.The Huaibei Plain is representative of regions with alternating drought and flood events.
2.2.Sihu Basin with waterlogged region
The Sihu Basin is located in the middle Jianghan Plain in Hubei Province,within the longitude range of 112°E to 114°05′E and a latitude range of 29°21′N to 31°N(Fig.2).It is an important agricultural production base in Hubei Province.With a subtropical humid monsoon climate,the basin has four distinct seasons and abundant precipitation.Precipitation in this area from April to September accounts for approximately 70%of the total annual rainfall.The Sihu Basin has sufficient water resources(Chen et al.,1999).Floods often occur due to concentrated incoming water and precipitation.Waterlogging is a major threat to agricultural production in this area due to the low-lying terrain,poor drainage,and weak soil permeability.The Sihu Basin has more than 900 km2of waterlogged arable land(Ou et al.,2008).
2.3.Sentinel-1 images and image preprocessing
Sentinel-1 has an all-day and all-weather radar imaging system,composed of Sentinel-1A and Sentinel-1B.The satellite is equipped with a C-band SAR and has four imaging modes:strip map,interferometric wide swath,extra wide swath,and wave mode(Table 1).A single Sentinel-1 satellite has a short revisit period of 12 d,with 6 d for the system with Sentinel-1A and Sentinel-1B,respectively.The Sentinel-1 images selected in this study were polarized in the vertical transmit/vertical receive(VV)mode and imaged in the interferometric wide swath mode.Due to the large span of the study areas,the images of flood disasters consisted of left and right images.For the Huaibei Plain,eight images from the flooding seasons of 2017,2018,and 2019 and six images from the flooding season of 2020 were selected for flood monitoring.For the Sihu Basin,six images from the flooding season of 2016;eight images from the flooding seasons of 2017,2018,and 2019;and four images from the flooding season of 2020 were extracted for local flood monitoring.

Fig.2.Geographical location of Sihu Basin.

Table 1 Sentinel-1 imaging modes and parameters.
Satellite image preprocessing is essential because the original images contain errors arising from noise,radiation,and terrain fluctuations.The procedures for satellite image preprocessing in this study are as follows:
(1)Radiometric calibration:the backscattering intensity information received by the sensor was converted into the backscattering coefficient of ground objects(Du et al.,2016).
(2)Multiview processing:the image quality was improved without changing the resolution by increasing the signal-tonoise ratio of the image(Lei et al.,2002).
(3)Speckle filtering:the defects caused by the coherent imaging principle of SAR were removed.
(4)Geometric correction:the deformation in the ground features of the image was eliminated.
(5)Logarithmic processing:the differences in the backscattering coefficients for different objects were enlarged.
(6)Image cropping.
3.Methods
SAR can record the backscattering intensity by sending electromagnetic waves to the ground and receiving reflected waves from ground objects.The backscattering intensities of water bodies,unflooded crops,and flooded crops have different values in SAR images(Zhang et al.,2016).This characteristic can be used to extract expanded water bodies and flooded crops.The Sentinel-1 images polarized in the VV mode were used to monitor flood disasters,and the threshold method was used to extract the expanded water bodies and flooded crops.
3.1.Extraction of expanded water bodies
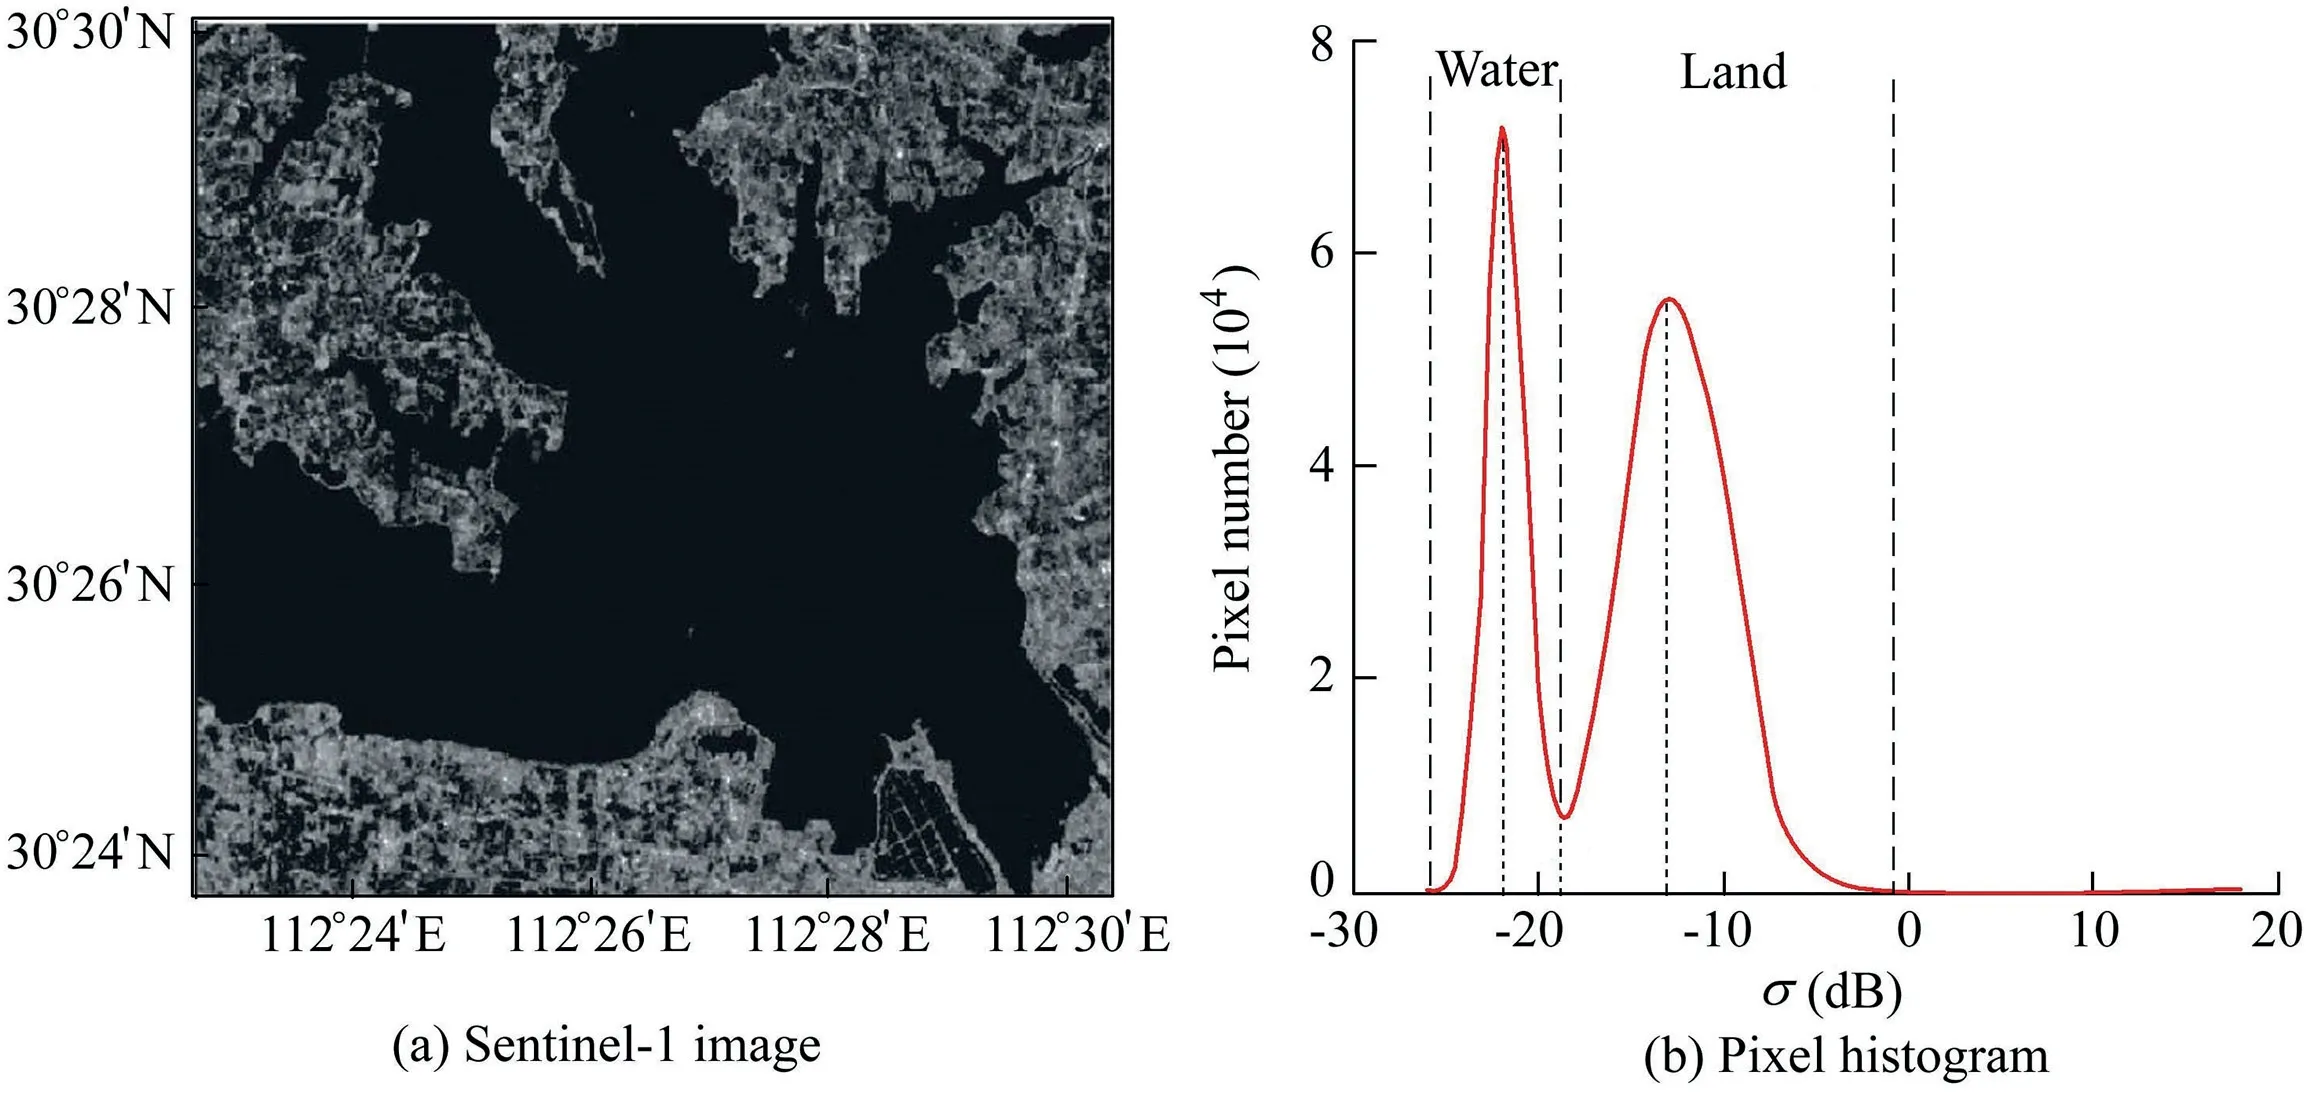
The backscattering intensity is determined by radar parameters and the complex permittivity,shape,and roughness of a surface(Sun et al.,2014).The roughness of a surface greatly influences the backscattering intensity during the water body extraction process.The surface reflection of electromagnetic waves can be divided into specular reflection,diffuse reflection,and dihedral reflection.The Sentinel-1 satellite uses side-view imaging to obtain images.Electromagnetic waves reflected by a specular surface like water can barely be received by the sensor.Therefore,the water body is a dark part in the image.Electromagnetic waves are diffusely reflected on the rough land surface and more easily received by the sensor.Therefore,land is brighter than a water body in SAR images(Fig.3(a)).
The threshold of backscattering coefficients(T1)calculated with the backscattering intensity was used to extract water bodies from images.The backscattering coefficients of each pixel in an image before and during a disaster were compared with T1to obtain the range of water bodies.The expanded water bodies were obtained by removing the water bodies in pre-disaster images from disaster images.The histogram bimodal method(Yang,2012)was used to acquire the threshold T1.Fig.3(b)shows double peaks in the pixel histogram curve.The left part represents the water body,and the right part represents land.The threshold T1can be estimated as follows:

whereσis the backscattering coefficient;f(σ)is the number of pixels corresponding toσ;S1and S2are the backscattering coefficients corresponding to the peak pixel numbers in the water part and land part of the histogram curve,respectively;and T1is the backscattering coefficient with the least number of pixels between the two peaks on the pixel histogram curve(Fig.3(b)).
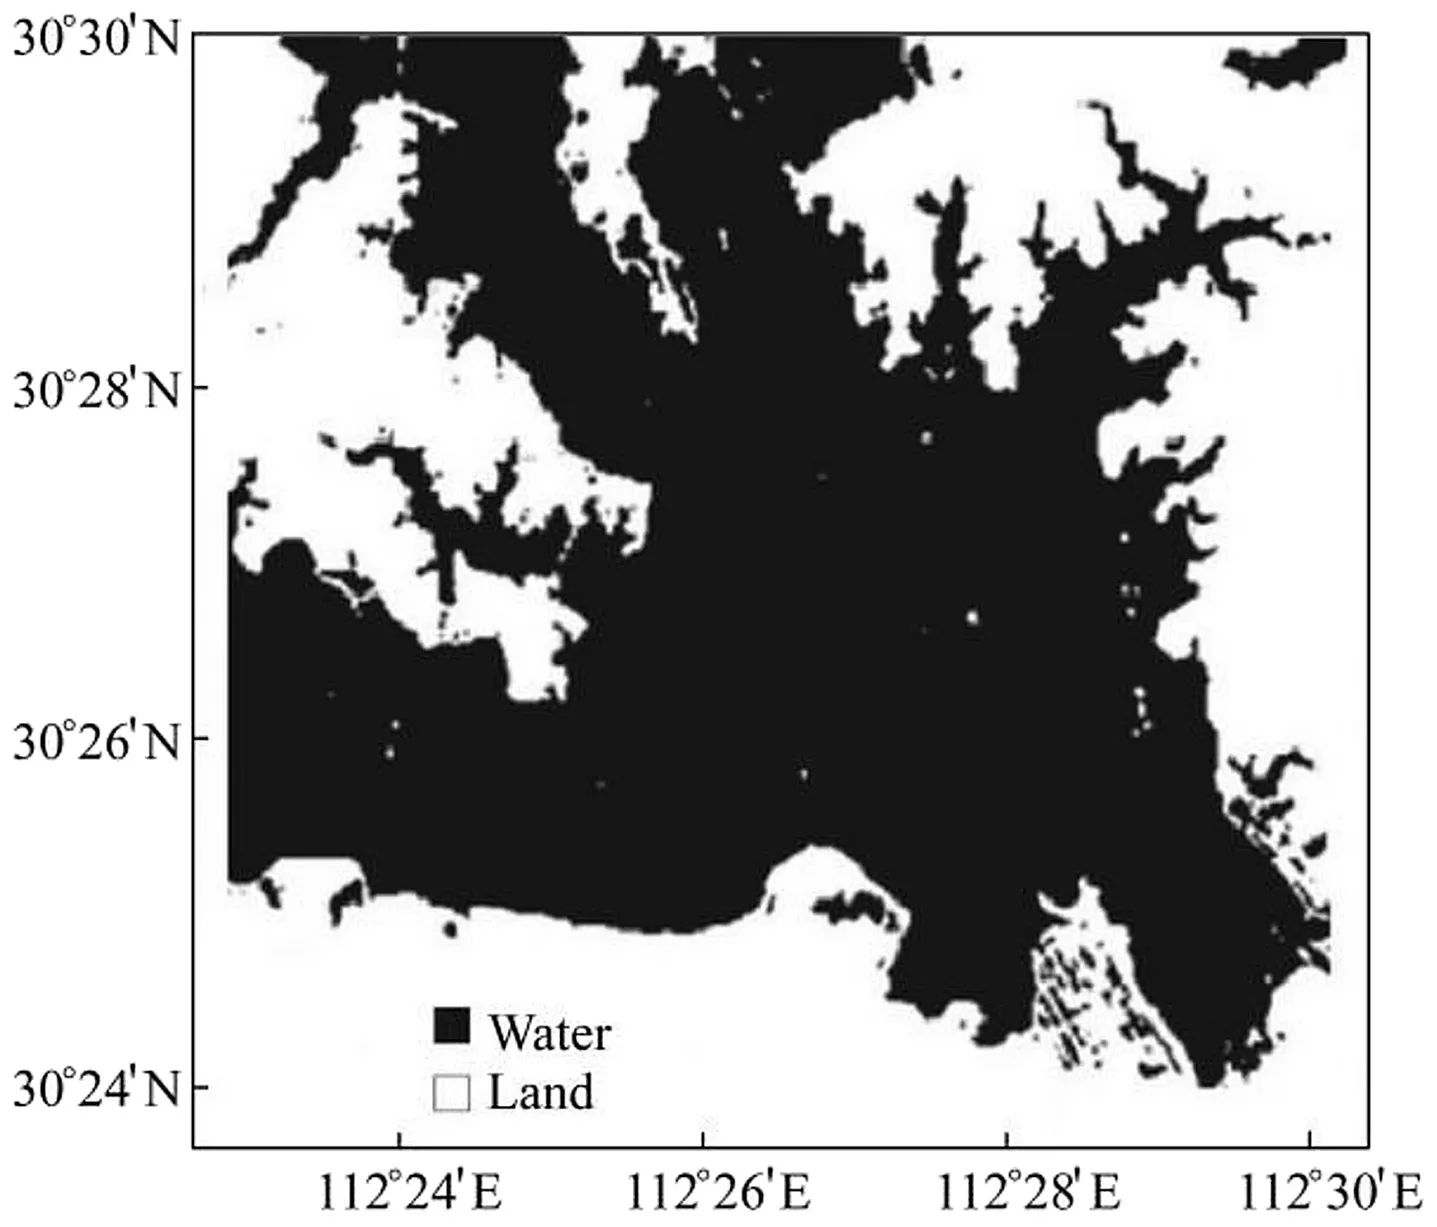
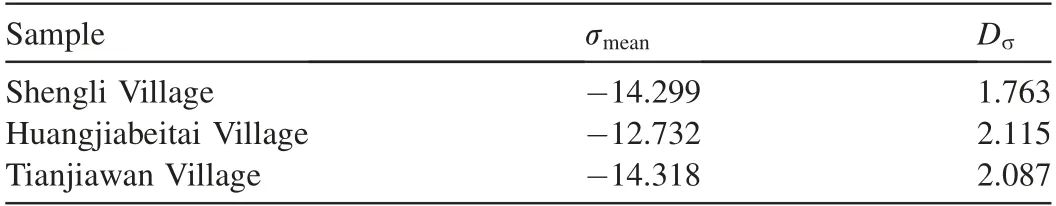
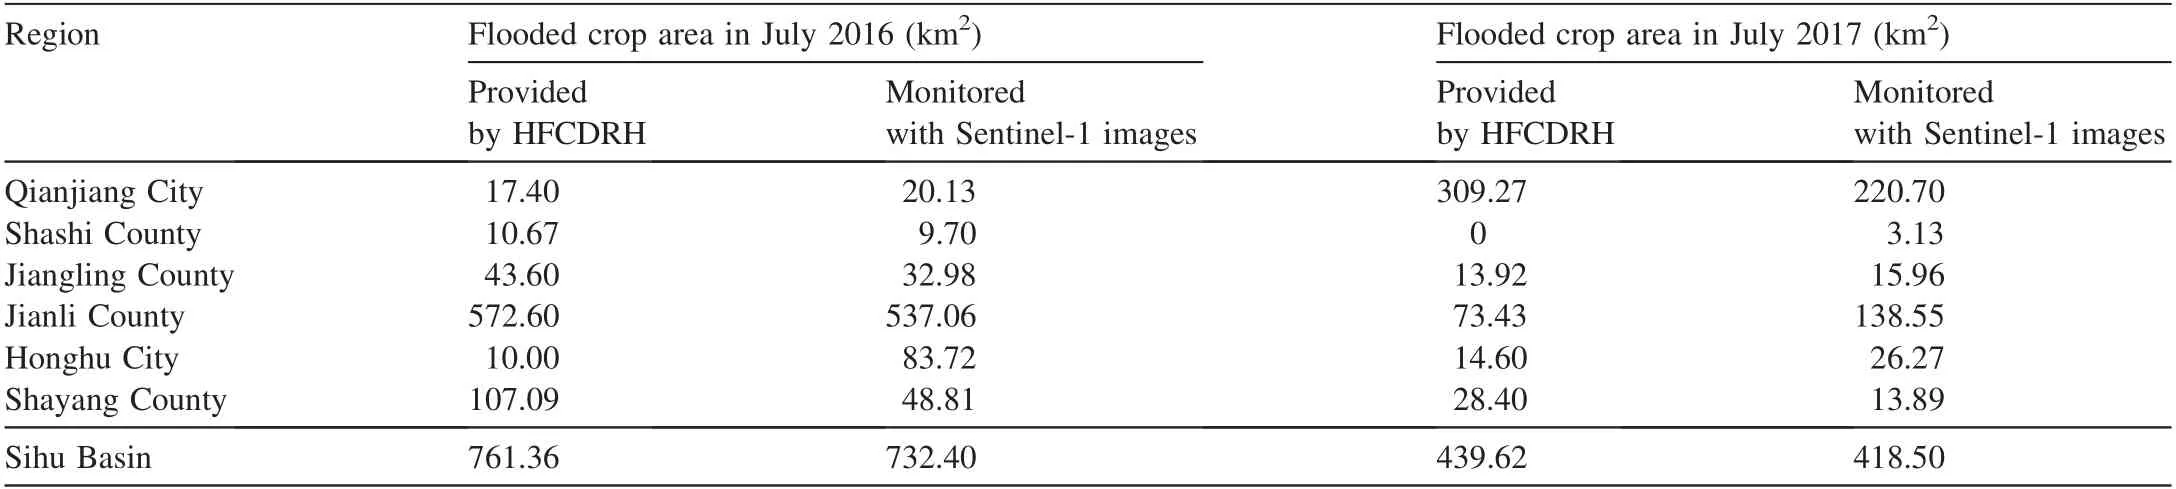
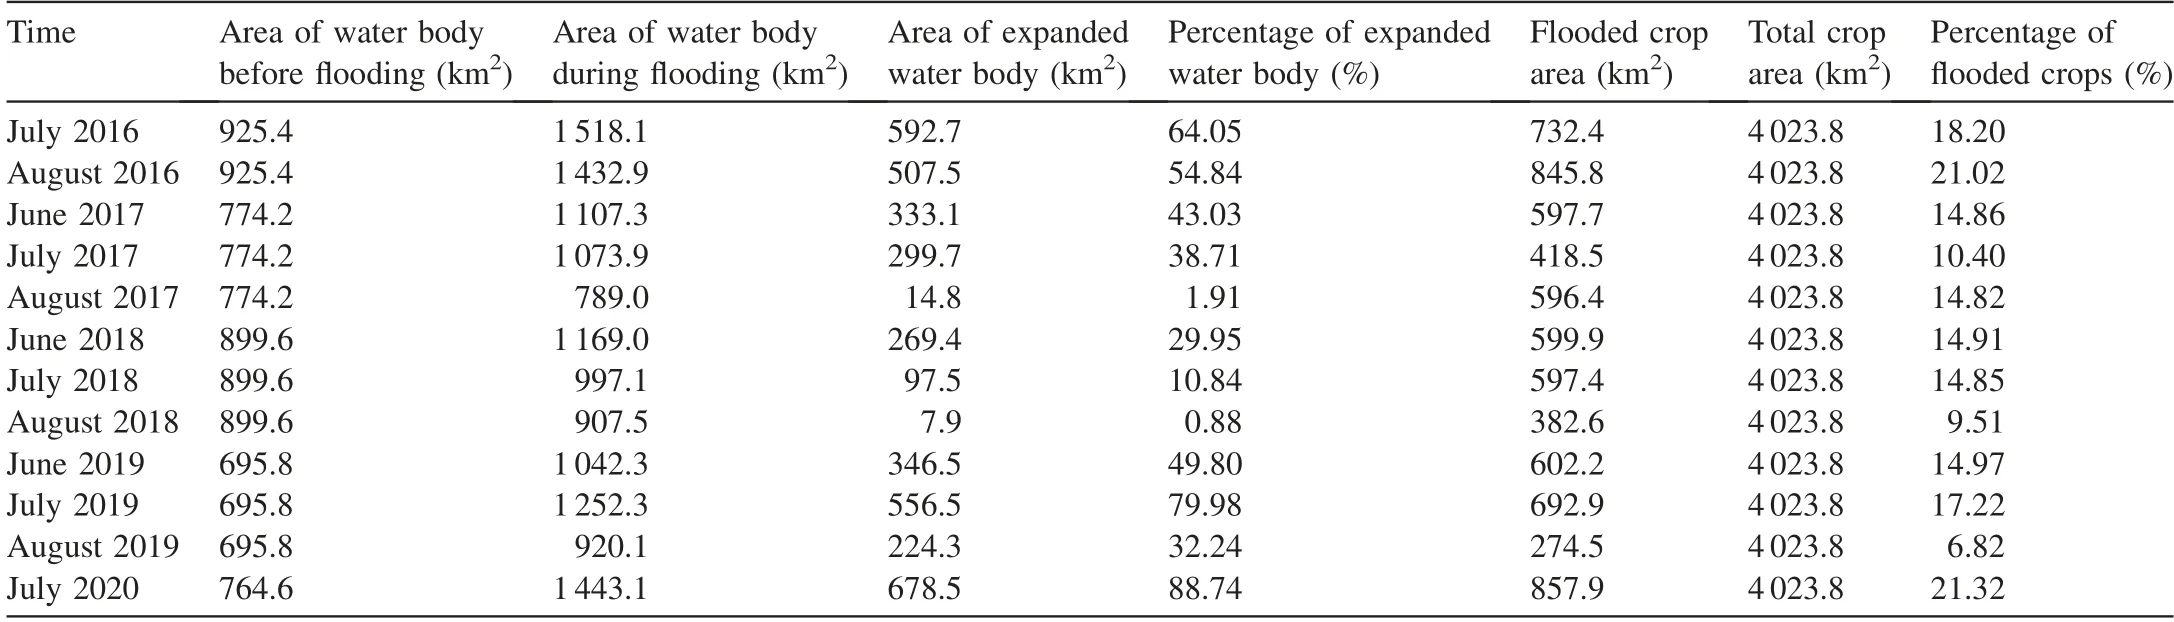
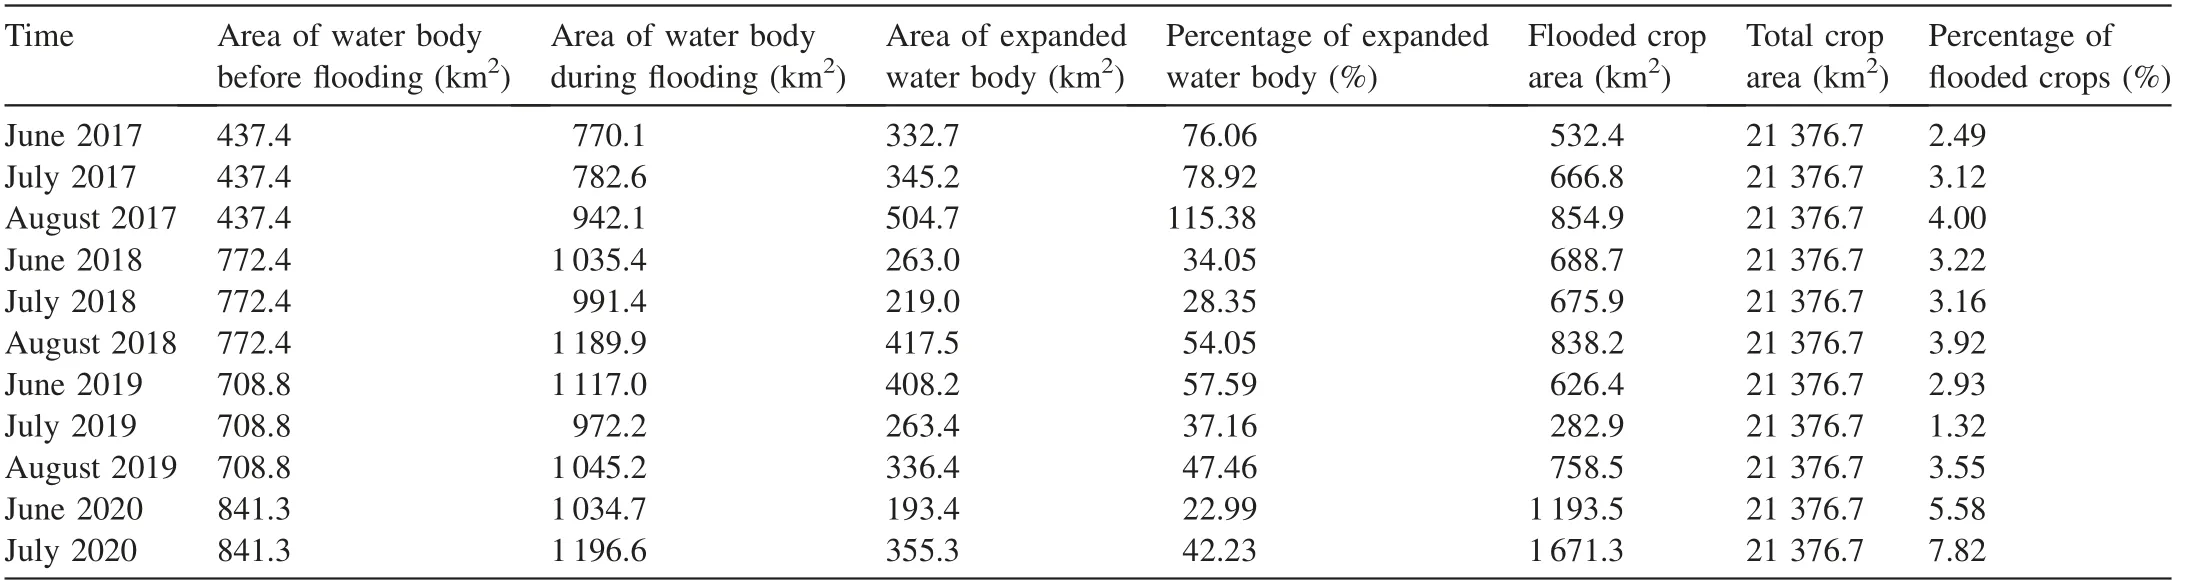
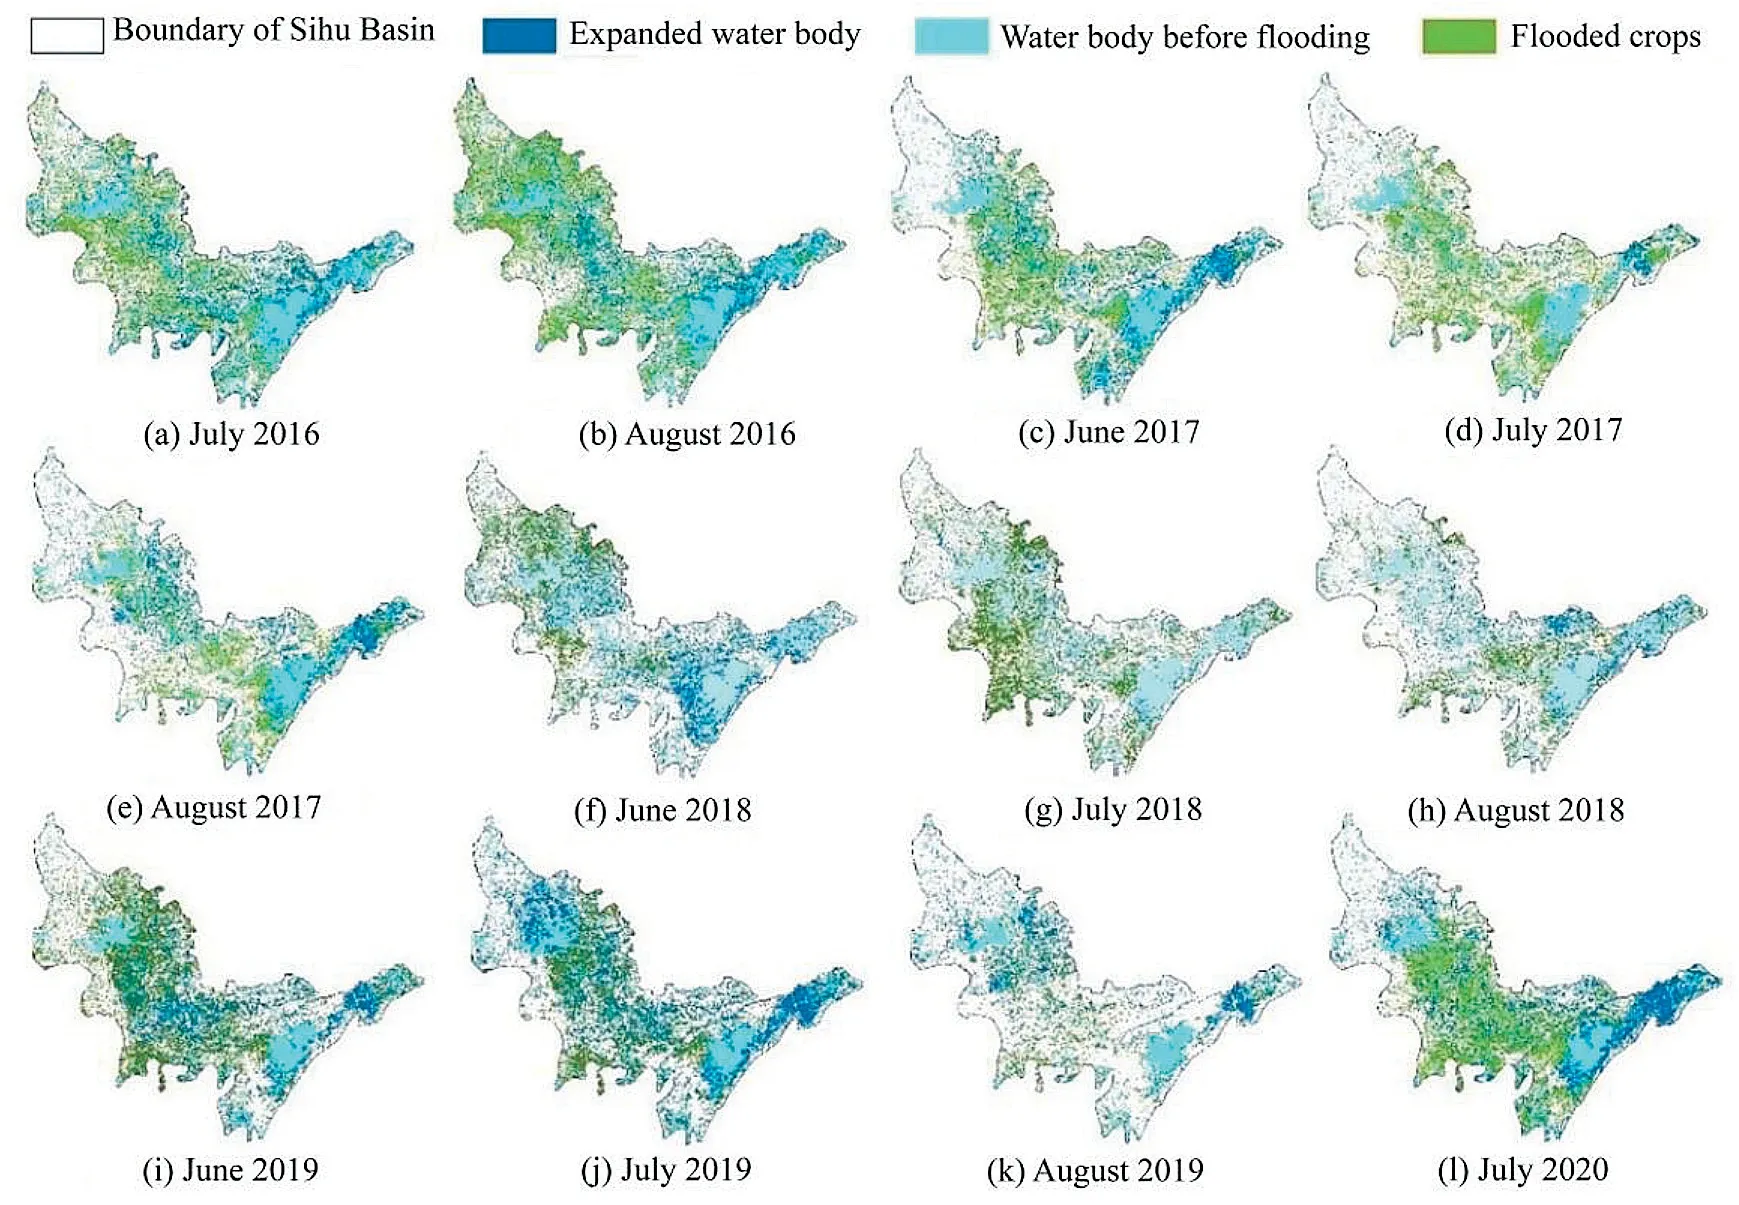
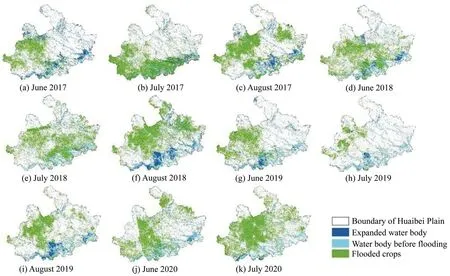
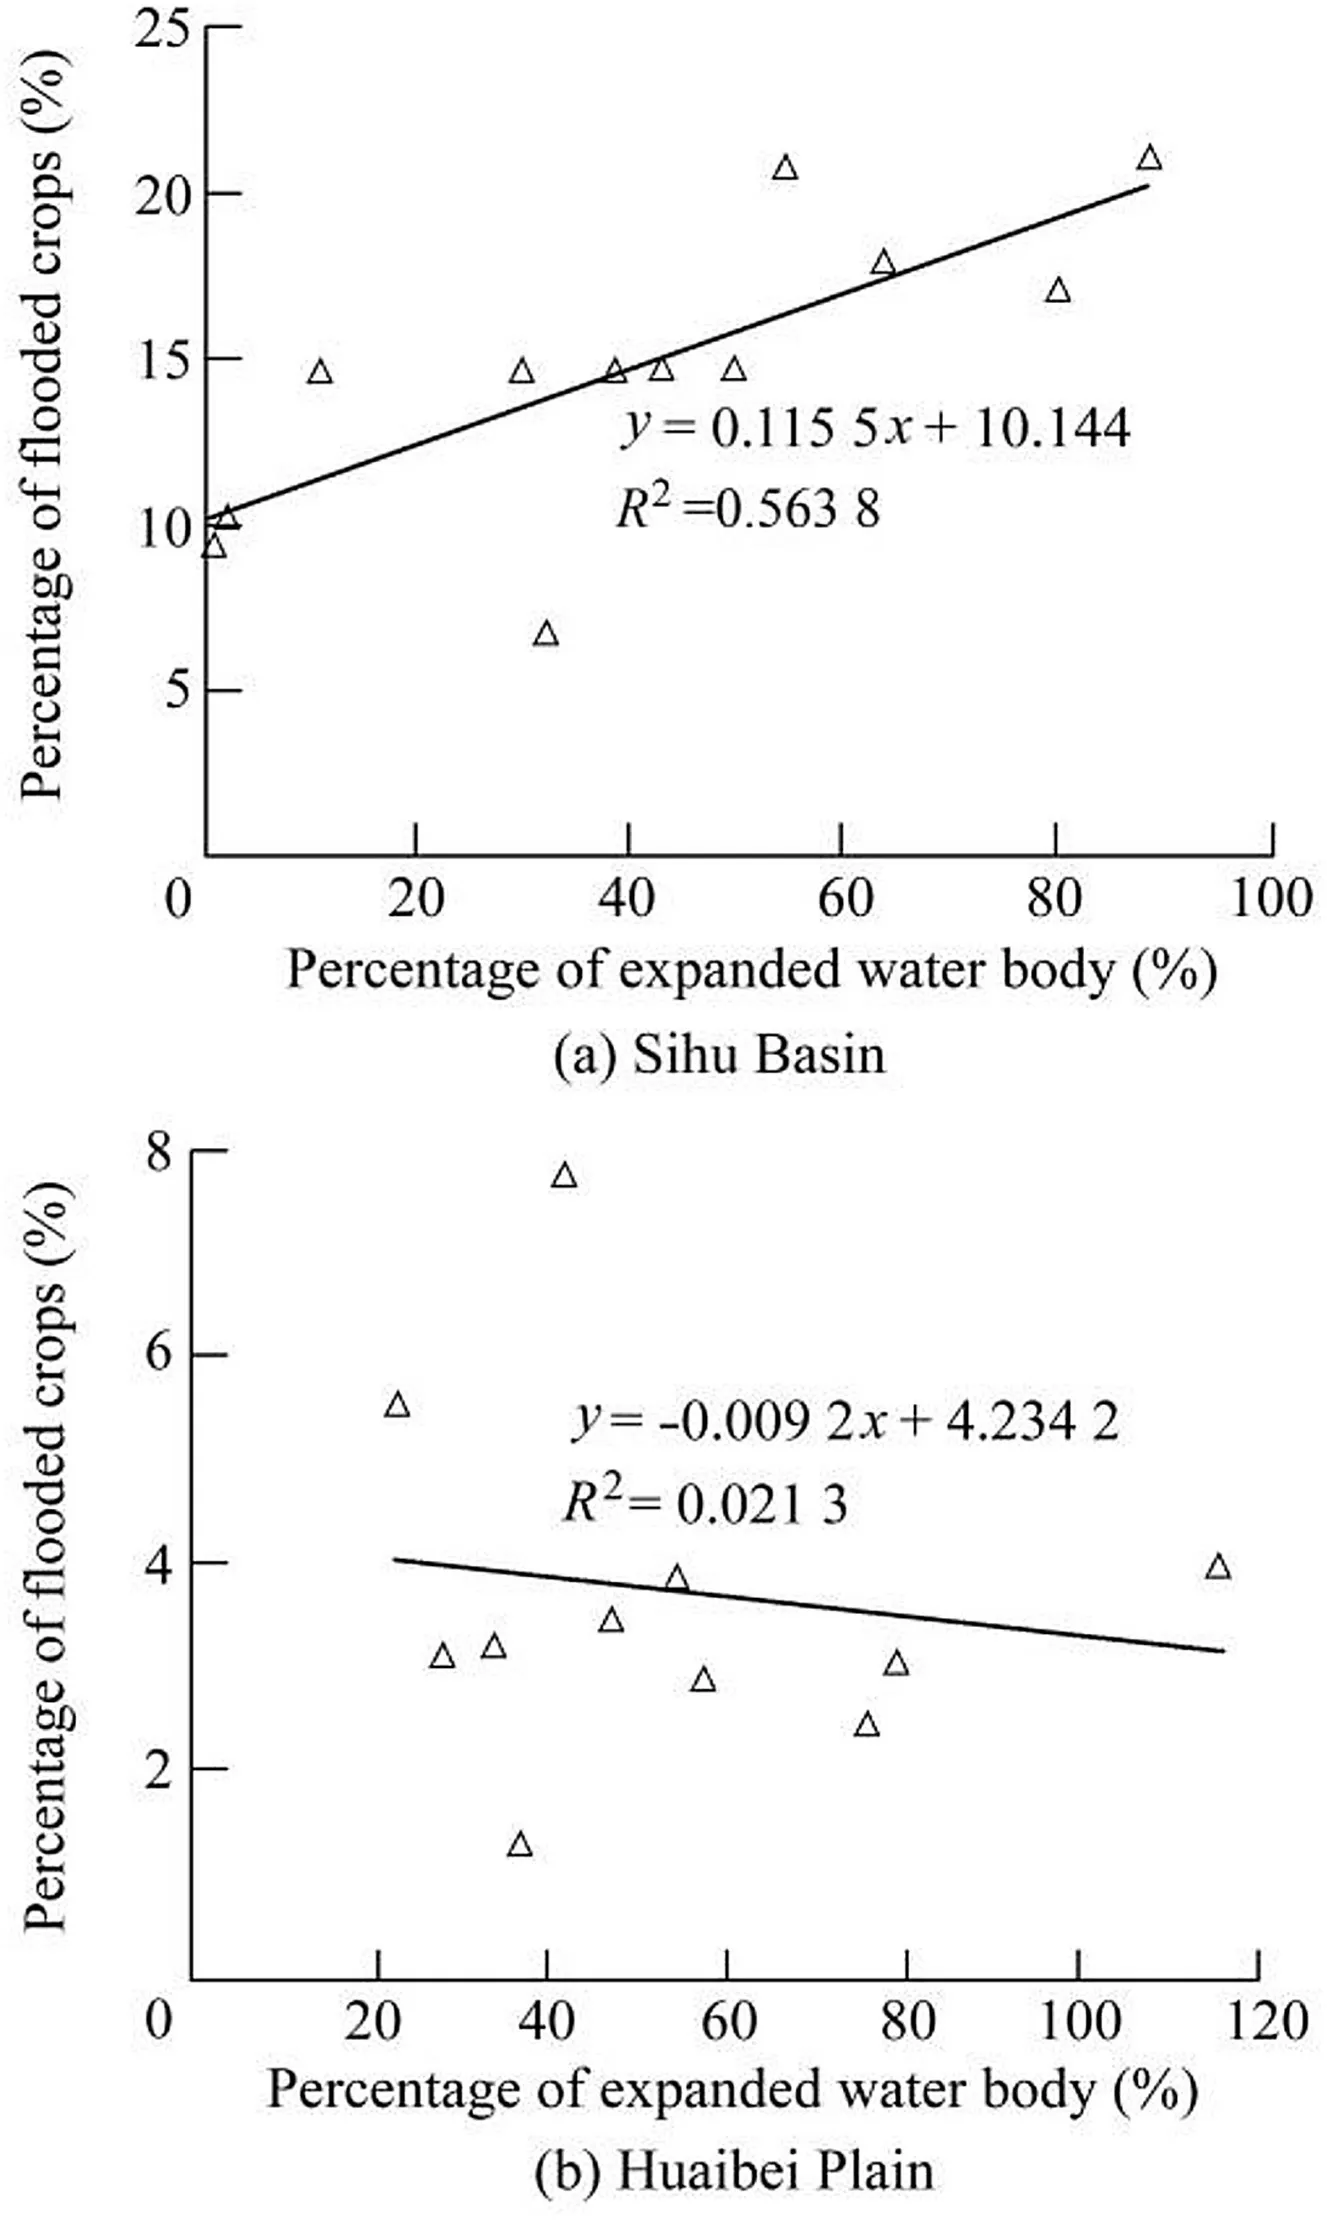
The decision tree method can be used to classify the image by means of the threshold T1:a pixel withσ Fig.3.Sentinel-1 image and histogram of water body and land pixels in Sihu Basin on July 12,2019. Fig.4.Binary graph of water body in Sihu Basin obtained with decision tree method. The backscattering coefficient of crops in SAR images tends to increase significantly when crops are flooded.The threshold T2was used to extract unflooded crop areas from the SAR image,and the threshold T3was adopted for extraction of flooded crop areas.The backscattering coefficient of each pixel in the image before flooding was compared with the threshold T2to identify crop and urban areas.The SAR image before flooding was subtracted from the image with flooding to obtain a new image.Subsequently,the crop and urban areas in the new image were cropped out,and the backscattering coefficients of the pixels were compared with the threshold T3to identify flooded crop areas.The histogram analysis method was used to estimate these two thresholds of backscattering coefficients(T2and T3). 3.2.1.Characteristics of backscattering from flooded crops The formula of Hess et al.(1990)for the backscattering coefficient of trees can be used to estimate the backscattering coefficient of crops.The total backscattering coefficient of crops(σT)is expressed as whereαcis the transmittance of double canopy,σcis the backscattering coefficient of canopy,σsis the backscattering coefficient of the ground surface under crop canopy,σdis the backscattering coefficient of the crop stem,andσmis the multiple scattering coefficient.When flood disasters occur,the ground under crop canopy is covered by water,and incident waves are reflected by water and crops after passing through the canopy.More echoes return in the direction parallel with the incoming wave.Thus,sensors are more likely to receive echoes.σdandσmare enhanced significantly in comparison with the values for unflooded crops.In this case,the backscattering coefficients of flooded crops tend to increase,and the area of flooded crops is brighter in Sentinel-1 images.Fig.5 demonstrates an example of three surface types in a Sentinel-1 image with flooding.As shown in Fig.5,the water body is in black,and the brightness of flooded crops is significantly higher than that of unflooded crops.These characteristics were used to estimate the thresholds to extract the range of flooded crops. Fig.5.Surface types in Sentinel-1 image with flooding. 3.2.2.Determination of threshold T2 The Sihu Basin was used as an example to illustrate the method for calculating thresholds,and the same method was used in the Huaibei Plain.It is necessary to choose representative farmlands to reflect the diversity of the study area,and there should be large spans of area between selected samples.Farmlands in the Shengli,Huangjiabeitai,and Tianjiawan villages in the Sihu Basin were selected as the samples to obtain crop thresholds(Fig.2).They are located in the western,central,and eastern parts of the Sihu Basin,respectively,with sufficient area in between. After sample selection,the corresponding areas in the Sentinel-1 image were identified according to the geographical information of the samples,and the histogram analysis method was used to calculate the mean backscattering coefficient(σmean)and standard deviation(Dσ)of backscattering coefficients for each sample(Table 2). Table 2Histogram statistics of farmland samples in Sihu Basin. The standard deviation was subtracted from the mean backscattering coefficient of each sample,and its minimum value was considered the threshold T2: The backscattering coefficient of bare land is smaller than those of crop and urban areas.The threshold T2in the decision tree method was used to distinguish crop and urban regions from bare land:a pixel withσ 3.2.3.Determination of threshold T3 To extract the flooded crop area,a new image was obtained by subtracting the SAR image before the flood disaster from that during the flood disaster.The backscattering coefficient of the new image(σn)can be expressed as follows: whereσpdandσbdare the backscattering coefficients during and before the flood disaster,respectively.The brightness of crop areas increases in the Sentinel-1 image when a flood disaster occurs.The backscattering coefficients of crop areas have different increase magnitudes in different bands when crops are flooded,and the increase magnitude in C-band SAR is approximately 6.9 dB(Kundu et al.,2015).The highbrightness area in the new image was selected as the sample,and the histogram analysis method was used to obtain the mean and standard deviation of the backscattering coefficient for each sample.The standard deviation was subtracted from the mean backscattering coefficient of each sample,and its minimum value was considered the threshold T3: whereσ′meanis the mean backscattering coefficient of each sample in the new image,and D′σis the standard deviation of the backscattering coefficients of each sample in the new image. Although the area identified by T2included crop and urban areas,the backscattering coefficient of crop area increased significantly with flooding.The increment in the backscattering coefficient of crop area was greater than the threshold T3,while the change in the backscattering coefficient of urban area was smaller than the threshold T3when the area was flooded.The threshold T3was used to distinguish the flooded crop area from the unflooded crop and urban areas:a pixel withσn Flood disaster maps of the Sihu Basin from 2016 to 2020 and the Huaibei Plain from 2017 to 2020 were derived from Sentinel-1 images.To verify the feasibility of this method for flood disaster monitoring,the derived flooded crop data in this study were compared with the flood disaster data provided by the Hubei Flood Control and Drought Relief Headquarters(HFCDRH).Given that statistical data of flood disasters in the Huaibei Plain were not available,only the satellite-based flood monitoring results in the Sihu Basin were verified.Table 3 compares the inundated crop areas provided by HFCDRH with those obtained with Sentinel-1 images in the Sihu Basin in July 2016 and July 2017,respectively.The accuracy of flood monitoring was quantified by dividing the Sentinel-1 image-monitored areas of inundated crops by the HFCDRH's results.Table 3 shows that the HFCDRH statistical area of flooded crops in the Sihu Basin in July 2016 was 761.36 km2,and the satellite-extracted area was 732.40 km2.Therefore,the accuracy of satellite-based flood monitoring in July 2016 was 96.20%.In terms of flood monitoring in July 2017,the HFCDRH statistical area of flooded crops was 439.62 km2,and the satellite-extracted inundated crop area was 418.50 km2,with an accuracy of 95.19%.These results indicated that the Sentinel-1 image-based monitoring method for flooded crops was appropriate in the Sihu Basin.However,certain deviations existed in the extracted flooded crop area in some counties.The main reason was the removal of small classified patches in the post-classification process,thereby leading to the errors in flooded crop areas when the monitored region was not expansive. 4.2.1.Spatial features Figs.6 and 7 show flood disaster maps of the Sihu Basin from 2016 to 2020 and the Huaibei Plain from 2017 to 2020,respectively.Due to the lack of Sentinel-1 images,there are no flood disaster maps of the Sihu Basin for June 2016 and June 2020 or of the Huaibei Plain from June 2016 to August 2016.Tables 4 and 5 show the statistics of flooded areas in the Sihu Basin and Huaibei Plain,respectively. Table 3 Comparison of flooded crop areas provided by HFCDRH and those obtained with Sentinel-1 images in Sihu Basin. Table 4 Statistics of flooded areas in Sihu Basin. Table 5 Statistics of flooded areas in Huaibei Plain. According to the results of flood disaster monitoring,the expanded water body in the Sihu Basin was mainly located near Honghu Lake when flood disasters occurred(Fig.6).When this region encountered heavy rains,the water level of ponds rose,and the area of water body increased significantly(Tao,2004).Flooded crops were concentrated in the central regions between Changhu Lake and Honghu Lake,because these regions were distant from drainage facilities.Thus,the ponding water in the crop area could not be removed in atimely manner.Waterlogging in the crop area had a strong effect on local agricultural production. Fig.6.Flood disaster maps for Sihu Basin. The main reasons for water body expansion in the Huaibei Plain were the increased river flow during the rainy season and the accumulated ponding water in low-lying regions after heavy rain.The main flooded regions were in the western and southern parts of Huaibei Plain(Fig.7). Fig.7.Flood disaster maps for Huaibei Plain. As shown in Tables 4 and 5,the highest percentages of water body expansion were 88.74%in the Sihu Basin in July 2020,and 115.38%in the Huaibei Plain.The water body expansion in the Huaibei Plain was more significant than that in the Sihu Basin.This was because most rivers in the Huaibei Plain were in a dry state before the rainy season,and river runoff increased significantly after heavy rainfall.The average percentage of flooded crop area in the Sihu Basin was 14.91%,much higher than that in the Huaibei Plain(3.74%).The flood disaster maps of the Sihu Basin showed that the entire basin was affected by flooding(Fig.6).Qianjiang City,Honghu City,Jianli County,Jiangling County,and other cities or counties were all flooded.Flood disasters in the Huaibei Plain were regional disasters,and Guoyang,Mengcheng,Lixin,Taihe,and Linquan counties and other areas were affected by floods.However,there was no large-scale flooding in the Huaibei Plain,and the disaster density was lower than that in the Sihu Basin. 4.2.2.Temporal features As shown in Table 4,the Sihu Basin suffered severe floods in 2016 and 2020.The area of expanded water body was 592.7 km2,and the area of flooded crops was 732.4 km2in July 2016(Fig.6(a)).According to the precipitation records in the Sihu Basin from June to August 2016,Qianjiang City had maximum 1-d,3-d,and 7-d precipitation amounts of 113.5 mm,114.5 mm,and 182.5 mm,respectively;and Shayang County had maximum 1-d,3-d,and 7-d precipitation amounts of 147 mm,186 mm,and 223.5 mm,respectively.In July 2020,the water body area in the Sihu Basin increased by 678.5 km2,and the area of flooded crops was 857.9 km2(Fig.6(l)).According to statistics from the Hubei Meteorological Bureau,Hubei Province suffered from heavy rainstorms in July,and the maximum daily precipitation was 191.6 mm. In July 2020,the area of flooded crops in the Huaibei Plain reached 1 671.3 km2(Table 5).According to the precipitation records provided by the Anhui Meteorological Bureau for the same period,the rainfall depth exceeded 50 mm at 705 weather stations,100 mm at 379 stations,and 250 mm at 48 stations in Anhui Province,and the maximum rainfall depth reached 411.7 mm.The occurrence time of the rainstorms coincided with that of the flood disasters.This indicated that flooding was in a close connection with rainstorms in the Huaibei Plain,consistent with that of Tao(2004). A special feature in the Sihu Basin was that the expanded water body was especially smaller than the area of flooded crops in August 2017 and August 2018(Table 4).The main reason for the lesser water body expansion was the rise of the water level in lakes and fishponds.Evaporation and runoff could effectively restore water areas.However,due to the lowlying terrain,poor drainage,and weak soil permeability,it was difficult to drain water from crop land. In these two regions,flood disasters occurred in different months.The average flooded crop areas in the Sihu Basin were 599.93 km2and 659.82 km2in June and July,respectively,which were larger than that in August(524.83 km2).This is because the Sihu Basin was prone to flooding in June and July,and floods gradually receded in August.In the Huaibei Plain,flood disasters occurred later,and the most severe occurred in August.The average flooded crop area in August was 817.20 km2,which was much larger than that in June(615.83 km2)and July(541.87 km2). The interannual variability of flood disasters differed in these two regions.Comparison of flooded crop areas in the same month of different years demonstrated that the flooded crop area for each flood disaster in the Sihu Basin remained relatively consistent.The flooded crop areas were 597.7 km2,599.9 km2,and 602.2 km2in June of 2017,2018,and 2019,respectively(Fig.6(c),(f),and(i)).The flooded crop areas in the Huaibei Plain varied greatly in different years.For example,they were 282.9 km2and 1 671.3 km2in July of 2019 and 2020,respectively(Fig.7(h)and(k)),with a difference of 1 388.4 km2.This indicated that the Huaibei Plain had a high interannual variability in floods and droughts. In this study,the thresholds of the backscattering coefficient in the decision tree method were calculated with the histogram analysis method,and flood disaster monitoring was conducted using the threshold method based on Sentinel-1 data.The accuracies of the monitored flooded crop area were 96.20%in 2016 and 95.19%in 2017 in the Sihu Basin.Li et al.(2013)monitored flood disasters around Poyang and Dongting lakes,and their average accuracy of flooded crop area was 94.60%.This indicates that the method in this study met the accuracy requirement of flood monitoring.In this study,the flood monitoring maps for the Huaibei Plain were compared with disaster maps from Gu et al.(2011).It was found that the monitored flooded area was consistent with that of Gu et al.(2011). This study analyzed the correlation between the percentages of expanded water body and flooded crops in the Sihu Basin and Huaibei Plain.As shown in Fig.8,the percentages of expanded water body and flooded crops had a significant positive correlation in the Sihu Basin,with a determination coefficient(R2)of 0.563 8.However,the correlation was not significant in the Huaibei Plain,with an R2value of 0.021 3.The Sihu Basin had many lakes and ponds,leading to a high capacity of impoundment.When water bodies expanded,the water area and flooded crop area experienced rainstorms at the same time,resulting in a high correlation between the percentages of expanded water body and flooded crops.The Huaibei Plain had less expanded water area,and its capacity of impoundment was lower than that in the Sihu Basin.The percentage of expanded water body was unstable and had a low correlation with that of flooded crops in the Huaibei Plain. Fig.8.Correlation between percentages of expanded water body and flooded crops. Our conclusions are as follows: (1)Sentinel-1 satellite images,with their high spatial resolution and a short revisit period,are less affected by clouds and light,and they are appropriate for flood disaster monitoring in the Sihu Basin and Huaibei Plain. (2)The accuracies of satellite-monitored flooded crop area in the Sihu Basin were 96.20%and 95.19%in 2016 and 2017,respectively.Accuracy depended on the selected threshold.Verification of the satellite-monitored flooded crop area shows that this method is suitable for extraction of water bodies and flooded crops during floods. (3)Flood disasters in the two study areas showed different spatiotemporal distributions.Flood disasters in the Sihu Basin mostly occurred in June and July,whereas flood disasters in the Huaibei Plain mostly occurred in August.The interannual variability of flood disasters in the Sihu Basin was not significant,and the flooded crop areas were 597.7 km2,599.9 km2,and 602.2 km2in June of 2017,2018,and 2019,respectively.Flood disasters in the Huaibei Plain had a high interannual variability,and the flooded crop areas were 282.9 km2and 1 671.3 km2in July of 2019 and 2020,respectively.Flood disasters in the Sihu Basin were widespread,and the mean annual percentage of the flooded crop area was 14.91%.The regions between Changhu and Honghu lakes were severely affected.Flood disasters in the Huaibei Plain were scattered disasters,and the mean annual percentage of flooded crop area was 3.74%. Declaration of competing interest The authors declare no conflicts of interest.3.2.Extraction of flooded crop areas


4.Results and discussion
4.1.Validation of satellite-based flood disaster monitoring
4.2.Spatiotemporal characteristics of flood disasters in Sihu Basin and Huaibei Plain
4.3.Discussion
5.Conclusions
 Water Science and Engineering2021年2期