
Chromosome-scale genome assembly of brownspotted flathead Platycephalus sp.1 provides insights into demersal adaptation in flathead fish
2021-10-18 00:16Sheng-YongXu,Zhi-ChuangLu,Bin-BinCao等
Zoological Research 2021年5期
Flatheads are valuable commercial fish species endemic to the Indo-West Pacific. Due to their economic value and unique biological traits, such as metamorphosis and camouflage, they serve as ideal marine organisms for studies on demersal adaptation and evolution. The brown-spotted flathead(Platycephalussp.1) is the most widely distributed in the northwestern Pacific. Despite the lack of a valid scientific name, it has been long recognized and exploited in the marine fisheries of China, Japan, and Korea. In the current study, we applied Illumina, PacBio, and Hi-C sequencing to assemble a chromosome-scale genome for this species. The assembled genome was 660.63 Mb long with a scaffold N50 of 28.65 Mb and 100% of the contigs were anchored onto 24 chromosomes. We predicted 22 743 protein-coding genes,94.8% of which were functionally annotated. Comparative genomic analyses suggested thatPlatycephalussp.1 diverged from its common ancestor withGasterosteus aculeatus~88.4 million years ago. The expanded gene families were significantly enriched in immune, biosynthetic, and metabolic pathways. Furthermore, three shared Gene Ontology (GO)terms and 377 common positively selected genes were identified between flathead and flatfish species, suggesting that these genes may contribute to demersal adaptation in flatheads. The assembled genomic data provide a valuable molecular resource for further research on the biological and adaptive evolution of flathead species.
Flathead fish (family Platycephalidae) are endemic demersal carnivores distributed in the Indo-West Pacific. The genusPlatycephalusis the most speciose in the Platycephalidae family (Imamura, 2015; Nakabo, 2002). Given their high-quality flesh and large body size, flatheads are commercially valuable and among the first fish to be targeted by fisheries in Indo-Pacific regions, including Japan, China,and Australia (Puckridge et al., 2013). In addition, flatheads are camouflage masters and ambush predators with symmetrical body-axis metamorphosis (Hyndes et al., 1992),similar to flatfish species (Shao et al., 2017). Flatheads are hypothesized to exhibit protandrous hermaphroditism and sexreversal (i.e., sex change from male to female) (Shinomiya et al., 2003). These biological characteristics make flatheads valuable models for investigating the molecular mechanisms underlying demersal adaptation and evolution, as well as innovations in sex determination and growth in teleosts. Highquality genome assemblies should benefit the abovementioned research fields as well as our understanding of the adaptive evolution of flathead species.
The brown-spotted flathead,Platycephalussp.1 (sensu Nakabo, 2002), is a widely distributed species in the northwestern Pacific (Nakabo, 2002). Despite the lack of a valid scientific name,Platycephalussp.1 has long been recognized in Japan as “Yoshino-gochi” (Nakabo, 2002).Recently, our research team reportedPlatycephalussp.1 as a new record species in the coastal waters of China, with several distinct morphological characters, including dark brown spots scattered on head and body, lateral line scales 83 to 99, and no yellow blotch on caudal fin (Qin et al., 2013).Considering the contributions of Japanese ichthyologists, we herein recommend “Platycephalus yoshinoi” as the scientific name of this species, in reference to its Japanese name.However, the lack of genomic resources and insufficient exploitation of genetic information have limited study on the evolutionary biology, fisheries management, and conservation of this species. Thus, we performed a chromosome-scale genome assembly ofPlatycephalussp.1 using PacBio,Illumina, and Hi-C sequencing technologies.
An adult malePlatycephalussp.1 (Figure 1A) captured from the littoral waters of Qingdao, China (E120.275°, N36.109°) in November 2019, was used for genome sequencing. Muscle tissue below the dorsal fin was collected for DNA extraction using the cetyltrimethylammonium bromide (CTAB) method.DNA quality and concentration were measured using agarose gel electrophoresis (1%), pulse field gel electrophoresis (1%),and Qubit 3.0 (Thermo Fisher Scientific, USA). To facilitate prediction of protein-coding genes, we extracted total RNA from seven flathead tissues, including muscle, gill, gonad,brain, spleen, liver, and eye, using TRIzol reagent (Invitrogen,USA) according to the manufacturer’s instructions. RNA integrity and quantity were evaluated using an Agilent 2100 Bioanalyzer (Agilent, USA). Seven RNA-seq libraries were prepared using a NEBNext Ultra RNA Library Prep Kit for Illumina (New England BioLabs, USA) following the manufacturer’s protocols, and were then sequenced on the Illumina Novaseq6000 sequencing platform (Illumina, USA).
Illumina short-insert (350 bp) libraries were prepared and sequenced on the Illumina Novaseq6000 platform (Illumina,USA). In total, 83.91 Gb of Illumina short-read sequencing data were generated (Supplementary Table S1).K-mer analysis was conducted using Jellyfish v2.2.10 (Marçais &Kingsford, 2011). Thekvalue was set to 17 and genome size was estimated to be 674.96 Mb, with a heterozygosity ratio of 0.77% and repeat sequence ratio of 29.23%. One 20 kb single-molecule real-time (SMRT) sequencing bell library was constructed, and long-read sequencing was performed using the PacBio Sequel II sequencer (Pacific Biosciences, USA).The PacBio sequencing platform generated 138.12 Gb of high-quality long-read sequencing data, with a mean subread length of 20 099 bp and average read length of 31 100 bp(Supplementary Table S1). The PacBio long reads were used forde novogenome assembly with Wtdbg2 (Ruan & Li, 2020)and draft contigs were corrected using Arrow v2.2.1 (Chin et al., 2013) with the same PacBio dataset. Finally, the PacBio sequencing data resulted in a 660.63 Mb assembly with 60 contigs and contig N50 of 23.07 Mb. By comparison, our result is the most contiguous assembly of reported species in the order Scorpaeniformes (Supplementary Table S2). Illumina short reads from the same individual were further used to evaluate the quality of the initial genome assembly using BWA v0.7.10 (Li & Durbin, 2010) and assembly completeness was also evaluated using Benchmarking Universal Single-Copy Orthologs (BUSCO) v3.0.1 (Simão et al., 2015) and Core Eukaryotic Gene Mapping Approach (CEGMA) (Parra et al.,2007). Quality evaluation of the initial genome assembly showed that 97.64% of the Illumina data were successfully mapped to the assembled genome. BUSCO analysis against the actinopterygii_odb9 database found that 96.4% of the conserved single-copy orthologous genes, including 95.5%complete and 0.9% fragmented genes, were found in the genome assembly, while CEGMA identified 94.76% of the core eukaryotic genes (Supplementary Table S3).
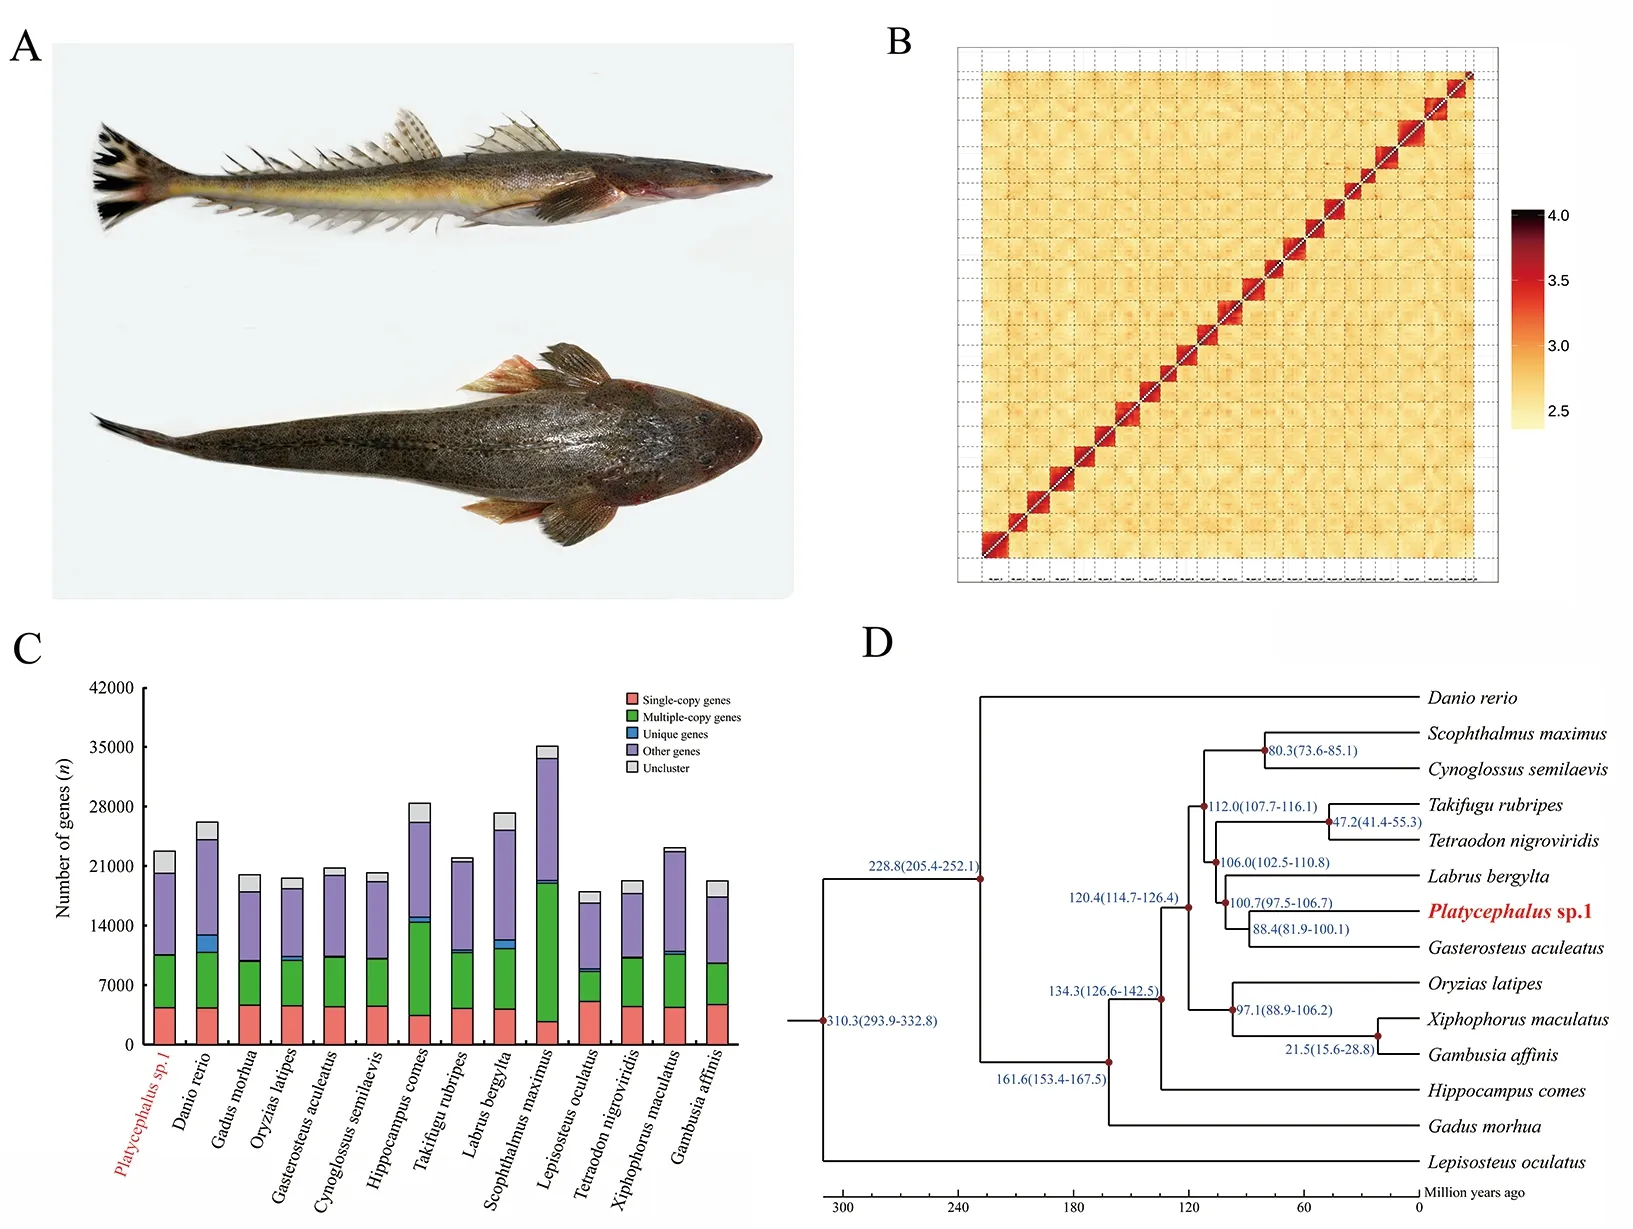
Figure 1 Genomic analyses of brown-spotted flathead Platycephalus sp.1
To obtain a chromosome-scale genome assembly, a Hi-C library was prepared following Hi-C library protocols (Rao et al., 2014) and sequenced using the Illumina Novaseq6000 sequencing platform (Illumina, USA). The Hi-C library generated 245.62 Gb of raw data, representing 364-fold coverage (Supplementary Table S1). Duplicate removal,sorting, and quality control were performed using HiC-Pro v2.8.0 (Servant et al., 2015). LAchesis (Burton et al., 2013)was used to cluster, order, and orient the contigs into a chromosome-scale assembly. Using LAchesis, 100% of the initial assembled sequences were anchored to 24 pseudochromosomes with lengths ranging from 12.68 to 35.47 Mb (Figure 1B). To the best of our knowledge, thisPlatycephalussp.1 genome is the first marine fish genome assembly with a 100% anchoring rate. Finally, the total length of the genome assembly was 660.63 Mb, and contig N50 and scaffold N50 were 23.07 Mb and 28.65 Mb, respectively(Supplementary Table S2).
Combined homology alignment andde novosearch were applied using our repeat annotation pipeline. Ade novorepetitive elements database was built by LTR_FINDER (Xu &Wang, 2007), RepeatScout (Price et al., 2005), and RepeatModeler (Hubley & Smit, 2015) with default parameters. Tandem repeats were also extractedab initiousing TRF v4.09 (Benson, 1999). All repeat sequences with length>100 bp and gap “N”<5% constituted the raw transposable element (TE) library. The homology-based predictions were searched against the Repbase database(Bao et al., 2015) using RepeatMasker v3.3.0 (Chen, 2004)and its in-house script RepeatProteinMask with default parameters. Repbase and ourde novoTE library were processed using UCLUST (Edgar, 2010) to yield a nonredundant library and RepeatMasker was used to identify DNA-level repeats. In total, 167.49 Mb of repetitive sequences were annotated, representing 25.35% of the genome assembly (Supplementary Table S4). The repetitive sequences were dominated by long terminal repeats (LTRs,111.04 Mb, 16.81%), DNA transposons (20.58 Mb, 3.12%),and long interspersed elements (LINEs, 9.05 Mb, 1.37%). In comparison, the dominant repetitive elements in theSebastes schlegeliigenome are DNA transposons rather than LTRs (He et al., 2019; Liu et al., 2019).
We employedab initio, homology-based, and RNA-seqassisted prediction to detect protein-coding genes. For homology-based prediction, the protein sequences ofDanio rerio,Larimichthys crocea,Gadus morhua,Oryzias latipes,andGasterosteus aculeatuswere downloaded from the GenBank and Ensembl databases (Cunningham et al., 2019).The protein sequences were aligned against thePlatycephalussp.1 genome using TBLASTN v2.2.26 (evalue≤1e-5), and matching proteins were then aligned to the homologous genome sequences for accurate spliced alignments with GeneWise v2.4.1 (Doerks et al., 2002).Abinitioprediction was performed using Augustus v3.2.3 (Stanke& Waack, 2003), GeneID v1.4 (Blanco et al., 2007),GeneScan v1.0 (Burge & Karlin, 1997), GlimmerHMM v3.04(Majoros et al., 2004), and SNAP v2013-11-29 (Korf, 2004)based on the repeat masked genome sequences. Transcripts of the seven tissues were assembled by Trinity and aligned to the genome using PASA (Haas et al., 2003). To optimize genome annotation, the transcriptome reads from the seven tissues were also aligned to the genome directly using HISAT v2.0.4 (Pertea et al., 2016) to identify exon regions and splice positions. The alignment results were then used as inputs in Stringtie v1.3.3 (Pertea et al., 2016) for genome-based transcript assembly, and coding regions were then predicted using TransDecoder v.2.0 (http://transdecoder.github.io).Finally, genes predicted by the above three methods were merged into a non-redundant reference gene set with EvidenceModeler v1.1.1 (Haas et al., 2008) with identical weights. Protein-coding genes were then annotated by alignment against the SwissProt, NT, NR, GO, and Kyoto Encyclopedia of Genes and Genomes (KEGG) databases using BLAST+ v2.2.28 (McGinnis & Madden, 2004) with an evalue threshold of 1e-5. InterProScan v5.31 (Mulder &Apweiler, 2007) was used to predict protein function based on conserved domains and motifs by searching against ProDom,PRINTS, Pfam, SMRT, PANTHER, and PROSITE. Finally, 22 743 protein-coding genes were predicted and 21 555 (94.8%)were successfully annotated (Supplementary Tables S5, S6).Compared to other teleost species, includingD. rerio,Larimichthys crocea,Gadus morhua,O. latipes, andGasterosteus aculeatus, the predicted gene models ofPlatycephalussp.1 showed similar distribution patterns in coding sequence (CDS) length, exon length, exon number,gene length, and intron length (Supplementary Figure S1).
For non-coding RNA (ncRNA) prediction, transfer RNAs(tRNAs) were predicted using tRNAscan-SE v1.3.1 (Lowe &Eddy, 1997); ribosomal RNAs (rRNAs) were identified by alignment to closely related rRNA sequences using BLAST;and microRNAs (miRNAs) and small nuclear RNAs (snRNAs)were identified against the Rfam database (Daub et al., 2015)using Infernal v1.1 (Nawrocki & Eddy, 2013). In total, 2 876 ncRNAs, including 1 118 miRNAs, 1 267 tRNAs, 92 rRNAs,and 399 snRNAs, were identified in the assembled genome(Supplementary Table S7).
Gene families were clustered forPlatycephalussp.1 and 13 other species (D. rerio,Gadus morhua,O. latipes,Gasterosteus aculeatus,Hippocampus comes,Takifugu rubripes,Labrus bergylta,Cynoglossus semilaevis,Scophthalmus maximus,Lepisosteus oculatus,Tetraodon nigroviridis,Xiphophorus maculatus, andGambusia affinis)using OrthoMCL v2.0.9 (Li et al., 2003). In brief, the longest transcript of each gene was retained and all-against-all BLASTP analysis was conducted with a cutoff of 1e-5.Orthologs and paralogs were grouped using OrthoMCL v2.0.9 with an inflation index of 1.5. Comparative genomic analysis revealed that the predicted genes could be clustered into 20 743 gene families (Figure 1C). A total of 6 385 gene families were shared among all 14 species, including 1 539 orthologous gene families. Based on the single-copy orthologous genes, a species-level phylogenetic topology was generated using PhyML v3.0 (Guindon et al., 2010) to evaluate the evolutionary relationships. The MCMCTree program implemented in the PAML package (Yang, 2007) was used to estimate divergence times among species. The divergence times ofTakifugu rubripesandTetraodon nigroviridis,Labrus bergyltaandGasterosteus aculeatus,X. maculatusandGambusia affinis,Gasterosteus aculeatusandGadus morhua,D. rerioandO. latipes, andD. rerioandLepisosteus oculatuswere used as calibration times and were downloaded from the TimeTree database (http://www.timetree.org/). The topology results indicated thatGasterosteus aculeatuswas most closely related toPlatycephalussp.1, with a divergence time of 88.4 million years ago (Figure 1D). The divergence time was relatively larger than that betweenSebastes schlegeliiandGasterosteus aculeatus(He et al., 2019; Liu et al., 2019),suggesting thatPlatycephalussp.1 is a more basal species thanSebastes schlegeliiin the order Scorpaeniformes. This suggestion is consistent with previous studies based on mitochondrial and nuclear gene sequences (Cui et al., 2019;Smith et al., 2018).
Expansion and contraction of gene families between ancestors and each selected species were determined using CAFÉ (De Bie et al., 2006). The CODEML program in the PAML package (Yang, 2007) was used to estimate the nonsynonymous to synonymous ratio (dN/dS) and two hierarchical branch-site likelihood ratio tests were applied to identify positively selected genes (PSGs). Firstly, speciesspecific PSGs were identified using flathead as the foreground species andScophthalmus maximus,C. semilaevis,Gasterosteus aculeatus,Takifugu rubripes,Labrus bergylta,Tetraodon nigroviridis,O. latipes,X. maculatus, andGambusia affinisas the background species. Secondly, three metamorphosized species (i.e., flathead,Scophthalmus maximus, andC. semilaevis) were selected as foreground species, and the other above-mentioned species were used as background species. For functional enrichment analyses,GO and KEGG categories were assigned to the orthologous groups according to the flathead genome reference. InPlatycephalussp.1, a total of 438 expanded gene families(including 1 173 genes) and 1 219 contracted gene families(including 85 genes) were detected compared to its most recent common ancestor (Supplementary Figure S2). There were 207 GO terms identified for the expanded genes, 126 of which were significantly enriched (P<0.05) (Supplementary Table S8), including cell-cell adhesion (GO: 0098609, 28 genes,P=2.62E-20), ATPase activity (GO: 0016887, 32 genes,P=1.71E-14), homophilic cell adhesion (GO: 0007156,27 genes,P=6.67E-13), and serine-type endopeptidase activity (GO: 0004252, 22 genes,P=2.26E-09). Notably, three shared GO terms, i.e., ion channel activity (GO: 0005216, 34 genes,P=0.011 13), DNA replication (GO: 0006260, eight genes,P=0.025 57), and DNA metabolic process (GO:0006259, 20 genes,P=0.137 3), were detected between the flathead and flatfish species (Paralichthys olivaceusandC.semilaevis), and are known to play crucial roles in morphological and functional modifications during flatfish metamorphosis (Shao et al., 2017). These findings suggest that the expanded genes may be associated with metamorphosis and demersal adaptation in flatheads. The expanded genes were assigned to 27 KEGG pathways, 13 of which were significantly enriched (P<0.05) (Supplementary Table S9). Enrichment analyses suggested that the expanded genes were highly involved in the immune, biosynthetic, and metabolic-related pathways. The contracted gene families were significantly enriched in 26 KEGG pathways(Supplementary Table S10), which were highly represented in processes related to immunity and metabolism. The annotation of expanded and contracted genes indicated thatPlatycephalussp.1 may have an improved capacity for resilience and adaptation to the demersal environment.
For PSG identification, a total of 1 325 genes were identified in the flathead genome. There were 129 GO terms identified from the PSGs, 16 of which were significantly enriched(P<0.05) (Supplementary Table S11). Additionally, 377 PSGs were identified in the three metamorphosized species (i.e.,flathead,Scophthalmus maximusandC. semilaevis) as foreground species (Supplementary Table S12). These PSGs were functionally enriched in RNA methylation (GO: 0001510,seven genes,P=0.003 76), methyltransferase activity (GO:0008168, 18 genes,P=0.023 56), and RNA processing (GO:0006396, 26 genes,P=0.026 04) (Supplementary Table S13).Similarly, these detected PSGs may also play crucial roles in demersal adaptive evolution in flatheads. However, further investigations are needed to determine the functions associated with the genes in these expanded, contracted, and positively selected gene families, such as their putative roles in adaptive evolutionary processes.
In the present study, we assembled a high-quality chromosome-scale genome ofPlatycephalussp.1, the first reference genome of flatheads in the family Platycephalidae.This study provides valuable genomic data for further studies on demersal adaptation in flathead species and the molecular mechanisms underlying their biological characteristics, such as camouflage, metamorphosis, and sex reversal.
DATA AVAILABILITY
Raw sequencing data for thePlatycephalussp.1 genome have been deposited in the NCBI Sequence Read Archive(SRA) database under accession Nos. SRP269051,SRP278978 and SRP281984 and were deposited in the Genome Sequence Archive (GSA) database under Accession No. CRA004842.
SUPPLEMENTARY DATA
Supplementary data to this article can be found online.
COMPETING INTERESTS
The authors declare that they have no competing interests.
AUTHORS’ CONTRIBUTIONS
T.X.G. and Z.Q.H. designed the study. S.Y.X., Z.C.L., S.S.C.,and T.X.G. collected the samples and extracted genomic DNA. S.Y.X., B.B.C., and D.D.H. assembled and annotated the genome and analyzed the data. S.Y.X. and Z.Q.H. wrote the draft manuscript. T.X.G., Z.Q.H., and S.Y.X. revised the manuscript. All authors read and approved the final version of the manuscript.
- Zoological Research的其它文章
- Deletion of phosphatidylserine flippase β-subunit Tmem30a in satellite cells leads to delayed skeletal muscle regeneration
- Global view on virus infection in non-human primates and implications for public health and wildlifeconservation
- Captopril alleviates lung inflammation in SARS-CoV-2-infected hypertensive mice
- Role of juvenile hormone receptor Methoprene-tolerant 1 in silkworm larval brain development and domestication
- Molecular phylogeny and morphological comparisons of the genus Hebius Thompson, 1913 (Reptilia:Squamata: Colubridae) uncover a new taxon from Yunnan Province, China, and support revalidation of Hebius septemlineatus (Schmidt, 1925)
- Prosecution records reveal pangolin trading networks in China, 2014-2019