
Evans blue staining to detect deep blood vessels in peripheral retina for observing retinal pathology in earlystage diabetic rats
2021-11-08 01:45KangPeiShiYunTongLiChuangXinHuangChuShengCaiYanJieZhuLeiWangXiaoBoZhu
Kang-Pei Shi, Yun-Tong Li, Chuang-Xin Huang, Chu-Sheng Cai, Yan-Jie Zhu, Lei Wang,Xiao-Bo Zhu
State Key Laboratory of Ophthalmology, Zhongshan Ophthalmic Center, Sun Yat-sen University, Guangzhou 510060, Guangdong Province, China
Abstract
● KEYWORDS: Evans blue; whole-mounted rat retina preparation; diabetic retinopathy; diabetic blood retinal barrier; Sprague-Dawley rats
INTRODUCTION
In the method of studying retinal blood vessels, since obvious diabetic cataract pathological changes can be found in early-stage diabetic rats, the utilization of fundus fluorescein angiography (FFA) to detect diabetic rats retina pathological changes is limited. Considering this limitation and the character of Evans blue (EB)’s close combination with plasma albumin and the EB-protein complex can leak into the surrounding tissues through the blood vessels with enhanced permeability which can be easily detected[1-3], EB can replace FFA exceedingly. The observation of the leakage area of the retinas spread on the slides or the quantitative extraction of EB in retinas after EB perfusion turns out to be a widely-used and high-quality method for observing the retinopathy of diabetic rats[4-6]. Although this technique has been very commonly used, it has been unclarified in which part of the retinal blood vessels the leakage occurs in early-stage diabetic rats[7-9].Experimental observations have showed that a certain degree of EB leakage can be observed in the superficial retinal blood vessels of healthy rats. This leads to the conclusion that further experiments will be needed to clarify whether it is meaningful to observe and count the leakage area of superficial blood vessels. This study improves the spreading method based on previous research. This method involves the protection of the peripheral retinal blood vessel and the observation of the leakage area of both superficial and deep blood vessels through a fluorescence microscope in order to understand whether the two types of vessels are statistically different in the retinal blood vessels of diabetic rats.
MATERIALS AND METHODS
Ethical Approval All animal experiments were followed by the ARVO Center’s regulations on animal feeding and ophthalmology and visual research and were reviewed by the Ethics Committee of the Zhongshan Ophthalmology Center(ethics number: 2017038).
Experimental Animals Experimental animals were sevenweek-old SPF male Sprague-Dawley (SD) rats, weighing 220-240 g, which were purchased from Nanjing Pengyue Animal Center, feeding temperature 18℃-22℃, relative humidity 40%-70%, 12h day and night alternate in the environment.
Establishment of Diabetic Rats Model All the 7-week-old SD rats are kept in a breeding room for one week to get rid of the state of stress while those unhealthy rats are eliminated.During this time, the rats gain weight and grow to 260-280 g.The 18 rats are randomly divided into six groups: the normal groups and the diabetic groups, each has 3 groups for 4, 8,and 12wk. The method of building diabetic rat models refers to previous studies[10-12], to which slight changes are add. As is briefly described below, the 1% streptozotocin (STZ; Sigma Corporation, USA) solution (STZ is dissolved in 0.1 mmol/L citrate buffer) injected intraperitoneally at the dosage of 50 mg per kilogram in order to establish diabetic rat models. Three days after injection, draw blood from the veins on rat tail and use a blood glucose meter (one-touch) to test blood glucose concentration. If the glucose concentration of blood is above 16.8 mmol/L, then diabetic rat models are successfully built.The rats in control groups are injected with the same dosage of citrate buffer. After the models are successfully built, measure the weight and glucose level of blood once a week and change the drinking water and the padding every day until the experimental time point is reached.
Evans Blue Perfusion The injection method of EB turns to previous research results for reference[13-15]while slight changes are added to it. As is briefly introduced below, EB(Sigma Corporation, USA) powder is dissolved in 0.09%saline to make up the 3% EB solution. The 3% EB solution is then filtrated and kept in the incubator at the temperature of 37℃. After the time point, anesthesia is induced by gas anesthesia (isoflurane) first and deep anesthesia is applied with intraperitoneal injection of 2% sodium pentobarbital at the dosage of 0.3 mL per 100 grams. Place the rat on a warm pad on its back to accelerate the blood circulation, cut up the skin on the right side of the neck, separate the soft tissues, expose the jugular vein and inject softly and slowly with an insulin syringe (BD Corporation, USA) through the jugular vein at the dose of 45 mg every kilograms for 1min, the whole body of the rat can be seen turning blue.
A Modified Method for Whole-Mounted Rat Retina Preparation The method of whole-mounted rat retina preparation refers to the previous research literature[16-19], and there is a great improvement, focusing on the preparation of the ora serrata of rat retina. After 20min of EB systemic circulation, the rats were sacrificed under anesthesia and the right eyeball was collected and fixed with 4%paraformaldehyde for 10min. The whole-mount was then prepared in 6 steps. First, the cornea and iris were removed along the corneoscleral rim, and the lens was completely removed by sliding non-toothed microforceps through the equator of the lens while preserving the ciliary body. The eyeball was then re-fixed with 4% paraformaldehyde for 30min. Second, the ciliary body was clamped along the upper part of the ora serrata with toothed microforceps and stripped, which preserves the complete periphery of the retina and fully separates and removes the vitreous body adhered to the ora serrata. Then, toothed microforceps were cycled around the eye cup along the periphery to the posterior pole of the retina to thoroughly remove the vitreous body. Third,while avoiding the main blood vessel, the eye cup was cut radially perpendicular to the scleral rim approximately 2/5 to 3/5 of the distance from the cup rim to the optic papilla.After reaching the 2-3 clock code position, another incision was created while avoiding the main blood vessel to form a retinal/scleral flap. The flap was clamped and fixed with nontoothed microforceps, and the retina was bluntly separated from the sclera between the periphery and optic papilla by inserting non-toothed microforceps into the subretinal cavity.The optic papilla was cut off at last. Fourth, a third incision was created in the eye cup to form the second retinal flap as described in the third step. The same procedures were repeated until six retinal flaps at similar intervals were created. This method prevented the sclera from curling towards the center,in which case it was difficult to separate the retina and detach the optic papilla. Fifth, the eye cup was turned upside down,and non-toothed microforceps were utilized to press the center of the optic nerve so that the eye cup was completely turned over. The retina was then separated from the sclera. Sixth, if isolectin-B4 (IB4) was used, the experiment was carried out according to previous steps, and then one end of non-toothed microforceps was utilized to hold out the retina and mount the frontal face on a glass slide (Figures 1 and 2).
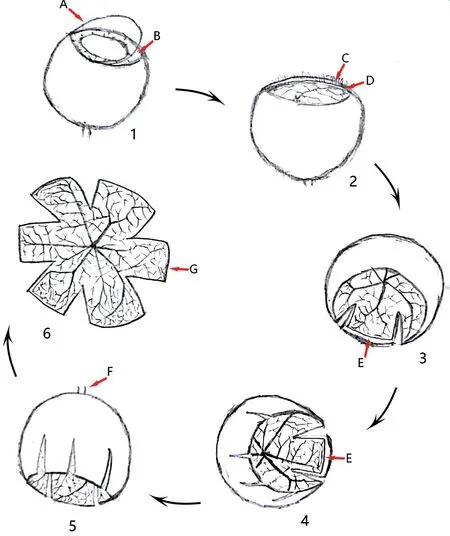
Figure 1 Diagram of the modified procedures for whole-mounted rat retina A: Cornea; B: Iris; C: Ciliary body; D: Ora serrata; E:Retinal periphery; F: Optic nerve; G: Retina.
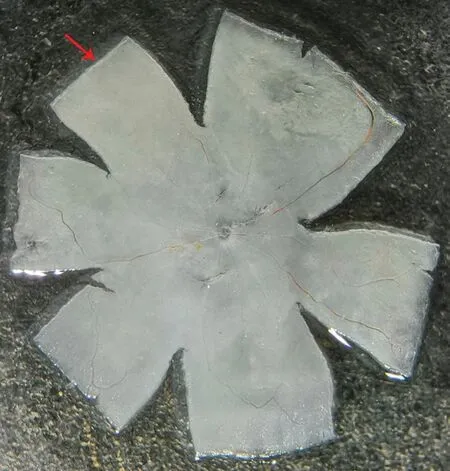
Figure 2 Microscopic observation of the whole-mounted rat retina The red arrows denote the ora serrata.
Measurement of Evans Blue Leakage Area With references to the method mentioned in the article[20-21], the area of EB leakage and the conditions of the retinal blood vessels can be observed quite clearly using an optical filter with a wavelength of 555 nm under a fluorescence microscope. Photographs are taken with the same excitation light intensity, the same exposure time and control other relevant parameters. Select one part of deep blood vessels as well as one part of superficial blood vessels for each retina valve randomly and take a picture(×200 times), adding up to a total of 12 pictures for 6 valves.Use Image J software (Media Cybernetics Corporation, USA)to analyze the leakage area. The gray-scale value from 140 to 210 indicates the leakage area so that the leakage area can be calculated. Imported the data into an excel table to compute the percentage of the leakage area.
Statistical Analysis One-way analysis of variance (ANOVA)and least significant difference (LSD) statistical analysis were performed using SPSS 20.0 (IBM SPSS Statistics 20.0, USA).
RESULTS
In the normal group, the retinal blood vessels of rats are of normal external appearance at 4, 8, and 12wk. EB is well distributed in the blood vessels. The walls of large blood vessels were smooth. The micro-vessels are in good order and no defect area can be seen. The red blood cells were neatly and evenly placed in the capillaries. It can also be observed that part of superficial retinal blood vessels are dilated and have leakage area (Figure 3A-3C). The size of leakage area is calculated and analyzed (the high fluorescence effect the large blood vessels have for their own is already excluded) and the results are (0.54±0.23)%, (0.65±0.11)% and (0.58±0.10)%.No notable leakage is found in the deep blood vessels (Figure 4A-4C), and the size of the leakage area is (0.03±0.04)%,(0.03±0.05)% and (0.03±0.05)%.
In the diabetic group, the blood vessels are slightly slenderer at all three time points and the background fluorescence of the retina enhances. There is no obvious difference between the three groups. The walls of large blood vessel walls are smooth and the micro-vessels are in good order. No defects or neovascularization can be seen and part of superficial retinal blood vessels can also be observed for dilation and leakage(Figure 3D-3F). The size of leakage area is calculated and analyzed (the high fluorescence effect the large blood vessels have for their own is already excluded) and the results are(0.53±0.22)%, (0.69±0.16)% and (0.52±0.11)%. Notable leakage is found in the deep blood vessels (Figure 4D-4F), and the size of the leakage area is (0.54±0.50)%, (1.42±0.16)% and(1.80±0.07)%.
Statistical analysis shows that superficial vascular leakage can be detected in all 6 groups. No statistical difference is calculated for the percentage of leakage area between the normal group and the diabetes group at each time point and no statistical difference is calculated also in the percentage of superficial blood vessel leakage area between different time points at 4, 8, and 12wk in the diabetes group (Figure 5,P>0.05).In the normal group, no obvious deep retinal blood vessel leakage can be seen. In the diabetic group, the percentage of the leakage area of the deep retinal blood vessels gradually increased as time goes by (Figure 6), the deep blood vessels on the peripheral area in particular. On the fourth week, the diabetes group has no statistical difference compared with the control group (P=0.084). However, there is a statistically difference of the leakage area between the 8thweek and the 4thweek of diabetes group (P=0.003), and significant statistical difference is notable between the eighth week diabetes group and the control group (P<0.001). No statistically significant difference can be observed in diabetes group when comparing the 8-week rats and the 12-week rats (P=0.207). However,significant statistical differences can be noticed between 4-week rats and 12-week rats in diabetes group. Also, rats on their 12thweek are of significant difference in two groups(P<0.001).
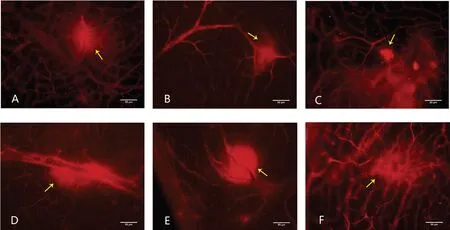
Figure 3 Superficial vascular leakage of six group A-C: Superficial vascular leakage can be seen in the retina of the 4-week, 8-week, and 12-week in normal group; D-F: Superficial vascular leakage can be seen in the retina of the 4-week, 8-week, and 12-week in diabetic group. The yellow arrow shows leakage. Magnification 200×, scale 50 μm.
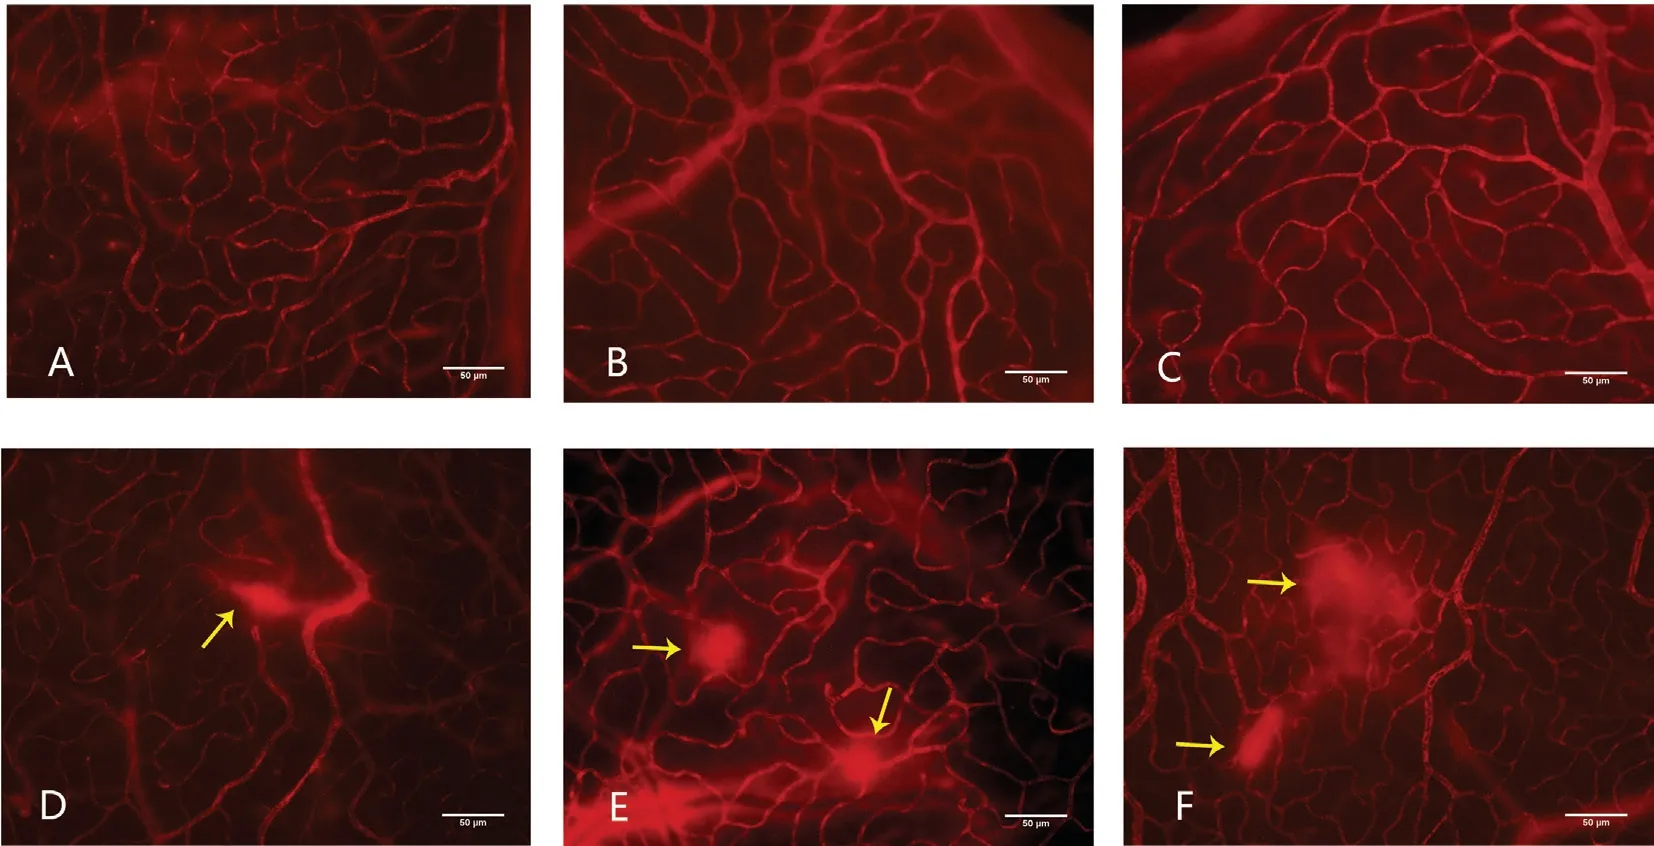
Figure 4 Deep retina blood vessels leakage of six group A-C: Deep retina blood vessels in the 4-week, 8-week, and 12-week in control group was regular and has no leakage; D: Deep retina blood vessels in the 4-week of diabetic group was irregular and leakage can be seen; E: Deep retina blood vessels in the 8-week of diabetic group was irregular and leakage aggravate; F: Deep retina blood vessels in the 12-week of diabetic group seems irregular and leakage area enlarge compared with the 8-week diabetic group. The yellow arrow shows the leakage. Magnification 200×, scale 50 μm.
DISCUSSION
Blood retinal barrier (BRB) dysfunction caused by hyperglycemia is the essential factor for diabetic retinopathy[22-24].The appliance of FFA is limited in this study area due to cataracts caused by diabetes, which makes the use of EB to detect BRB pathological changes in the retina of diabetic animal model the mainstream. However, there’s no standard criteria for the detection of the retinal leakage in early-stage diabetic rats for now.
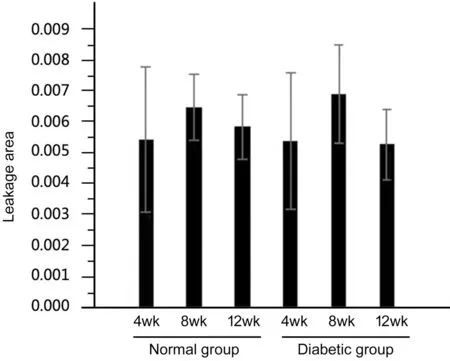
Figure 5 Statistical data of superficial blood vessels among the 6 groups There is no statistically significant difference in the leakage area of superficial blood vessels in all 6 groups.
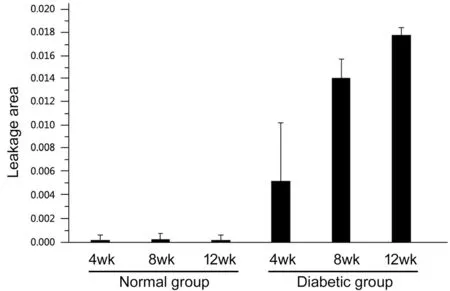
Figure 6 Statistical data of deep blood vessels leakage among the 6 groups Comparing the leakage area of the deep peripheral blood vessels in both groups with different week age, it can be seen that the leakage area of the diabetic group is significantly larger than that of the normal group. As time goes by, the percentage of the leakage area of the diabetic groups increases gradually.
The following questions have remained unknown: 1) which part of the blood vessel leaks earlier? 2) which part of the blood vessel leaks more thus has more significant influence to be observed in early-stage DR rats? During the longterm study of leakage of the retinopathology in diabetic rats, all above questions are discussed, and some profound discoveries are made at the same time. Ultimately, the following conclusions can be drowned from this experiment:The leakage in superficial blood vessels can also be observed in the normal groups, mainly the large blood vessels. There is no statistical difference found when comparing the leakage area of the treatment groups with control groups. It is indicated that analyzing leakage area of large superficial blood vessels will cause false negatives and make it harder to detect earlystage diabetic retinal changes. As a result, the research for the intervention and treatment of early-stage diabetic retinal pathology will be hindered. Evident leakage can be seen in the deep blood vessels of the diabetic rats, especially the ones on the periphery of retina, which is also a notable difference from the normal rats. This study holds the opinion that the retinal blood vessels pathological changes of early-stage diabetic rats are mostly from the deep blood vessels of peripheral retina.Hence it is recommended to observe the form and measure the leakage area of deep blood vessels, especially the deep and peripheral ones when used EB perfusion to study the leakage of blood vessels in the retina of diabetic rats. For this reason,protecting the blood vessels on the periphery of the retina should be paid great attention to when spreading the retina on the slide. At the same time, high power microscope also helps a lot in distinguishing deep blood vessels from superficial ones more vividly. Although the leakage area change of deep blood vessels in the 4-week diabetic group is not statistically different from that of the normal group, it is safe to say that the 4-week diabetic group already has had leakage. Though not statistically reliable to be used as a time point to support the semi-quantitative study of the leakage area of the retinas of diabetic rats, the deep blood vessels on the 4thweek can still work when observing the morphological changes. We have also noticed that the leakage area increases rapidly during the 4thand the 8thweek in the diabetes groups. This study believes that 4-8wk is an important period for detecting early-stage diabetic rats retinal vascular pathological changes. Previous studies may have not taken the problem of large blood vessel leakage into consideration, so deemed the changes in retinal leakage area between the diabetes groups and the normal groups have no statistical significance until at least 12wk later in diabetic rats, but this study suggests that future observation can start earlier since the 8thweek and semi-quantitative statistical analysis can be performed.
The experimental method in this study is simple and easy to apply and the images are clear and reliable. The following aspects should be paid attention to during the operation:The EB solution must be kept at about 37°C to prevent low temperature from damaging vascular endothelial cells and affecting circulation. Meanwhile, rats must be kept warm during anesthesia, which contributes to the survival of the rat and the circulation of EB. After the eyeball being removed, it cannot be fixed in 4% paraformaldehyde for too long before the anterior segment being dissected, or else the retinal degeneration and dissolution will occur, and the retina will not be spread easily. During the dissection of the anterior segment, do not remove the ciliary body in haste when the periphery of the retina cannot be observed clearly, because if else, the following procedure will be more complicated and experimental data bias appear because the periphery of the retina is not preserved. After the retina is separated from the sclera, it is advised that instead of rinsing the retina, use the toothless micro-forceps to get rid of the impurity substance under the anatomy microscope so that EB will not be cleaned away. It is highly suggested that retina should dry under room temperature until it is totally transparent, if else, the retinal blood vessels will be partially covered, especially the deep ones and the statistical data will be severely damaged.Observation under high-power microscope (fluorescence microscope ×200) is recommended because not only retinal leakage can be distinguished from impurity substance, whether the leakage is from superficial vessels or deep vessels can be told easily as well.
In this study, the modified retinal spread technique is used to protect the periphery of the retina. Applying this technique,we observed the retinal vascular changes in early diabetic rats mainly occur in the deep blood vessels in the peripheral retina.It is also noted that 4 to 8wk after the diabetic rats models are built, the leakage develops the fastest. In the eighth week,semi-quantitative statistics of the vascular leakage area in the deep blood vessels in the peripheral retina can be carried out, and it is proposed that the measurement of the superficial vascular leakage area is of no significance for the study of early diabetic rat retinal changes. Of course, the study has some shortcomings. If we extract quantitative EB from the retina of each group of rats to verify our conclusion, the questions above will be interpreted more accurately. However, we also take into consideration that since this study mainly adopts morphology for semi-quantitative analysis, it is more directly to observe where and when the leakage occurs. Quantitative analysis may be able to verify our results, and statistical differences may happen in the 4thweek after the establishment of rats models,but this is not likely to solve the position-setting problem, and our research focus on how locate the leakage more precisely.Meanwhile, we consider that while experimental observations discovers that early diabetic rats mainly have pathological changes in the deep peripheral blood vessels of the retina, is it possible that human diabetic retinopathy also appear first in the deep peripheral blood vessels? For now, optical coherence tomography angiography just can observed deep blood vessel changes in the posterior part of the retina[25-27], while FFA just can observed superficial blood vessel changes in retina[28-30].However, we believe that, with the technological improvement of various inspections, this problem will be solved, and diabetic retinopathy can be diagnosed in advance and treated in time.
ACKNOWLEDGEMENTS
Author’s contributions: Shi KP: complete all the experiments and write the article; Li YT: write the article; Huang CX:funding; Cai CS: assist in the completion of the experiment;Zhu YJ: assist in the completion of the experiment; Wang L:assist in the completion of the experiment; Zhu XB: provide experimental ideas.
Foundation:Supported by Guangdong Natural Science Foundation (No.2016A030313344).
Conflicts of Interest:Shi KP, None; Li YT, None; Huang CX, None; Cai CS, None; Zhu YJ, None; Wang L, None;Zhu XB, None.
 International Journal of Ophthalmology2021年10期
- International Journal of Ophthalmology的其它文章
- Exosomal miR-29b found in aqueous humour mediates calcium signaling in diabetic patients with cataract
- Intraluminal stenting versus external ligation of Ahmed glaucoma valve in prevention of postoperative hypotony
- Visual acuity after intravitreal ranibizumab with and without laser therapy in the treatment of macular edema due to branch retinal vein occlusion: a 12-month retrospective analysis
- Dexamethasone intravitreal implant (Ozurdex) in diabetic macular edema: real-world data versus clinical trials outcomes
- Comparative analysis of the clinical outcomes between wavefront-guided and conventional femtosecond LASlK in myopia and myopia astigmatism
- Reliability of the ocular trauma score for the predictability of traumatic and post-traumatic retinal detachment after open globe injury