
One-step Synthesis and Photocatalytic Degradation Performance of Sulfur-doped Porous g-C3N4 Nanosheets
2022-04-14 05:55LiuYuanZhaoHuaLiHuipengCaiTianfeng
中国炼油与石油化工 2022年1期
Liu Yuan; Zhao Hua; Li Huipeng; Cai Tianfeng
(School of Petrochemical Engineering, Liaoning Petrochemical University, Liaoning 113001)
Abstract: In this study, the sulfur-doped porous g-C3N4 nanosheets (CN-T-U 1.75) were synthesized successfully by onestep calcination utilizing urea and thiourea as precursors. Under visible light irradiation, CN-T-U 1.75 showed remarkable photocatalytic activity for Rhodamine B (RhB) degradation with a kinetic reaction rate constant of 0.01838 min-1. The characterization analysis indicated that CN-T-U 1.75 had a higher specific surface area and the doping altered the energy band structure. This work offers a new viewpoint on modifying the band structure of a photocatalyst using a doping strategy,as well as new insights into the generation routes of active species involved in the photocatalytic process.
Key words: sulfur-doped g-C3N4; nanosheets; photocatalysis; degradation
1 Introduction
In recent years, environmental pollution and energy depletion have become urgent problems, and photocatalytic technology is considered as an effective means to solve these two problems[1]. The basic principle of photocatalytic technology is to use photocatalytic materials to generate electrons and holes in redox reactions under the excitation of light, thus achieving active free radicals that can degrade pollutants.Hence, pursuing economical, stable, and sustainable photocatalytic materials with admirable optical absorption range in addition to efficient separation and transportation of the radiative electrons and holes is still immediately required[2].
Due to its high physical and chemical stability as well as an appropriate band gap width, graphite carbon nitride (g-C3N4) has recently sparked a lot of interest in degrading organic pollutants under visible light. Because of its tiny specific surface area and high recombination rate of photo-induced electrons and hole pairs, bulk g-C3N4still has poor photocatalytic performance, making it difficult for single-component polymer photocatalysts to be competent for efficient photocatalytic processes[3-5].Among many modification methods, constructing the porous nanostructures and element doping are still two efficient methods for regulating the electronic structure and extending the visible light absorption range. In previous studies, the g-C3N4containing nanostructures were often made in two steps, coupled with acid treatment,hydrothermal treatment, or hot air treatment after the production of bulk g-C3N4. Furthermore, the majority of g-C3N4porous nanosheets are made using either hard or soft templating methods, while removing the template causes the nanostructure to collapse along with creating numerous structural faults[6-7]. Furthermore, in the hardtemplating procedure, the templates are frequently eliminated by dissolving them in a damaging NH4HF2or robust acid solution. In the case of soft templates, there is always some residual carbon in the product, which tends to become the center of charge carrier complexes,lowering photocatalytic efficiency. The gaseous bubble template approach has lately piqued interest as a viable alternative to traditional hard template methods in this regard. The use of gaseous bubbles template techniques can improve the optical and structural properties of g-C3N4, and the construction of porous nanostructures is a low-cost, environmentally friendly, and scalable method that does not require any post-processing[8-9].However, the quantum size effect would increase the bandgap of a semiconductor with a small size, limiting photocatalytic efficiency to a certain extent. Fortunately,the energy band structure of semiconductors could be effectively controlled by element doping, so that some non-metallic elements including S[10-11], Cl[12-13], B[14-15],and P[16-17]might been successfully introduced into the g-C3N4. In particular, the S-doping has been shown that it can efficiently narrow the bandgap of g-C3N4and increase its photocatalytic activity, because sulfur atoms could preferentially replace nitrogen atoms with greater electronegativity to achieve energy band regulation[18].Combining the nanosheet fabrication process with element doping can result in nanosheets with a large surface area and strong light absorption. Zhou, et al. obtained the sulfur-doped g-C3N4using thiourea and NH4Cl and found its photodegradation activity to be five-fold higher than that of pure g-C3N4[19]. Guo, et al. synthesized the S-doped g-C3N4by heating (NH4)2SO4and melamine, and the product showed an increased specific surface area and better electronic conductivity[20]. However, when sulfur is doped, changing shape at the same time is extremely difficult. As a result, achieving both nano-structuring and element-doping of g-C3N4in a one-step approach would continue to be of considerable interest.
In this work, we designed a one-step medium-assisted strategy to regulate and optimize the polymerization process of thiourea by adding urea as a gaseous bubble template. The advantages of morphological control and element doping were combined to create a highperformance g-C3N4photocatalyst for the degradation of Rhodamine B (RhB). Thiourea and urea could release gases such as H2S, H2, and NH3during the thermal polymerization process to form porous structures on the surface of the nanosheets, without the need to remove any residue, and the porous structure formation and agglomerate restriction were both achieved. Scheme 1 depicts the synthesis of modified g-C3N4.

Scheme 1 Formation of sulfur-doped porous g-C3N4 nanosheets
2 Experimental
2.1 Reagents and instruments
The crystalline phases of samples were characterized by an XRD-7000 X-ray diffractometer (Shimadzu Corporation, Japan) using Cu Kα radiation. The Fourier transform infrared (FT-IR) spectra were acquired on a Nicolet spectrometer with a KBr pellet. The apparent morphologies were studied by a SU-8010 scanning electron microscope (SEM). Nitrogen adsorption/desorption isotherms at 77 K were measured on an ASAP2010 physical adsorption instrument. Specific surface areas of samples were calculated by the Brunauer-Emmett-Teller (BET) method. Pore size distributions were analyzed by the Barrett-Joyner Halenda (BJH) method.The X-ray photoelectron spectrum (XPS) was analyzed by an X’ Pert-Pro MPD using Cu Kα radiation. The UVvis diffuse reflectance spectra were recorded on an Agilent Cary 50000 spectrophotometer in the wavelength region of 240-850 nm. Photoluminescence (PL) was measured by a Cary Eclipse fluorescence spectrophotometer in the emission region of 380-680 nm, using an excitation wavelength of 380 nm.
2.2 Preparation of sulfur-doped porous g-C3N4 nanosheets
The precursor was obtained by mixing and grinding 1 g of urea with an appropriate amount of thiourea in a mortar and was poured into a corundum crucible placed in a muffle furnace, which was heated at a ramp rate of 5 °C/min to 550 °C for 4 h. The materials were ground well after being cooled down to room temperature and then the sulfur-doped g-C3N4samples were obtained. According to the amount of thiourea (1.25 g, 1.5 g, 1.75 g, 2.0 g),the samples were labeled as CN-T-UX(X=the amount of thiourea). Undoped g-C3N4samples were prepared using the same method, and the g-C3N4formed by using urea and thiourea were named CN-U and CN-T, respectively.
2.3 Photocatalytic degradation performance test
The photocatalytic performance of the as-prepared photocatalysts was evaluated based on the photocatalytic degradation of RhB aqueous solution, which was performed on a JT-GHX-BC photochemical reactor(Hangzhou Jutong Co., Ltd.) with a 500 W Xenon lamp(equipped with a 420 nm filter) as the visible light source.After 25 mg of catalyst were dispersed in 50 mL of RhB aqueous solution (10 mg/L) and the light source was turned on after 30 minutes of stirring to reach the adsorption equilibrium, the samples were taken every 30 min. The UV-Vis spectrophotometer was used to determine the absorbance of the supernatant at 554 nm after centrifugation. The photocatalytic degradation result was evaluated byC/C0, whereC0is the initial mass concentration of RhB (mg/L), and C is the mass concentration of RhB (mg/L) at each sampling time point.
3 Results and Discussion
3.1 Characterization of the samples
The XRD patterns of the CN-T, CN-U, and CN-T-U 1.75 are shown in Figure 1 (a). The samples have two distinct peaks at roughly 13.0° and 27.5°, which correspond to the (100) and (002) crystallographic planes of g-C3N4,respectively[21-22]. These findings revealed that following alteration, the crystal structure of g-C3N4was retained. The(002) peak of CN-T-U 1.75 was widened and attenuated as compared to CN-T and CN-U, owing to lattice distortion and small size impact following S-doping into the framework of g-C3N4. The FT-IR spectra of bulk g-C3N4and several modified g-C3N4clearly exhibit typical chemical bonds corresponding to g-C3N4in Figure 1 (b). The peak located at 808 cm-1in Figure 1 (b) is related to the triazine ring unit[23],and the absorption peaks in the range of 1100-1650 cm-1are attributed to the stretching vibration of the C6N7heterocycle,while the weak absorption peaks at 3 000-3 500 cm-1correspond to the N-H in the incompletely polymerized amine and the free O-H on the surface[24].
The nitrogen adsorption-desorption measurement was used to further analyze the specific surface area and pore size distribution of the three as-prepared samples. As shown in Figure 2 (a), all of the adsorption-desorption isotherms of samples have the type-IV isotherms and the shapes feature a typical H3 hysteresis loop, which is an explicit indication of the presence of mesopores. The pore size distribution of BJH is shown in Figure 2 (b), and the pore size of CN-T-U 1.75 is mostly dispersed in the range of 3-5 nm and 25-80 nm. The specific surface area of CNT, CN-U, CN-T-U 1.75, and CN-T-U 2 was identified to be 53.27 m2/g, 72.62 m2/g, 150.61 m2/g, and 114.24 m2/g,and the average pore diameter was calculated to be 18.99 nm, 25.96 nm, 37.48 nm, and 30.64 nm,respectively (Table 1). Obviously, the CN-T-U 1.75 has a higher porosity and more pore structures. The increase in specific surface area can effectively promote the diffusion of reactants and products.

Figure 1 XRD patterns (a) and FT-IR spectra (b) of the asprepared catalysts
The morphology of CN-T-U 1.75 was characterized by scanning electron microscopy, with the results shown in Figure 3 (a-d). The sample of CN-T has a bulk structure without obvious pores, and the heterogeneous heat transfer in the condensed polymerization is the primary cause of this serious agglomeration. In contrast, the CN-T-U 1.75 has more stacked nanosized sheets with porous networks. As shown in Figure 3 (e-g), the energydispersive X-ray spectroscopy (EDX) elemental mapping images reveal the coexistence and even distributions of C,N, and S elements in the CN-T-U 1.75.

Figure 2 N2 adsorption-desorption isotherms (a) and BJH pore size distribution (b) of as-prepared catalysts
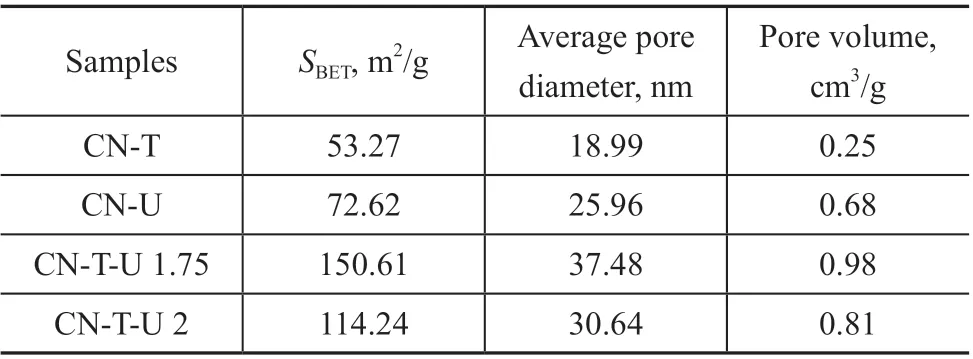
Table 1 Textural properties of as-prepared catalysts

Figure 3 SEM images of CN-U (a), CN-T (b), and CN-T-U 1.75 (c-d) and the corresponding EDX elemental mapping images of CN-T-U 1.75 (e-g)
The chemical composition and elemental valence state of the CN-T, CN-U, and CN-T-U 1.75 were studied using XPS to further characterize the structural difference between the three samples. The complete XPS spectra of CN-T, CN-U,and CN-T-U 1.75 revealed three discernible signal peaks at roughly 288 eV, 400 eV, and 531 eV, corresponding to C 1s, N 1s, and O 1s, respectively, as shown in Figure 4 (a).For CN-T-U 1.75, a relatively weak S 2p peak was found at around 165 eV. The high-resolution spectrum of C 1s is shown in Figure 4 (b), which consists of one minor peak at around 286.2 eV and two notable peaks at around 288.3 eV and 284.8 eV, respectively. The sp2-hybridized carbon atom in an N-containing aromatic ring (N-C=N) is allocated to the middle peak at roughly 288.3 eV[25]. Carbon atoms at C-N structures may be responsible for the tiny signal at 286.2 eV. The exotic carbon contamination is accountable for the center peak at 284.8 eV[26]. The binding energy of N 1s in Figure 4 (c) can be divided into four peaks at 398.7 eV, 399.9 eV, 401.2 eV, and 404.3 eV, corresponding to C=N-C bond, N-(C)3bond, C-N-H bond, and π excitation,respectively[27]. Figure 4 (d) shows the S 2p orbital spectra of CN-T, CN-T-U 1.75, and CN-T-U 2. The binding energy of S 2p of CN-T-U 1.75 can be divided into two peaks at 164.1 eV and 168.6 eV, where 164.1 eV and 165.1 eV can be attributed to the presence of S 2p1/2and SO42-in the C-S bond. The binding energy of S 2p around 166 eV for CN-T and CN-T-U 2 are attributed to S2-[28-29]. The percentage of sulfur atoms in the CN-T-U 1.75 sample can be identified as 0.22% according to XPS analysis, suggesting that sulfur has been successfully introduced into the g-C3N4structure.The UV-vis DRS was used to investigate the optical absorption characteristics of CN-T, CN-U, and CN-T-U 1.75, with the findings given in Figure 5(a). It can be seen that the optical absorption band borders of CN-T and CNT-U 1.75 are red-shifted in comparison to CN-U. Still, the optical absorption band edges of CN-T-U 1.75 are blueshifted close to CN-T, which may be due to the small size effect[30]. According to the Kubelka-Munk function (Figure 5(b)), the energy gaps of CN-T, CN-U, and CN-T-U 1.75 were 2.73 eV, 2.89 eV, and 2.77 eV, respectively, implying that sulfur doping changed the energy band gap of g-C3N4.The bandgap and band-edge location of CN-T-U 1.75 are important determinants in the production of oxidative species under visible light. The valence band positions of CN-U, CN-T, and CN-T-U 1.75 were analyzed by valence band XPS (VB-XPS). Figure 5(c) shows that the valence band (VB) potential of CN-U, CN-T, and CNT-U 1.75 was 1.88 eV, 1.94 eV, and 2.14 eV, respectively.According to the empirical equation,ECB=EVB-Eg(whereECBis the semiconductor conduction band potential,EVBis the semiconductor valence band potential, andEgis the semiconductor energy band gap value (eV)) used to calculate the conduction band (CB) potential of the sample. Finally, the energy level position of the samples was obtained, as shown in Figure 5(d). The CB and VB potential of g-C3N4is around -0.98 eV and +1.80 eV under normal conditions. At the same time, O2/ •O2-and•OH/OH-have redox potentials of -0.33 eV and +1.99 eV, respectively. As a result, electrons in the conduction band can interact with O2to produce •O2-, while holes in the valence band cannot react with OH-to produce•OH, which has a significant oxidizing capacity[31]. As shown in Figure 5(d), the CB and VB potential of CN-U was approximately -0.98 eV and +1.88 eV, respectively,indicating that it could only create •O2-and not •OH. The CB and VB potential of CN-T-U 1.75 was about -0.63 eV and +2.14 eV, indicating that it could only create •O2-and not •OH. As a result, it may produce two types of active chemicals, •O2-and •OH, and combine them in the process for synergistic degradation of organic contaminants.

Figure 4 XPS spectra of as-prepared catalysts(a) of C 1s(b), N 1s(c) and S 2p(d)

Figure 5 UV-Vis DRS patterns (a), band gap values (b), VB-XPS spectra (c) and energy position diagram (d)of as-prepared catalysts
The charge carrier transfer and electron-hole separation efficiency are often measured using the photoluminescence approach. At an excitation wavelength of 380 nm, the PL spectra of as-prepared catalysts are shown in Figure 6. It can be seen that the PL spectral intensity of CN-T-U 1.75 was dramatically decreased as compared with the other samples, implying that less energy was released by the recombination of h+and e-.The results indicated that the CN-T-U 1.75 possessed the best quantum efficiency among all the samples, which was beneficial to the production of more active species to take part in the photocatalytic reaction.
3.2 Photocatalytic performance

Figure 6 Photoluminescence spectra of as-prepared catalysts
The photocatalytic degradation characteristics and reaction rate constants of the degradation of the materials were examined using the aqueous solution of RhB as the simulated textile printing and dyeing wastewater. As shown in Figure 7 (a-b), the CN-T-U 1.75 has the highest degradation rate (0.018 38 min-1), which is 2.7 times higher than the degradation rate of CN-U (0.00673 min-1)and 6.8 times higher than the degradation rate of CN-T(0.00272 min-1). The effect of thiourea dosage on the degradation performance was then investigated, with the degradation performance shown in Figure 7(c) and Figure 7(d). The degradation rate increased as the dosage of thiourea was increased from 1.25 to 1.75. The adsorption and degradation of RhB by the catalyst both decreased significantly, when the thiourea dosage was increased to 2.0 g. As compared to CN-T-U 1.75, the crystallinity of CN-T-U 2 increased with the dosage of thiourea,and the specific area test confirmed that the excessive addition of thiourea decreased the specific surface area of the catalyst, reducing the adsorption capacity of CNT-U 2. Furthermore, high sulfur doping reduced the light absorption performance and electron-hole separation ability of samples, resulting in a worse photocatalytic degradation ability of CN-T-U 2 in comparison with CNT-U 1.75. This implied that an appropriate amount of thiourea should be managed when doping modification is performed to generate catalysts with a high specific surface area and outstanding optical characteristics.
Durability and stability as important requirements for the actual application of photocatalysts were evaluated. Thus,four successive cycling experiments on the removal of RhB by CN-T-U 1.75 were performed. As shown in Figure 7(c), the photocatalytic activity of the CN-T-U 1.75 sample showed only slight decrease in the degradation of RhB after three cycles.
Active species play a crucial role in photocatalytic degradation processes. Scavengers such as benzoquinone(BQ), isopropyl alcohol (IPA), and disodium ethylenediaminetetraacetate (EDTA-2Na) were utilized to capture superoxide radical (•O2-), hydroxyl radical (•OH),and vacancy (h+) to further validate the active species in the photocatalytic activity[31]. The results are shown in Figure 7(d). During the degradation of RhB by CN-T and CN-U, the addition of EDTA-2Na can lead to a significant enhancement of the degradation effect, because more electrons (e-) are involved in the photocatalytic reaction after capturing h+.The addition of IPA had little effect, while the addition of BQ led to a significant decrease in the degradation performance,indicating that •O2-was the main active species on CN-T and CN-U. The addition of EDTA-2Na had little effect on the degradation effect, but the addition of BQ and IPA decreased the degradation effect to different degrees, which indicated that both •O2-and •OH were the active species on CN-T-U 1.75, and the inhibition effect of BQ was more evident than that of IPA, indicating that in the degradation process •O2-played a more significant role than •OH.

Figure 7 Photocatalytic performance of as-prepared catalysts (a); plot of -ln(C/C0) versus reaction time in the degradation of RhB (b); catalytic stability of CN-T-U 1.75 (c); influence of scavengers on the degradation rate of as-prepared catalysts (d)

Figure 8 Illustration of RhB photodegradation by CN-T-U 1.75 under visible light
The schematic representation of photo-induced e-from h+separation and a proposed photocatalytic mechanism of RhB photodegradation by CN-T-U 1.75 under visible light are shown in Figure 8. The electrons on the VB are excited and transported to the CB when visible light reaches the photocatalyst, resulting in electron-hole pairs. The electron reacts with dissolved oxygen (O2) in water to form •O2-,and the hole reacts with OH-in water to produce •OH.The radicals of •OH and •O2-react with RhB adsorbed in advance on the surface of CN-T-U 1.75, and RhB can be degraded into CO2and H2O in the redox reaction process.In a word, it is certain that the mesoporous structure and sulfur doping of g-C3N4nanosheets have positive effects on the improvement of photocatalytic activity.
4 Conclusions
In conclusion, we have demonstrated the preparation of sulfur-doped porous g-C3N4nanosheets through a facile environmental friendly approach by using thiourea and urea as precursors in a one-step thermal copolymerization process. The obtained well-modified g-C3N4with pore structure and S-doping displayed photocatalytic performance, which was higher than that of CN-T and CN-U owing to the synergic effect of the enriched surface active sites and increased surface area. Furthermore, the radical trapping tests demonstrated that both •O2-and•OH were active species in the photodegradation process of RhB. The simple and cost-effective synthesis method provided a new insight for developing other porous photocatalysts with excellent catalytic activity.
Acknowledgement: This work was supported by the Liaoning Provincial Natural Fund Mentoring Program Project (2019-ZD-0057).
- 中国炼油与石油化工的其它文章
- Study on Viscosity Reducing and Oil Displacement Agent for Water-Flooding Heavy Oil Reservoir
- Electrospinning Nanofiber Membrane Reinforced PVA Composite Hydrogel with Preferable Mechanical Performance for Oil-Water Separation
- Preparation of Solid Waste-Based Activated Carbon and Its Adsorption Mechanism for Toluene
- Antibacterial and Corrosion Inhibition Properties of SA-ZnO@ODA-GO@PU Super-Hydrophobic Coating in Circulating Cooling Water System
- Investigation of Nitrite Production Pathway in Integrated Partial Denitrification/Anammox Process via Isotope Labelling Technique and the Relevant Microbial Communities
- Heteroatom-Doped Carbon Spheres from FCC Slurry Oil as Anode Material for Lithium-Ion Battery