
Role of Heating Condition in Polyethylene Behaviors under Nitrogen and Air Atmosphere
2022-04-14 05:55ZhaoLiuHouXuMaZhenzhouChenBochongYuanEnxianCuiTingting
中国炼油与石油化工 2022年1期
Zhao Liu; Hou Xu,2; Ma Zhenzhou; Chen Bochong; Yuan Enxian; Cui Tingting
(1. School of Chemical Engineering, Changchun University of Technology, Changchun 130012;2. Advanced Institute of Materials Science, Changchun University of Technology, Changchun 130012;3. School of Chemistry and Chemical Engineering, Yangzhou University, Yangzhou 225002;4. Department of Chemistry, Tsinghua University, Beijing 100084)
Abstract: Recycle of plastic waste is an indisputable means to alleviate both environment and energy crisis. In this work,effects of heating condition on polyethylene behaviors in nitrogen and air were studied. It was observed that polyethylene behavior was a single step in nitrogen, while the multiple steps occurred in air. According to the weight loss and heat flow curves, polyethylene behaviors in air were divided into three regions: low-temperature (<340 °C), middle-temperature(340 - 380 °C) and high-temperature (> 380 °C) regions. Kinetic analysis revealed that the partial oxidization took the dominance in the low-temperature region, which seldom formed CO and CO2; the combustion took the dominance in the middle-temperature region, which was positive to the formation of CO and CO2; the pyrolysis was initiated and enhanced in the high-temperature region, which inhibited the formation of CO and CO2. According to the kinetic simulation, a synergistic effect between the pyrolysis and combustion was proposed to account for the acceleration of polyethylene conversion. This work may provide useful information about polyethylene behaviors under heating condition, and help to design and optimize plastic waste incineration process.
Key words: polyethylene; heating condition; partial oxidation; combustion; pyrolysis; kinetic analysis
1 Introduction
Incineration technology is the main method for treating the solid waste along with the energy recovery[1-2]. Among the solid waste, the plastic waste including polyethylene(PE), polypropylene (PP) and polystyrene (PS) possesses a high calorific values of ca. 40 MJ/kg, which is similar to that of the conventional fuels[3-4]. One metric ton of the plastic waste has the potential to give out around 130 MJ of energy[5]. It has been reported that the annual energy savings from recycling global plastic waste is equivalent to 3.5 billion barrels of oil[6]. Currently, although bubbling, rotating and circulating fluidized beds have been widely employed in the incineration technology, the oxidation of the plastic waste suffers from the inevitable emission of organic compounds and inhalable particles due to the incomplete combustion[7-9].
The behavior and product distribution of PE in nitrogen and air at 640-850 °C were studied by Mastral,et al.[10]They found that the formation of aromatic and polyaromatic compounds was enhanced with an increasing reaction temperature, and PE reaction behaviors in air were composed of the pyrolysis, partial oxidation, and combustion processes, which were more complex than that occurring in nitrogen atmosphere.Robinson, et al.[11]found that the facile formation of coke during the treatment of polyethylene terephthalate(PET) in air at 725-875 °C prevented the steadystate operation of fluidized bed. Martínez-Lera, et al.[12]designed a laboratory plant with a bubbling fluidized bed for the thermal treatment of the plastics at 750-900 °C and found that an increase in the ratio of the air flow to material feed inhibited the formation of undesirable tar residue. Recently, the extensive efforts have been devoted to the development of the clean incineration of solid wastes. Kuo, et al.[13]found that the torrefaction pretreatment can reduce the content of the toxic substance,and can benefit the subsequent upgrading of solid waste.Vejerano, et al.[14]studied the effects of nanomaterials on particle emission in the laboratory-scale incineration of paper and plastic waste. It was found that metal oxides and C60promoted combustion efficiency and decreased particle-bound PAHs emission, which was attributed to the presence of surface-active sites and the highly catalytic properties of nanomaterials. Zukowski, et al.[15]designed a new-type fluidized bed that was made from cenospheres. Compared with the fluidized bed of sands,the use of cenospheres reduced nitrogen oxides emission and combustion temperature, and eliminated diffusion flames and soot formation. This successful work made the researchers confident in promoting energy efficiency and reducing organic emissions during plastics incineration process.
As mentioned above, the insufficient combustion and thermal degradation are the main causes for the organic emissions in the plastics incineration. How to solve this problem needs a deep insight into the incineration process. PE is everywhere in the daily life, and is the main component of plastic waste[16]. In this work, PE was used as the model reactant for the plastics incineration.Thermogravimetric and differential scanning calorimetry analyzer was employed to study the effects of heating conditions on PE behaviors in nitrogen and air. A particular attention was paid to the measurement of the weight loss as well as the accompanied energy flow and flue gas. Kinetic analysis was carried out to explore the potential relationship between the pyrolysis, partial oxidation, and combustion reactions in the incineration process. This work may provide useful information about PE behaviors in nitrogen and air, and help to optimize the design of plastics incineration process.
2 Experimental
2.1 Reactants
Polyethylene (PE) powder with a particle size of approximate 150 μm was purchased from the Huachuang Plastics Company (Guangdong, China). High purity nitrogen (with a volume fraction of 99.999%) and air(containing 21% of O2in N2) were used as the reaction gas.
2.2 Experiment apparatus
A thermogravimetric and differential scanning calorimetry analyzer (TG-DSC HCT-1) was purchased from the Hengjiu Scientific Instrument Company (Beijing, China).The measurement accuracy for temperature analysis was 0.1 °C, for TG analysis was 0.1 μg, and for DSC analysis was 10 μW.
A flue gas analyzer (Testo 350) was purchased from the Testo Instrument International Trading Company(Shanghai, China). The measurement accuracy was 0.2%for O2analysis, 0.001% for CO analysis, and 0.3% for CO2analysis.
2.3 Experimental procedure
General tests: An alumina crucible charged with 10 mg of PE was put into a TG-DSC analyzer. The temperature was increased to 100 °C at a heating rate of 12 °C/min in nitrogen (or air) with a flow rate of 50 mL/min. The pretreatment was maintained for 30 min to clean the reaction system, and then the temperature was increased to 700 °C at a heating rate of 12 °C/min.
Isothermal tests: An alumina crucible charged with 10 mg of PE was put into the TG-DSC analyzer. The temperature was increased to 100 °C at a heating rate of 12 °C/min in nitrogen (or air) with a flow rate of 50 mL/min. After the pretreatment for 30 min the temperature was increased to the target value at a heating rate of 12 °C/min and was maintained for 30 min.
Flue gas at the outlet was collected by an air bag and analyzed by the flue gas analyzer. Based on the carbon balance, the CO plus CO2selectivity was defined and calculated by the analysis of the PE weight loss and flue gas composition (Equation 1).
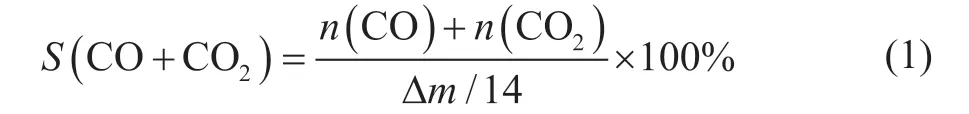
wheren(CO) andn(CO2) are the amount of CO and CO2generated during the thermal treatment period,respectively; Δmis the weight loss of PE.
2.4 Kinetic equations
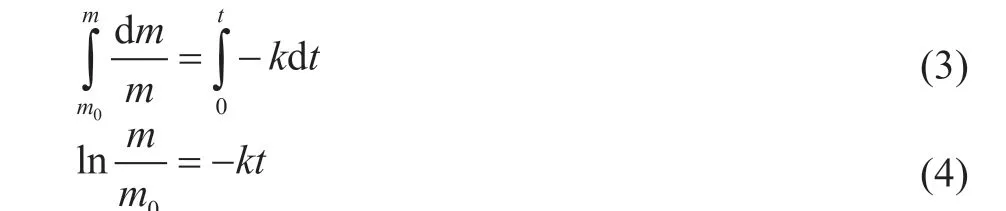
Quasi-first-order kinetics was taken to describe the behaviors of PE thermal treatment in air and nitrogen under heating condition. As shown in Equation 2, the mass change with reaction time was a linear function of PE mass.
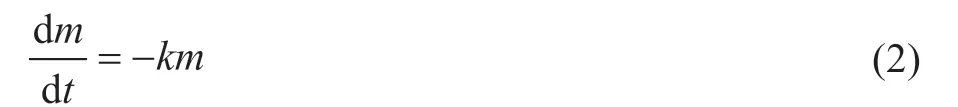
Equation 3 and Equation 4 can be derived by the integration of Equation 2.
Activation energy and pre-exponential factor are available by the Arrhenius equation (Equation 5).

wheretis the reaction time (min),mis the PE mass (mg),kis the rate constant (min-1),m0is the initial PE mass (mg),Ais the pre-exponential factor (min-1),Eais the apparent activation energy (kJ/mol),Ris the universal gas constant(8.314 kJ/mol/K), andTis the reaction temperature (K).
3 Results and Discussion
3.1 PE behaviors in nitrogen and air at a jumping temperature
Reaction behaviors of PE thermal treatment in nitrogen and air were studied at a heating rate of 12 °C/min from 100 °C to 700 °C. The results of TG-DTG and DSC analysis are shown in Figure 1, with key temperature points summarized by Table 1. It was found that the starting temperature of the substantial weight loss in air was 300 °C, which was lower than that in nitrogen(400 °C). Multiple peaks in the range of 300 °C to 570 °C in the DTG curve suggested the change in the reaction behaviors during the thermal treatment of PE in air. On the other hand, there was only a peak at 460 °C observed in the DTG curve for PE thermal treatment in nitrogen, which could be attributed to the occurrence of the pyrolysis reaction. Meanwhile, the heat flow was single-step in nitrogen and multiple-step in air, which was consistent with the TG and DTG curves. The heat flow in air was nearly 65 times that in nitrogen, demonstrating the huge potential of PE incineration for energy recovery.A temperature fluctuation was observed in air at above 400 °C, and the maximum difference between the actual temperature and set temperature was close to 15 °C. The exothermic behavior in air was much more intense at 25-30 minutes, and it might be the cause for the observed temperature fluctuation.

Figure 1 (a) TG-DTG and (b) DSC analysis for PEbehaviors in nitrogen and air at a heating rate of 12 °C/min
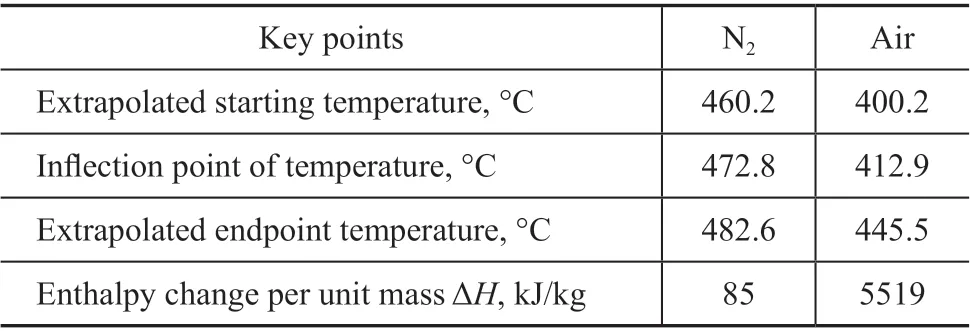
Table 1 Key points of PE behaviors in nitrogen and air.
3.2 PE behaviors in nitrogen and air at an isothermal temperature
3.2.1 PE behaviors in nitrogen at 420-460 °C
The isothermal conditions of 420 °C, 430 °C, 440 °C,450 °C and 460 °C were selected to study the effects of reaction temperature on PE behaviors in nitrogen (Figure 2). It was found that an increase of reaction temperature accelerated PE conversion in nitrogen and promoted the endothermic energy. Meanwhile, the weight loss curve was smooth and no temperature fluctuation was observed.The ln(m/m0) was presented as a function of reaction time, and a linear relationship between the ln(m/m0) and reaction time was observed. The rate constant at each temperature was calculated via Equation 4, and all theR2values were higher than 0.99, indicating that the first-order kinetics was well fitted with PE behaviors in nitrogen at 420-460 °C. According to Equation 5, the lnkand -1/(RT)were calculated, and the activation energy (243.8 kJ/mol)was determined via linear fitting. TheR2value was 0.994,confirming the reliability of the derived activation energy.Similar activation energy for PE pyrolysis was reported in the literature, e.g. 237-279 kJ/mol for PE pyrolysis at 450-470 °C by Horvat, et al.[17], 268 kJ/mol for PE pyrolysis at 430-480 °C by Bockhorn, et al.[18], and 244-251 kJ/mol for PE pyrolysis at 420-470 °C by Kple, et al.[19]It confirmed the reliability of the experimental and analytical methods adopted in this work.
3.2.2 PE behaviors in air at 290-320 °C
As mentioned above, PE exhibited multiple-step behaviors in air under heating condition, which could be attributed to the effects of partial oxidation, combustion,and pyrolysis reactions. According to the weight loss and heat flow curves (Figure 1), two transition temperatures of 340 °C and 380 °C were observed, and it divided PE behaviors into three regions, viz.: low-temperature(<340 °C), middle-temperature (340-380 °C), and hightemperature (>380 °C) regions. In the low-temperature region, the isothermal conditions of 290 °C, 300 °C and 320 °C were selected to study the effects of reaction temperature on PE behaviors in air (Figure 3). It was found that an increase of reaction temperature accelerated PE conversion and promoted the exothermic energy.Eventually, the weight loss curve was smooth, and no temperature fluctuation was observed. The ln(m/m0) was presented as a function of reaction time, and a linear relationship between the ln(m/m0) and reaction time was observed. The rate constant at each temperature was calculated via Equation 4, and all theR2values were greater than 0.99, indicating that the first-order kinetics was well fitted with PE behaviors in air at 290-320 °C.According to Equation 5, the lnkand -1/(RT) were calculated, and the activation energy (20.7 kJ/mol) was determined via linear fitting. TheR2value was 0.999,confirming the reliability of the derived activation energy.
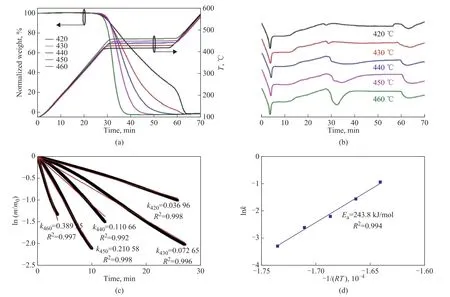
Figure 2 (a) TG analysis, (b) DSC analysis, (c) Kinetic analysis and (d) Kinetic parameter for PE behaviors in nitrogen at 420-460 °C
3.2.3 PE behaviors in air at 340-370 °C
In the middle-temperature region, the isothermal conditions of 340 °C, 350 °C, 360 °C and 370 °C were selected to study the effects of reaction temperature on PE behaviors in air (Figure 4). An increase of reaction temperature accelerated PE conversion and promoted the exothermic energy, which was more noticeable than that in the low-temperature region. Then, the weight loss curve was smooth, and no temperature fluctuation was observed. The ln(m/m0) was presented as a function of reaction time, and a linear relationship between ln(m/m0)and reaction time was observed. The rate constant at each temperature was calculated via Equation 4, and all theR2values were greater than 0.99, indicating that the firstorder kinetics was well fitted with PE behaviors in air at 340-370 °C. According to Equation 5, the lnkand -1/(RT)were calculated, and the activation energy (49.9 kJ/mol)was determined via linear fitting. Although theR2value(0.940) was a little lower than that in air at 290-320 °C and that in nitrogen at 420-460 °C, it was acceptable for the present study. The activation energy in nitrogen and air at different temperatures were significantly different,confirming the variation of reaction network for PE behaviors.
3.2.4 PE behaviors in air at 400-430 °C

Figure 3 (a) TG analysis, (b) DSC analysis, (c) Kinetic analysis and (d) Kinetic parameter for PE behaviors in air at 290-320 °C
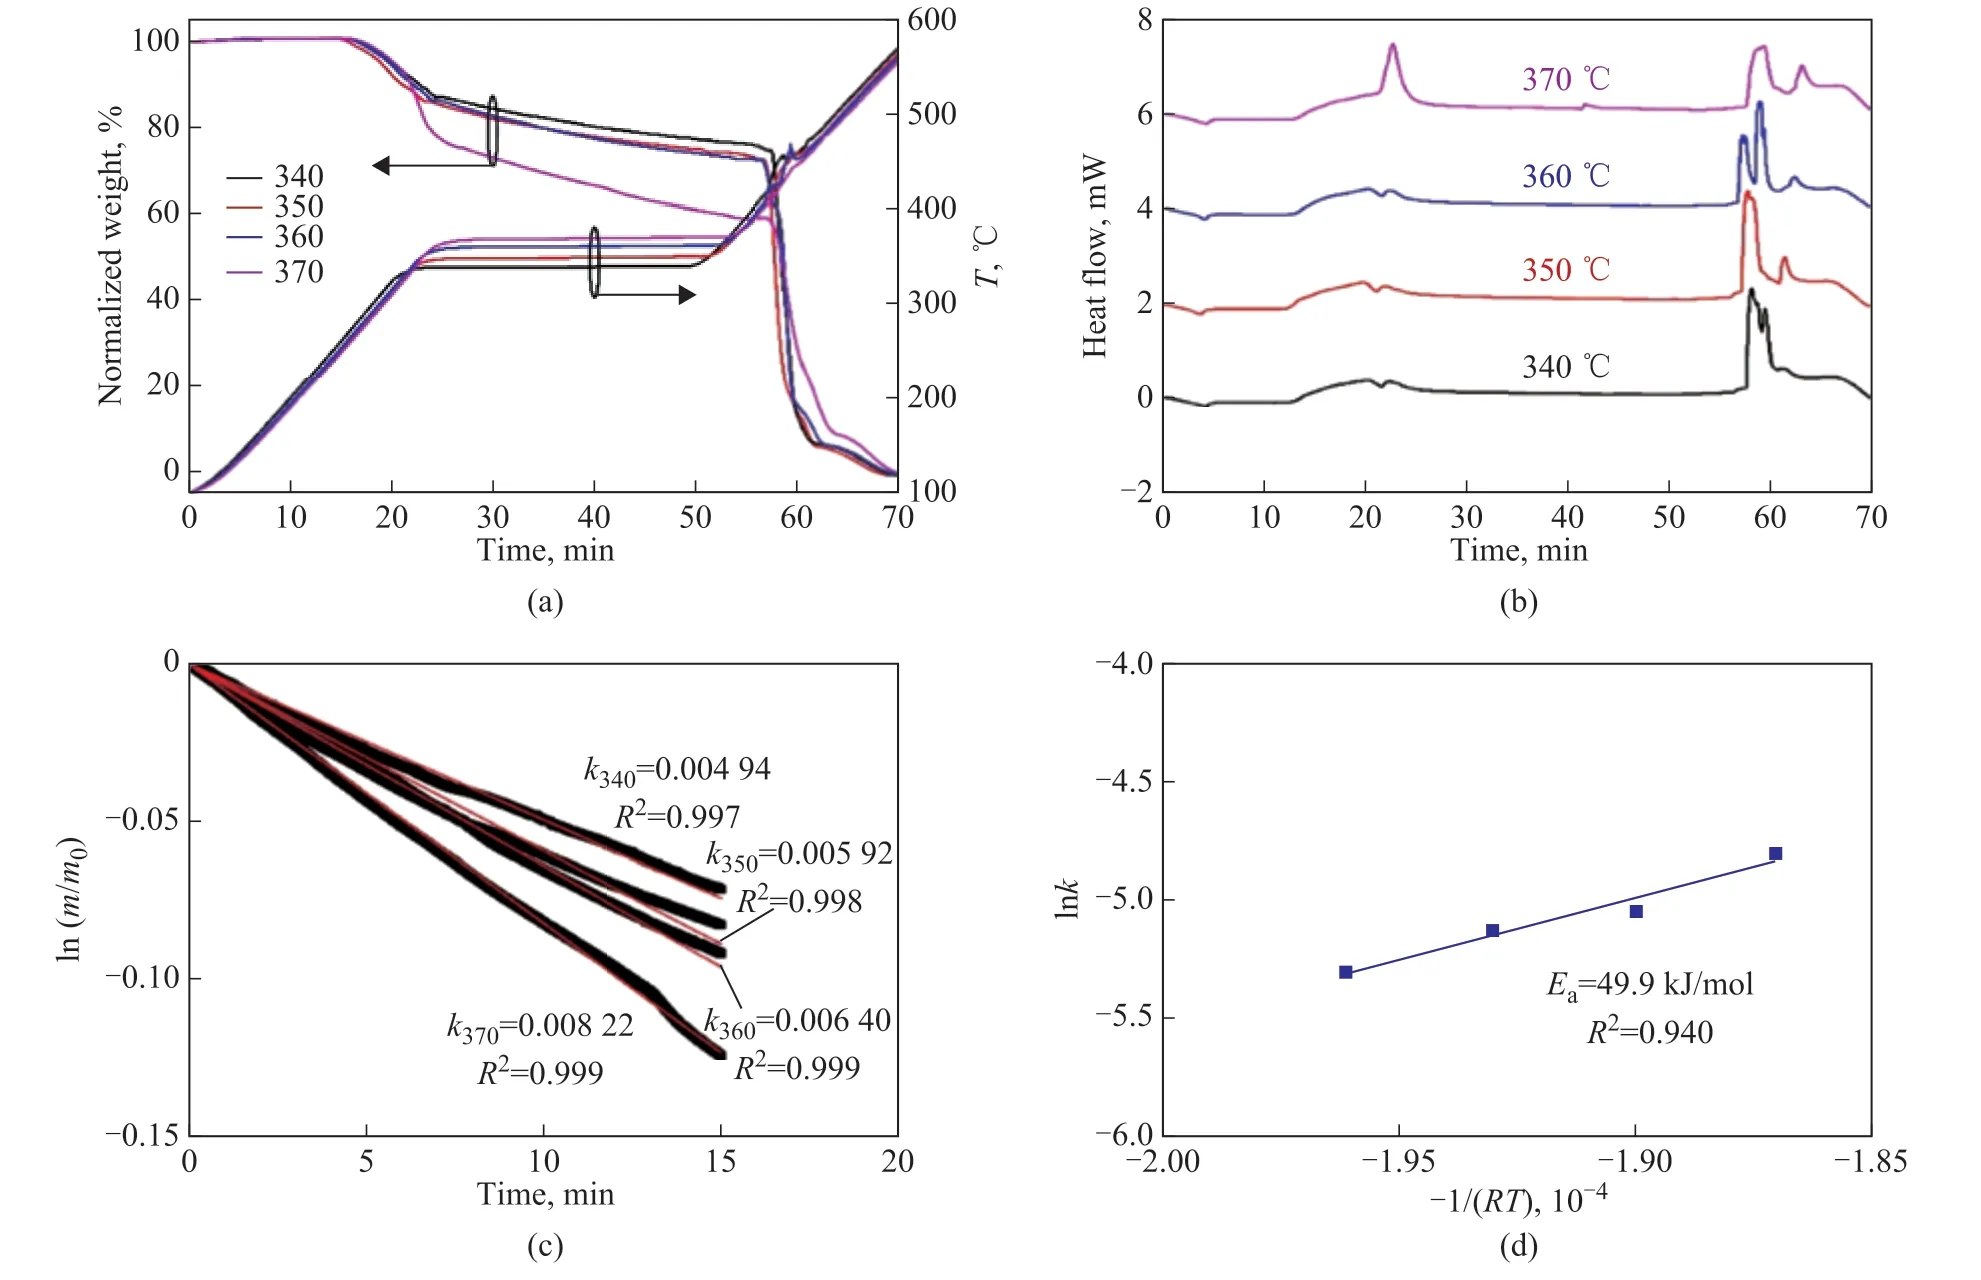
Figure 4 (a) TG analysis, (b) DSC analysis, (c) Kinetic analysis and (d) Kinetic parameter for PE behaviors in air at 340-370 °C
In the high-temperature region, the isothermal conditions of 400 °C, 410 °C, 420 °C and 430 °C were selected to study the effects of reaction temperature on PE behaviors in air (Figure 5). It was found that the weight loss curve was rough, and the reaction temperature was fluctuant.The maximum difference between the actual temperature and the set temperature was close to 20 °C. An increase of isothermal temperature was brought in the temperature fluctuation, making the heat flow more concentrated.The PE behaviors at 400-430 °C were similar in terms of the rapid weight loss, strong exothermic energy,and temperature fluctuation. Based on the weight data after temperature fluctuation, the ln(m/m0) value was calculated and presented as a function of reaction time.The rate constant at each temperature was calculated via Equation 4, and someR2values were lower than 0.99,indicating that PE behaviors in air at 400-430 °C were deviated from the first-order kinetics. This result might be attributed to the synergistic effect of pyrolysis and combustion. Although the rate constants were hard to derive the activation energy via the Arrhenius equation,they were suitable for the qualitative comparison of the reaction rate.
3.3 Combustion efficiency analysis
CO2and CO were regarded as the typical products from PE combustion in air, and they could hardly be generated by the pyrolysis and partial oxidation reactions. Based on TG, CO and CO2analyses, the CO plus CO2selectivity was calculated by Equation 1 to evaluate the combustion efficiency for PE behaviors in air at the isothermal temperature. As shown in Figure 6, the CO plus CO2selectivity was in the range of 17 mol%-84 mol%,which at first increased then decreased with the elevated temperature. For example, it was 17 mol% at 290 °C, then increased to 84 mol% at 360 °C, followed by decreasing to 25 mol% at 440 °C. The CO plus CO2selectivity was consistent with the multiple-step characteristic of PE behaviors in air. In the low-temperature region,the CO plus CO2selectivity was around 20 mol%,and was slightly promoted by an increasing reaction temperature. In the middle-temperature region, the CO plus CO2selectivity was higher than 40 mol%, and at first increased then decreased with the elevated temperature.A highest CO plus CO2selectivity was achieved at 360 °C, indicating the best combustion efficiency. In the high-temperature region, the CO plus CO2selectivity was significantly reduced by an increasing reaction temperature. According to the combustion efficiency analysis, it was deduced that PE partial oxidization took the dominance in the low-temperature region, which would mainly generate the oxygenated compounds and seldom form CO and CO2. With an increasing reaction temperature, PE combustion was gradually enhanced and took the dominance in the middle-temperature region,which was positive to the formation of CO and CO2. With the further increase of reaction temperature, PE pyrolysis was initiated and enhanced in the high-temperature region,which was positive to the formation of the light organic compounds. Since the decrease of the organic compound size contributed positively to both the combustion and small molecules emission, the concurrence of pyrolysis and combustion reactions made a complicated difference on PE behaviors. According to the combustion efficiency analysis, the PE pyrolysis contributed more to the small molecules emission than the combustion, which would inhibit the formation of CO and CO2.
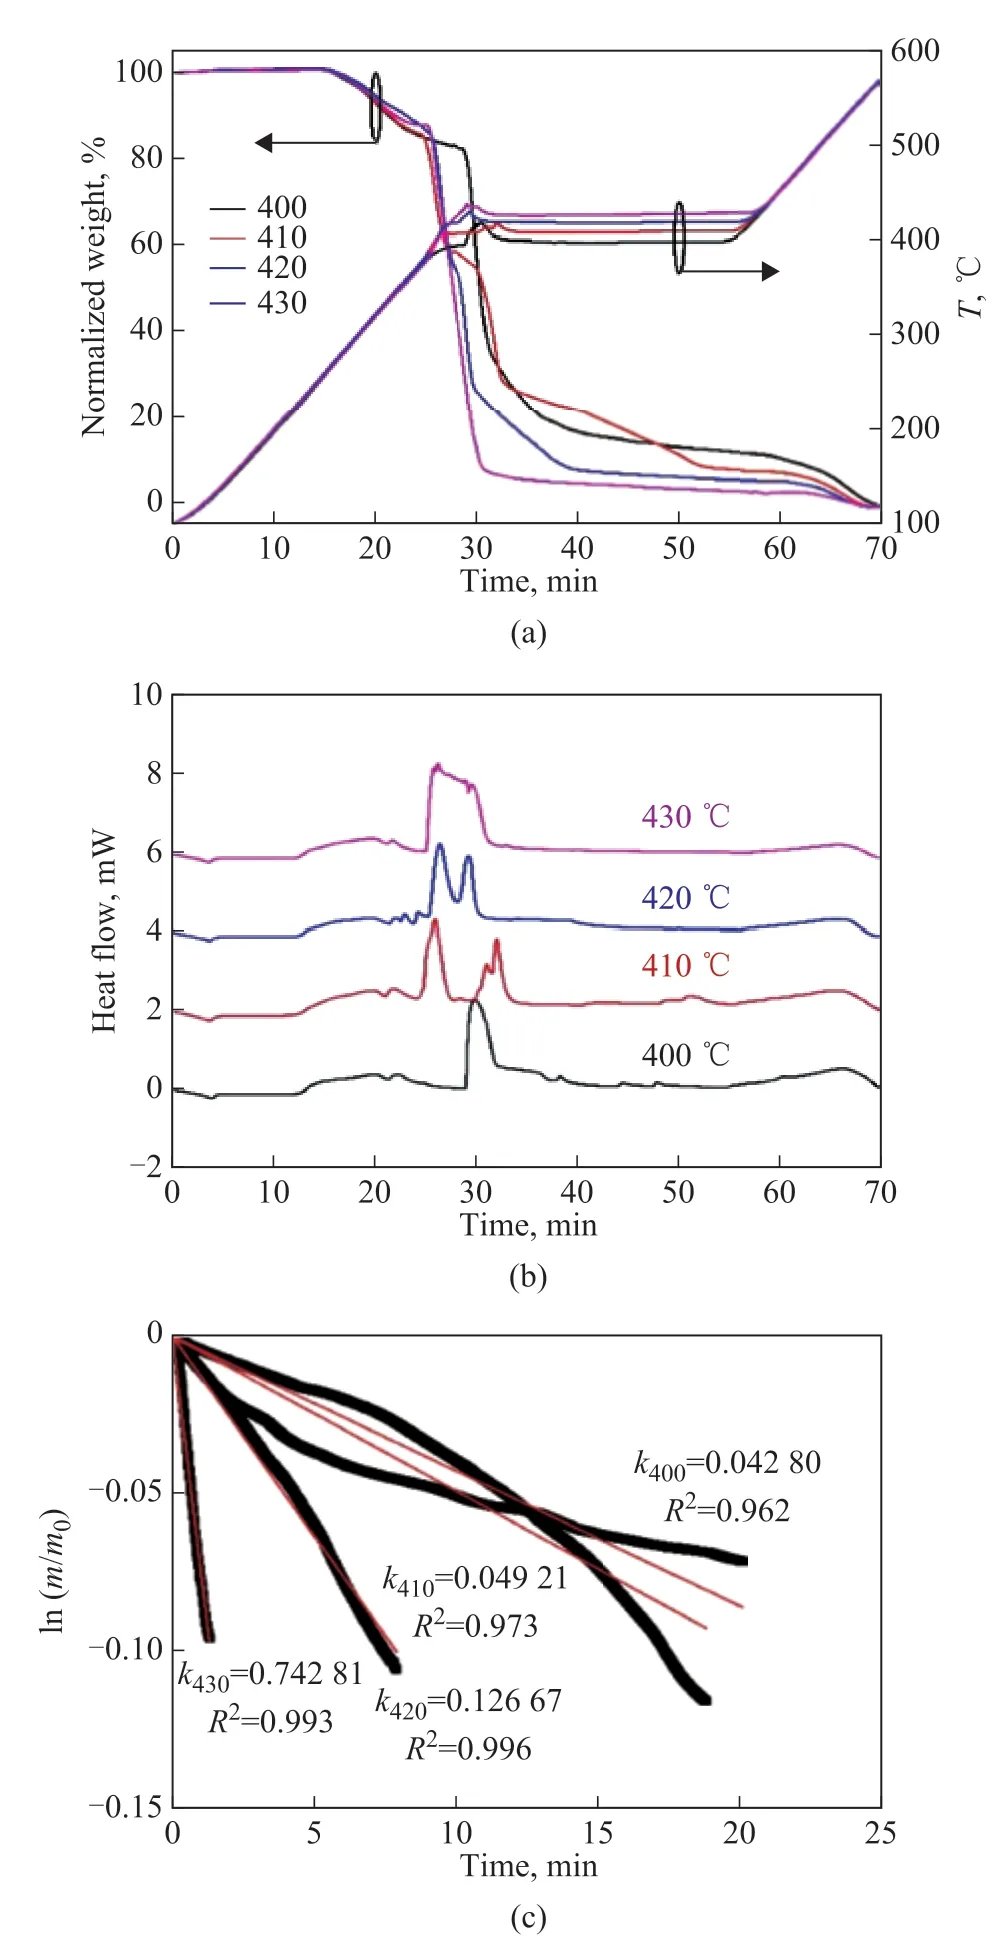
Figure 5 (a) TG analysis, (b) DSC analysis and (c) kinetic analysis for PE behaviors in air at 400-430 °C
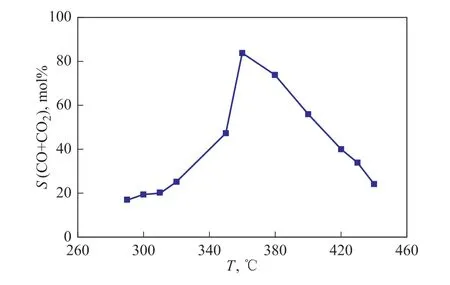
Figure 6 CO plus CO2 selectivity for PE behaviors in air at isothermal temperature
3.4 Kinetic analysis for PE behaviors
According to the discussion mentioned above,PE behaviors in nitrogen at 420-460 °C, in air at 290-320 °C, and in air at 340-370 °C mainly involved the pyrolysis, partial oxidation and combustion reactions.The obtained kinetic parameters can generally characterize and simulate the reaction process. As shown in Figure 7,the rate constants derived from the kinetic simulation and experimental tests were presented as a function of reaction temperature. At a temperature of lower than 340 °C,the pyrolysis rate constant was almost zero, the partial oxidation rate constant was higher than the combustion rate constant. At 340-380 °C, the pyrolysis rate constant was still lower than the partial oxidation and combustion rate constants, and the combustion rate constant surpassed the partial oxidation rate constant. The superiority of the combustion over the partial oxidation was continuously enhanced by an increasing reaction temperature. At a temperature of higher than 380 °C, the pyrolysis rate constant sharply increased with the elevated temperature,and it surpassed the combustion rate constant at 400 °C.The rate constant derived from the experimental data in air at a temperature of lower than 380 °C was well fitted in with the simulation results, while that obtained at a temperature of higher than 380 °C was much higher than the simulation results. Even if the concurrence of the pyrolysis, partial oxidation and combustion reactions was taken into consideration, the measured rate constant was still much higher than the sum of simulation results.It was deduced that a synergistic effect between the pyrolysis and combustion reactions might arise, and it would accelerate the PE conversion in air. The mechanism mode for the synergistic effect might be as follows: (1)The pyrolysis promoted the degradation of PE molecules,and the obtained small molecules and molecular defects were easy to react with oxygen. (2) For PE molecules, the oxidation reaction was easier than the pyrolysis reaction,and it might generate molecular defects, accelerating the pyrolysis reaction. Thus, the optimization of heating condition was crucial to the energy recovery and organic compounds emission during the solid waste incineration.
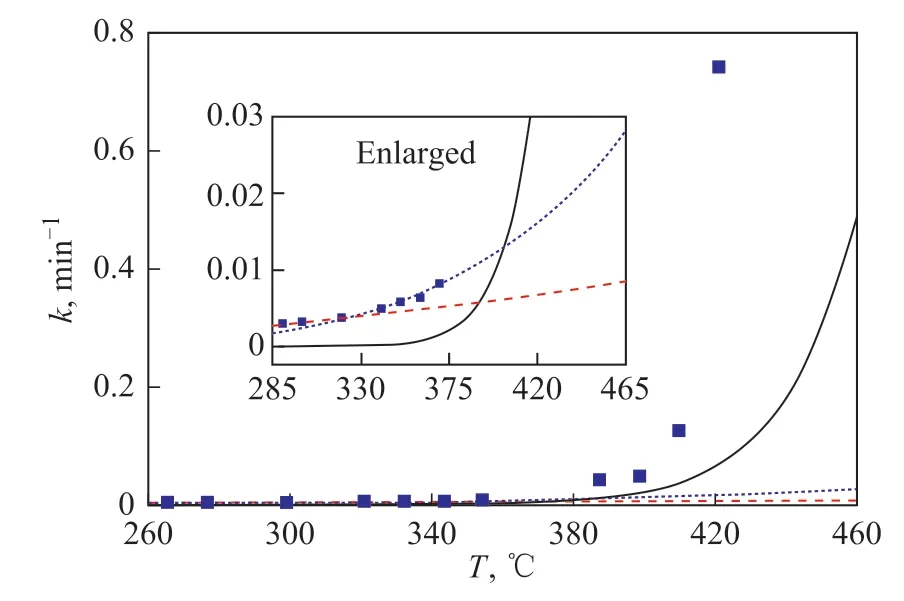
Figure 7 Kinetic simulation for PE behaviors in nitrogen and air as a function of reaction temperature
4 Conclusions
Briefly, the effects of heating condition on PE behaviors in nitrogen and air were studied in this work. It was found that the PE behaviors showed a single-step mode in nitrogen, while demonstrating a multiple-step mode in air. According to the weight loss and heat flow curves,the PE behaviors in air were divided into three regions.Quasi-first-order kinetics was taken to characterize the PE behaviors in air and nitrogen at the isothermal temperature. It was well fitted with PE behaviors in nitrogen at 420-460 °C, in air at 290-320 °C, and in air at 340-370 °C. The corresponding activation energy was 243.8 kJ/mol, 20.7 kJ/mol, and 49.9 kJ/mol, respectively.Therefore, the PE behaviors in air at 400-430 °C were slightly deviated from the first-order kinetics. The CO plus CO2selectivity at first increased then decreased with an increasing temperature, which was consistent with the multiple-step characteristics of PE behaviors in air. It was deduced that PE partial oxidization took the dominance in the low-temperature region, which mainly generated the oxygenated compounds and seldom formed CO and CO2.With an increasing reaction temperature, PE combustion was gradually enhanced and took the dominance in the middle-temperature region, which was positive to the formation of CO and CO2. With the further increase of reaction temperature, PE pyrolysis was initiated and enhanced in the high-temperature region, which contributed more to the small molecules emission than the combustion, and thus inhibited the formation of CO and CO2. Furthermore, the PE behaviors in nitrogen and air were simulated by the obtained kinetic parameters. It was found that a synergistic effect between the pyrolysis and combustion reactions might take place, and would accelerate the PE conversion in air. In the future work,the combustion adjuvants would be designed and used to simultaneously reduce the reaction temperature, improve the process stability, promote the energy recovery, and minimize the organic compounds emission in the course of solid waste incineration.
Acknowledgments:The authors gratefully acknowledge the financial support from the National Natural Science Foundation of China (Grant No. 21908010) and the Jilin Provincial Department of Science and Technology (Grant No.20200201095JC).
- 中国炼油与石油化工的其它文章
- Study on Viscosity Reducing and Oil Displacement Agent for Water-Flooding Heavy Oil Reservoir
- Electrospinning Nanofiber Membrane Reinforced PVA Composite Hydrogel with Preferable Mechanical Performance for Oil-Water Separation
- Preparation of Solid Waste-Based Activated Carbon and Its Adsorption Mechanism for Toluene
- Antibacterial and Corrosion Inhibition Properties of SA-ZnO@ODA-GO@PU Super-Hydrophobic Coating in Circulating Cooling Water System
- Investigation of Nitrite Production Pathway in Integrated Partial Denitrification/Anammox Process via Isotope Labelling Technique and the Relevant Microbial Communities
- Heteroatom-Doped Carbon Spheres from FCC Slurry Oil as Anode Material for Lithium-Ion Battery