
Investigating the influence of monosodium L-glutamate on brain responses via scalp-electroencephalogram (scalp-EEG)
2022-06-23 07:22BenWuXiruiZhouImreBlnkYunLiu
食品科学与人类健康(英文) 2022年5期
Ben Wu, Xirui Zhou, Imre Blnk, Yun Liu,*
a Department of Food Science & Technology, School of Agriculture and Biology, Shanghai Jiaotong University, Shanghai 200240, China
b Zhejiang Yiming Food Co., Ltd., Wenzhou 325400, China
Keywords:
Umami
Taste
Monosodium glutamate
Electroencephalogram
Brain
A B S T R A C T
As the relevance between left and right brain neurons when transmitting electrical signals of umami taste is unknown, the aim of this work was to investigate responsive regions of the brain to the umami tastant monosodium glutamate (MSG) by using scalp-electroencephalogram (EEG) to identify the most responsive brain regions to MSG. Three concentrations of MSG (0.05, 0.12, 0.26 g/100 mL) were provided to participants for tasting while recoding their responsive reaction times and brain activities. The results indicated that the most responsive frequency to MSG was at 2 Hz, while the most responsive brain regions were T4CzA2,F8CzA2, and Fp2CzA2. Moreover, the sensitivity of the brain to MSG was significantly higher in the right brain region. This study shows the potential of using EEG to investigate the relevance between different brains response to umami taste, which contributes to better understanding the mechanism of umami perception.
1. Introduction
Taste perception plays an important role in the nutritional balance in mammals. While sweet and umami tastes are associated with nutrition (carbohydrates for energy and proteins as source of essential amino acids), sour and bitter tastes are warning signals for spoilage and against toxicity. Umami taste is recognized as one of the 5 basic tastes, which is different from other taste sensations such as salty,sweet, bitter, and sour [1,2]. There are various compounds that can contribute to umami taste, such as MSG (monosodiumL-glutamate),IMP (disodium 5’-inosinate), GMP (disodium 5’-guanosinate) and succinic acid [3,4]. Moreover, there is a synergistic effect between these umami compounds which can enhance the umami taste [5]. At present, these umami compounds are widely used as food additives,enhancing umami taste and the palatability of foods. The umami taste is mediated by a family of proteins called G-protein coupled receptors (GPCRs) [6]. Taste signals are transmitted to cells through the recognition of taste molecules and extracellular T1R1+3 of type II taste cells, inducing a series of intracellular cascade reactions.Finally, taste afferent nerves reach the central nervous system of the cerebral cortex to generate taste perception [6,7]. Taste recognition and perception are related to the cortex of the brain, which adapts the signals transmitted from taste receptors [8,9]. It is noteworthy to mention that the response of umami taste in the mouth is delayed by approximately 2 s compared to salty taste, which may be explained by the rapid opening of Na+channels [10].
Umami taste is considered to be a pleasant taste modality involved in psychophysics, which has received increasing attention.Currently, the methodologies of umami taste evaluation comprise sensory techniques, intelligent sensors (electronic tongue), biosensors and psychophysiological measurements. Sensory tests might be biased by the subjective judgments of the panelists. The present brain imaging techniques, including functional magnetic resonance imaging (fMRI) [11,12], positron emission tomography (PET),magnetoencephalography (MEG), electroencephalogram (EEG) [13],and functional near infrared spectroscopy (fNIR) [14], can noninvasively monitor the activity of taste areas in the human brain [10].However, they also show some limitations. As an example, fMRI can localize functional regions in the brain, but it is less suitable for quantification. On the other side, EEG can quantify response of the brain to tastants with higher precision leading to more objective results.
Among the cerebral cortex, the anterior, frontal operculum and parietal cortex have been identified as primary taste areas that can respond to umami taste [15,16]. The study by Singh et al. [10]used fMRI to study the brain response to taste, and the results indicated that the response regions to salty and sweet taste were located in the center of the insula, and salty taste was activated only in the amygdala, which was in the ventral part of the central insula.Moreover, the response region to sweet taste and bitter taste were found in the central area of the brain. Despite that the umami taste has been discovered more than 100 years, its responsive area in the human brain is still poorly understood [2].
As one of the noninvasive methods to investigate brain responses,EEG can record brain activity using electrophysiological indicators.It records the changes of electrical waves during brain activity, which can reflect the overall result of electrophysiological activity of brain neurons in the cerebral cortex or scalp. To date, the BIOPAC system for conducting EEG is very helpful for the diagnosis and treatment of various intracranial diseases, such as stroke, encephalitis, brain tumors, and metabolic encephalopathy. In addition, EEG has also been applied to study the relationship between sleep activity [13,17]and Alzheimer’s disease (AD) [18], the treatment of children with respiratory system and Down’s syndrome [19], and the impact of visual complexity on consumer behavior [20]. Moreover, EEG can objectively reflect the actual taste perception in subjects by directly monitoring the electrophysiological signals in the related brain regions. Consequently, the availability of umami taste information from large-scale recordings may enable investigations of the time-frequency dynamics of cortical information in taste perception.It may help to obtain a better understanding of the sensory perception of umami taste and the relationship between oral perception and brain response for umami detection.
2. Materials and methods
2.1 Participants
Ten right-handed participants (8 females and 2 males), with good physical and mental conditions, who were familiar with umami taste,were recruited in this study [15]. They were particularly requested to avoid eating, drinking, and smoking 1 h prior to the test. Gender,age, height, and weight were collected from these participants. The experiments were carried out in an EEG test room, which was safe,quiet, odorless, with a suitable temperature of about (21 ± 1) °C. They were instructed by the researcher and asked to fill in a questionnaire for knowing the procedure, including if they already participated in EEG studies before, expected time period, and length. All participants in this study had given their consent for conducting the experiments.
2.2 Selection of umami stimuli
MonosodiumL-glutamate monohydrate (MSG, ≥ 99%,Sigma, St. Louis, USA) was used, as a typical umami substance.The concentrations of MSG solutions were selected based on a previous study [21], indicating that 3 concentrations of MSG solutions (0.05, 0.12, 0.26 g/100 mL) contributed to weak, moderate,and strong umami perception. The participants could detect and recognize the umami perception from those concentrations. MSG solutions were prepared freshly on the day when experiments were run ((25 ± 1) °C). In the experiments, ultra-pure water obtained by the NW10VF Water Purification System (Heal Force Development Ltd.,Hong Kong, China) was used as control.
2.3 Training on EEG
The instrument BIOPAC MP160 system was used with the CAP100C (CAP) electrode gel 100 EL254S (shielded 4 mm electrode, TP) and EL254 (unshielded 4 mm electrode, TP). The complete instrumental EEG setup was from BIOPAC System Inc.(California, USA). Subsequently, an EEG pretest was implemented for the participants to examine their EEG signals under various conditions, which included quiet state, shift of opening or closed eyes,swallowing, eye movement, smile, and inner emotional detection. The aim of this was to monitor participants by observing their resting state behavior and emotional fluctuation. In addition, the participants were trained to get familiar with the whole procedure in the preparation stage. In the formal experiment, the total detection process took about 12-13 s including the sample entering process requiring 2-3 s. The participants were asked to rest and stay calm until hearing the start instruction. In particular, participants were asked to keep their eyes closed [22]during the whole process of testing, without expectorating the sample until the instructor asked them to do so or when arriving at the end of the experiment.
Prior to the EEG experiments, the participants were informed about the test name, samples (food grade) and to taste blindly [23].During the test period, the panelists were requested to comply with the instructions. It was important to avoid talking and moving, and to stay relaxed, having a homeostatic breathing and just focusing on the taste and what they are experiencing.
2.4 Procedure of formal EEG experiment
The whole detection device was installed according to the instructions. The subjects wore the CAP and were prepared in a resting state. They breathed deeply and exhaled slowly, at the same time maintaining emotional stability.
In this experiment, eight brain regions were selected [24], i.e.(F3/Cz/A1) (F4/Cz/A2); (F7/Cz/A1) (F8/Cz/A2); (T3/Cz/A1) (T4/Cz/A2);(Fp1/Cz/A1) (Fp2/Cz/A2), to detect umami taste-evoked signals,and to analyze the effect of different regions on taste responses.These eight points selected for the EEG test pertained to the umami responsive regions from results of fMRI [15]. The participants were asked to sip 10 mL of pure water 3 times with recording and stabilize the baseline for less than 30 s. Signal stabilization prior to recording was achieved by an EOL2 placed under the eye for detection of the right eye movement. Then, they will in turn sip 10 mL of the 0.05, 0.12, or 0.26 g/100 mL MSG solution, without swallowing it.Each of the sample solution was kept in the mouth for 10 s, then expectorated [25]. After that, the mouth was rinsed with pure water for 30 s [14]with gentle gargling, which helped to reduce the persistence of taste, so that electrical signals were recorded back near the baseline. After obtaining the baseline stable, the participants would rest for 30 s before starting the next operation to stabilize the baseline [25]. Then, the experiment at each MSG concentration was repeated 10 times and the results were averaged to reduce errors.With this procedure, other positions were recorded for umami taste detection repeating the procedure described above.
《回忆与随想》是曾经作为外交家及天主教司铎的陆徵祥晚年通过在比利时圣安德鲁修道院的几次演讲,而对自己生平重要经历的回忆以及心路历程的思考。
2.5 Statistical analysis
The results of brain signals were captured and processed by the AcqKnowledge 5.0 software. During data processing, the waveform of the original EEG signals was cleaned from the noise caused by eye movement by independent component analysis (ICA). Further data analysis [23]was carried out using SPSS statistic 23 (*P< 0.05,**P< 0.01, ***P< 0.001) to investigate the influence of frequency fromδ-γwaves (1-100 Hz), MSG concentrations. Positions on brain responses to umami were obtained by using three-way ANOVA with Bonferroni pairwise comparison, in which frequency, MSG concentrations and positions were treated as fixed factors. After this,different positions were grouped into left, middle and right area of the brain. Two-way ANOVA with Bonferroni pairwise comparison was used to analyze the influence of left, middle and right regions on brain responses to umami taste, where regions and concentrations of MSG were treated as fixed factors. The unit of results was 10 × nV2/Hz, and the significance was set at 0.05.
3. Results and discussion
3.1 Demographic information of participants
Ten healthy right-handed participants (age: (24 ± 1) years old, 8 females and 2 males, average BMI: (21.3 ± 1.6) kg/m2) were recruited in the study. Written informed consent from all subjects were obtained before the experiment.
3.2 Spectral analysis of frequency
The spectral analysis results of the principal components and the frequency components (δ,θ,α,β,γwaves) within 1-100 Hz were obtained by applying the power spectral density (PSD) analysis [18,26]of the original data, as shown in Fig. 1a. The PSD results at different positions for one randomly selected participant are shown in the Supplementary data (Figs. S1-S8). However, it should be pointed out that the cumulated PSD results of all participants showed peak values at 1-4 Hz (δwave) and 4-8 Hz (θwave) occurring in the low frequency range of 1-100 Hz. The frequencies of the sections (α,β,γwaves) larger than 100 Hz were parallel to the frequencies of thex-axis(transverse axis).

Fig. 1 The spectral analysis results of frequency. (a) An example of frequency bands in PSD analysis selected from one participant at Fp1CzA1.Different concentrations had different responsive activity. All results were related to the same frequency bands of 1-8 Hz, including δ wave (1-4 Hz)and θ wave (5-8 Hz). The peak value appears in the δ wave, which showed the most responsive activity in the brain. (b) Responsive variance differences between 1-4 Hz. The results were in mean ± standard error. Responsive activity from 1-4 Hz with a peak value at 2 Hz showed a significant difference (***P < 0.001) between 2 Hz and other frequencies, though not with 1.5 Hz.
In this study, we collected umami response signals from 10 participants evoked by three different MSG solutions under the condition of single-electrode sampling system [27]. It turned out that,on the basis of the corresponding range of brain regions triggered by MSG, the signals obtained by different single electrodes can be analyzed from the EEG data [28]. The original results of 1-100 Hz frequency can be divided in five components, i.e.δ,θ,α,β,γwaves.Likewise, hand movement before EEG signal measurement also influenced the signals, as this brain area is also responsible for motor activity. The signal distribution of taste stimulation would be masked by the superposition of EEG signals generated by this part of the motor process. When the subjects received the “stop” command, the audition as noise would intervene with the signals in the recordings,so the “stop” command that the subjects heard was at low noise level. However, it was filtered in the processed signals subsequently.The signal superposition interference would also occur in the corresponding brain regions, so the previous signals of sample tasting was discarded and the 5-10 s signal in the middle range of the EEG signal result was extracted as the main analysis component.
3.3 The influence of frequency, MSG concentration and position on brain response to umami perception.
3.3.1 Responsive variance analysis of frequency
After frequency division (δ,θ,α,β,γwaves), the effect of different frequencies (1-4 Hz) on the response of EEG signals was analyzed (Fig. 1b). The results suggested that the frequency had significant impact on brain responses to umami taste (P< 0.001). In addition, there was a significant difference between 2 Hz with other frequencies (P< 0.001, except for 2 and 1.5 Hz (P= 0.2)). Here, the signal response had a maximum value at 2 Hz. Although 1.7 Hz or 1.8 Hz seemed the most responsive frequency, they were not selected without statistical significance (P= 0.2).
Following PSD analysis and frequency spectral analysis,the response signals of umami taste elicited by taste stimulation were preliminarily explored. The results indicated that, compared with pure water (control group), the three concentrations of MSG produced strong energy spectral peaks in the low frequency band(1-8 Hz), while no obvious PSD peaks appeared in other frequency bands (8-100 Hz). It may be that the responsive signals of the taste mainly concentrate near theθandδwaves, which is consistent with the literature [29]that 1-4 Hz is involved in taste coding. The result was consistent with the reference in Table 1 [29-31]and it was reasonable to claim that theδandθwaves in the brain could be triggered by the umami taste evoked by MSG. Therefore, it was confirmed that the frequency range of 1-4 Hz [29]impacted the signals of brain response to umami taste evoked by MSG, which suggested 2 Hz to be most responsive to the activity of the brain in humans related to umami taste.

Table 1Several wave forms of EEG signals and their corresponding coding characteristics.
3.3.2 The influence of umami stimuli concentrations on brain responses to umami taste
Fig. 2 indicates umami taste signals and the significant differences between MSG solutions of different concentrations at 2 Hz. There was a significant impact of MSG concentrations on brain responses to umami taste (P< 0.001). The brain response to water was significantly higher (P< 0.001) than the other three concentrations of MSG solution. In addition, with the increase of MSG concentration,the response signals showed a decreasing trend. There were significant differences found between 0.26 and 0.05 g/100 mL (P< 0.001), 0.26 and 0.12 g/100 mL (P< 0.001), 0.26 g/100 mL and water (P< 0.001),0.12 g/100 mL and water (P< 0.001). However, there was no significant difference between 0.05 and 0.12 g/100 mL (P= 1.0). It has to be pointed out, however, that signal increase or decrease does not mean directly emotional change, though it cannot be excluded that emotion would be affected by the taste sensation subsequently.The mechanism of correlation between emotion and taste needs to be studied further and EEG or other technique may contribute with valuable data to better understanding this phenomenon.
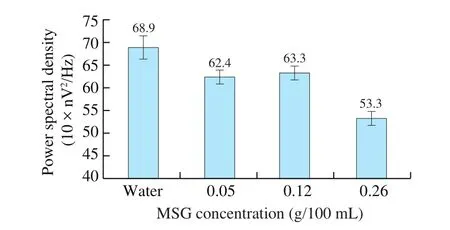
Fig. 2 Responsive variance differences between different concentrations of MSG. The results were in mean ± standard error. Responsive activity showed a decreasing trend with increasing MSG concentrations. Subjects’ responses to water were significantly higher than that of the other three concentrations of MSG solution, and there were significant differences (***P < 0.001).
In terms of response concentration and correlation of sampling points, we observed significant differences between 0.26 and 0.05 g/100 mL as well as 0.12 g/100 mL and water in brain response to umami perception. Moreover, the MSG solution with 0.12 g/100 mL resulted in the greatest responsive value in brain response to umami taste perception, which suggested that the 0.12 g/100 mL MSG solution could evoke stronger brain responses.These conclusions were supported by one-way ANOVA on the data shown in Fig. 2, with the factor samples. Fig. 2 displayed that the activation of brain response has significant difference between water and MSG considering the different concentrations, suggesting that the brain response was probably not solely ascribed to the tastant concentrations in the mouth. The activation produced by water in the various brain regions was differently affected, potentially depending on the effect of thirst [32]. In addition, the medial prefrontal cortex is strongly associated with emotional processing and left hemisphere’s role in negative emotion processing when MSG was as tastant solution in the mouth [33]. We inferred that the results might also be affected by subjects’ unconscious averse emotions with 0.26 g/100 mL MSG in the test. Also, individual differences on sensitivity or acceptability for taste or concentration of umami stimulation are to be considered. Figs. S3, S4, S6 are referring to the left, left, right region of brain, respectively. Regarding Figs. S3, S4, activation produced by water has no significant difference with other concentrations of MSG.Regarding Fig. S6, activation evoked by water in the mouth shows significant difference with other concentrations of MSG, but lower values than the other concentrations because it was probably affected by unconscious aversion of the concentrations of MSG, associated with an inhibited effect in the right brain region.
3.3.3 The analysis of responsive positions-electrodes points
Fig. 3 illustrates the significant differences between the various responsive positions. The data indicate a significant impact of brain regions on brain response to umami taste (P< 0.001). In addition,significant differences were found between Fp1 and Fp2, between F3 and F4, between F7 and F8, between T3 and T4 (P< 0.001).Moreover, F8CzA2, Fp2CzA2 and T4CzA2 showed the greatest response to umami taste but there was no significant difference among F8, Fp2 and T4. This suggested that MSG could trigger stronger brain responses to umami taste at the positions of F8, Fp2 and T4.
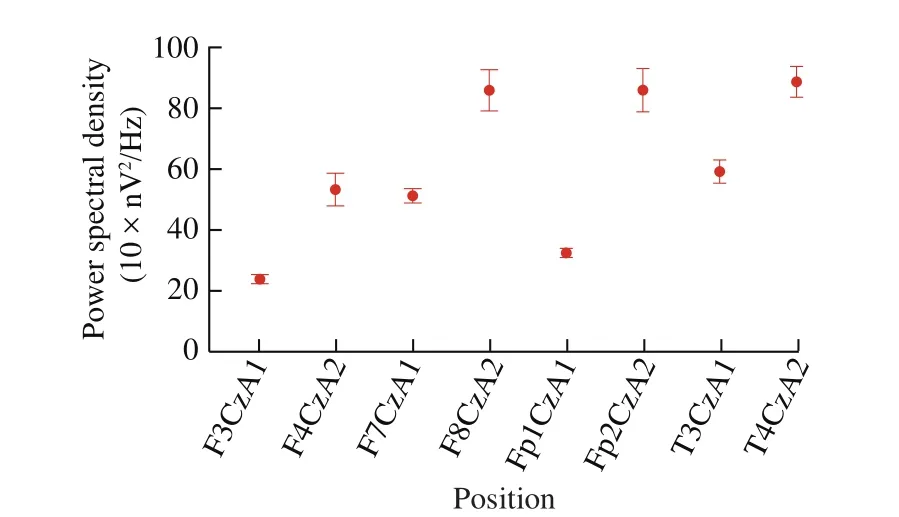
Fig. 3 Responsive variance differences between different positions(F8CzA2, Fp2CzA2, and T4CzA2). The results were in mean ± standard error.Responsive activity in different positions showed that the right side of brain was higher than the left side of brain between Fp1-T4. There were significant differences (***P < 0.001).
Moreover, MSG could trigger diverse responses at different brain positions, and particularly stronger brain responses to umami taste at F8, Fp2 and T4. Thus, we found for the first time evidence for different activation responses of the general brain regions reported [15,34].The prefrontal cortex is a large brain region, in which most of the frontal lobes is covered. As far as emotions are concerned, the left hemisphere contributes to the processing of positive emotions, while the right-hemisphere counterparts are tangled in the processing of negative affective states [33]. Thus, it has been hypothesized that the positions at F8, Fp2 and T4 may be interlinked with the emotional processing systems, which need to be further studied in future work.Brain response and taste response are two different phenomena.Taking umami taste as example, the umami component as ligand is connected to the taste receptor of taste bud cells in the oral cavity,which is functioning as chemical sensor. Here, the signal of taste sensation triggered by the umami chemical was transmitted from taste bud cells to the central nerve system in the brain, then processed through taste cortex, some of which are related to emotional regions.The taste response regarding emotion effects needs to be studied further in order to better understand this phenomenon.
3.4 The influence of left, middle and right brain region on brain responses to umami taste
3.4.1 Impacts of regions
According to the anatomical structure, the brain was divided into 3 brain regions, i.e. left, middle and right as shown in Fig. 4a, in order to analyze the differences in response signals between the three brain regions. Fig. 4b shows the results of the responsive signals between left, middle and right region. There were significant differences in response signals among the three regions (P< 0.001).

Fig. 4 Impacts of brain regions on brain response to umami taste. (a) The region diagram of brain structure. Left region for F7, F3, T3; middle region for Fp1, Fp2; right region for F8, F4, T4. (b) Responsive variance differences between left, middle and right region. The results were in mean ± standard error. Responsive activity in different regions showed that the right region was higher than the middle and the left regions (***P < 0.001), while the middle region was higher than the left region (***P < 0.001).
Particularly, the response signal increased significantly from the left-brain region to the right brain region (right brain area > middle brain area,P< 0.001; middle brain area > left brain area,P< 0.001;right brain area > left brain area,P< 0.001). Thus, these results suggest that the right brain was more responsive to umami signal than the left brain. So far, this phenomenon has rarely been studied directly to understand the effects of right brain activation on umami taste evoked by MSG. There was a significant interaction between MSG concentrations and brain regions in brain responses to umami taste (P< 0.001). There was no significant difference between different concentrations in the left-brain region (0.05vs0.12 g/100 mL,P= 0.5; 0.05vs0.26 g/100 mL,P= 1.0; 0.05 g/100 mLvspure water,P= 1.0; 0.12vs0.26 g/100 mL,P= 0.3; 0.12 g/100 mLvspure water,P= 0.8; 0.26 g/100 mLvspure water,P= 1.0).In the right brain area, significant differences in brain responses to umami taste were observed between different concentrations.There was a significant difference (P< 0.001) between pure water and 0.05, 0.12 and 0.26 g/100 mL, with pure water being the most responsive sample. Furthermore, there was no significant difference between 0.05 and 0.12 g/100 mL, but there existed a significant difference (P< 0.001) in brain responses to umami taste between pure water and 0.26 g/100 mL, of which the response caused by pure water was greater than that by 0.26 g/100 mL. The conclusion was supported by a two-way ANOVA on the data shown in Fig. 5, with brain regions being one factor and concentrations the other factor.As already hypothesized, brain regions where the activation was produced by water in the mouth might be differently affected by the level of satiation with water, i.e. feeling thirsty or fully satiated (no additional desire for water). Thus, in the mid-part of the right insula cortex, the oral delivery of water produced more pronounced effects when the desire for water was higher than the desire for food [32],which might have caused a higher activation of water as compared to 0.26 g/100 mL MSG. It is also possible, of course, that due to the left hemisphere’s role in negative emotion [33], an unconscious emotional aversion was triggered by 0.26 g/100 mL MSG.
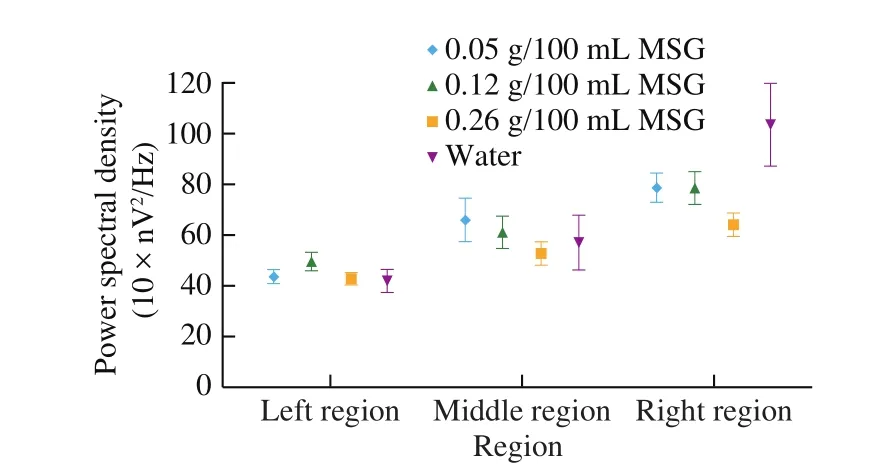
Fig. 5 Responsive variance differences with concentrations between left,middle and right region. The results were in mean ± standard error. Responsive activity in different regions showed no significant differences in the left region.In the right region, significant differences existed between water and 0.05, 0.12,0.26 g/100 mL (***P < 0.001) and water was the maximum value. There was no significant difference between 0.05 and 0.12 g/100 mL, but significant differenceswere observed between 0.05, 0.12 and 0.26 g/100 mL (***P < 0.001).
Our results indicate that there are certain regions in the brain which are responsible for umami taste [15], including the insula (primary gustatory area) and the orbitofrontal cortex (secondary gustatory area) [29]. With different concentrations of MSG, different responsive brain regions can be activated to a different extent. It seems that the responsive activity triggered by MSG at higher concentrations was inhibited (P< 0.001), suggesting it might be a different pattern tuned to sense umami taste in the human brain. Moreover, the brain response to the umami taste evoked by MSG from the left to right region was increasingly significant (P< 0.001), which might be linked with subcortical structures regulating reward and feeding behavior, as well as to somatosensory and visceral areas [29].
3.4.2 Analysis of lateral advantage
In addition, from the brain region point of view, the data suggested a certain degree of laterality. From left to right, the sensitivity of the brain to different concentrations of MSG significantly increased, and the right brain region was particularly sensitive to these concentration changes (Fig. 5). To the best of our knowledge, the result obtained in our study reveals for the first time the relationship between activation of brain response and MSG concentrations.
Interestingly, the right insula brain response to the change of concentrations was more sensitive than the left brain. It was investigated that the results of fMRI in the thalamic region showed bilateral activation following MSG stimulation, with a predominance of ipsilateral processing [35]. Thus, it could stress the neuronal connection specifically related to ipsilateral activation produced by MSG at insula cortex and thalamic cortex. Moreover, there was neither a significant effect of umami taster × training interaction nor effect of training alone on brain activation to umami taste [36].Therefore, the laterality of right brain response to different concentrations was not affected by training in the mouth. To the best of our knowledge, these findings provide further evidence of the role of right brain laterality in the umami taste information coding in human.
There were some limitations in this study. During the whole study, participants associated the 0.05 g/100 mL sample with the umami taste which seemed to be a recognition threshold of MSG.Above this concentration, the samples tested by different participants could be easily distinguished; below this concentration, the taste of low concentration MSG solution described by different participants at the end of the experiment was not obvious to recognize umami or salty. The participants even described it as umami or faintly sweet. If the conscious exclusion method is neglected, and the only thing that need to be taken into account is their perception when tasting umami at low concentrations, participants tend to be preconceived in their scoring process in the traditional sensory tests [37], which may affect the final experimental results. However, if combined with the results of EEG experiments, the analysis error can be reduced. In addition,compared to the responsive signal of pure water, it can be observed that some of the response signals produced in various brain regions with water as reference sample are even larger than those produced by MSG solutions. This may be due to the perception deviation of MSG:when MSG solution is relatively low the concentration does not reach its perceptible concentration level.
It is noteworthy to mention that no professional emotional assessment was conducted in this study, the participants were only asked to complete the experiment in a relaxed and calm state.Consequently, the results might be affected by the emotional processing effect due to an unconscious negative emotional status.Also, the participants were told that the reagent was safe, but the name of the reagent was kept secret temporarily during the test to prevent cognitive involvement until the end of all the experiments. Furthermore,the time period for the EEG test was conducted after 3:00 p.m. and 7:00 p.m. to ensure that the panelists avoid the effect of overlapping cortical representation [38]of gustatory signals and satiety [34]associated with negative experimental emotion on test results.
In general, the information obtained from EEG studies so far is still not comprehensive enough, which requires additional scientific work. Based on our current results, it would be worth in the future studying the interactions between brain and food flavor using EEG.There will be results combining EEG with fMRI to develop the current techniques for quantification and localization. The knowledge about the most significant responsive area to umami taste in the brain that has been identified in this study lays the foundation for further research on the relationship between the intensity of umami taste stimulation and the response intensity [39], and also to better understand the synergistic effects between MSG and nucleotides.
4. Conclusion
In summary, we present evidence of activation in theδ-frequency range as an electrophysiological signal of umami taste evoked by MSG in humans. We observe response differences of brain regions to MSG using scalp-EEG, with the right brain being more responsive than the left region. This may help predicting perceptual decisions and brain response for a better understanding of the relationship between oral and brain sensitivity.
Declaration of competing interest
The authors declare that there is no conflict of interest.
Acknowledgement
This work was supported by the National Natural Science Foundation of China (31972198, 31622042) and the National Key R&D Program of China (2016YFD0400803, 2016YFD0401501).
Appendix A. Supplementary data
Supplementary data associated with this article can be found, in the online version, at http://doi.org/10.1016/j.fshw.2022.04.019.
猜你喜欢
煤气与热力(2021年12期)2021-12-05
内蒙古民族大学学报(社会科学版)(2020年2期)2020-11-06
美文(2018年20期)2018-10-23
金桥(2018年1期)2018-09-28
文史春秋(2017年12期)2017-02-26
人民论坛(2016年8期)2016-04-11
儿童故事画报(2015年8期)2016-01-27
儿童故事画报(2015年8期)2016-01-27
大众考古(2015年7期)2015-06-26
西部学刊(2015年5期)2015-06-08
- 食品科学与人类健康(英文)的其它文章
- Hypoglycemic natural products with in vivo activities and their mechanisms: a review
- Bacteroides utilization for dietary polysaccharides and their beneficial effects on gut health
- Capsular polysaccarides of probiotics and their immunomodulatory roles
- Natural compounds may contribute in preventing SARS-CoV-2 infection: a narrative review
- A comprehensive review on the effects of green tea and its components on the immune function
- A review on current and future advancements for commercialized microalgae species