
Hierarchical Bimetallic Selenides CoSe2–MoSe2/rGO for Sodium/Potassium-Ion Batteries Anode: Insights into the Intercalation and Conversion Mechanism
2022-07-04 09:13YananXuXiaofengLiuHangSuShanJiangJianminZhangandDanLi
Energy & Environmental Materials 2022年2期
Yanan Xu, Xiaofeng Liu, Hang Su, Shan Jiang, Jianmin Zhang, and Dan Li*
1. Introduction
With the ever-increasing demands of electrochemical energy storage,achieving safe, environmentally friendly, low-cost, and sustainable energy have become one of the most common challenges in the future scientific and social development. As the alternatives and supplements to lithium-ion batteries (LIBs), sodium-ion batteries (SIBs), and potassium-ion batteries (PIBs) have aroused growing concern on account of the low-cost, abundance, and uniform distribution of Na and K earth resources,as well as the similar mechanism of energy storage with LIBs.[1-6]
Unfortunately, when compared with conventional LIBs, SIBs,and PIBs exhibit sluggish ion kinetics during electrochemical reactions because of the larger ion radius (Na+: 1.02 ˚A, K+: 1.38 ˚A)than that of Li+(0.76 ˚A).[7-12]Therefore, searching for new highperformance anode materials is urgent. Recently, transition metal chalcogenides (TMCs) have been emerging as a research focus due to the inherent metal characteristics and unique two-dimensional configuration with lamellar structure and high theoretical capacity.[13,14]Importantly, transition metal selenides could better ensure the safety of battery system by avoiding the formation of sodium/potassium dendrites in the low reaction voltage range. In addition, in comparison with traditional transition metal sulfides and oxides, selenides have high electrical conductivity, the large ion insertion interstitial sizes, and weak M–Se bonding, which could increase the reaction activity.[15-20]
MoSe2, as a representative of transition metal selenides, exhibits some extra advantages, including small band gap (about 1.1 eV) and large interlayer spacing, which are beneficial for ions intercalation/deintercalation and thus enhanced electrochemical performance.[21-23]Except for MoSe2,CoSe2is also a promising electrode material for SIBs and PIBs for the same merits of large interlayer spacing and high electrochemical activity.[24-26]In addition, the bimetallic selenides can introduce more defects, expose more active sites, and improve electrical conductivity compared to single metal-based counterparts.[27,28]Above-mentioned materials are considered to be appealing anodes for battery system, though, their electrochemical properties are still limited by the large volume change during reaction.[29,30]To address the issue, a smart strategy is to construct appropriate hierarchical structures, which could buffer the volumetric variation, improve the transport of electrons, and restrain the particle aggregation.[31-33]Furthermore, carbon coating is also an effective approach to keep structural integrity. Reduced graphene oxide(rGO), a two-dimensional (2D) carbon, is regarded as an ideal coating material to build conductive matrix because of its unique compatible properties of large surface area, excellent electrical conductivity, as well as good thermal and structural flexibility.[34-37]
Herein, we design a hierarchical CoSe2–MoSe2tube anchored on rGO network (CoSe2–MoSe2/rGO) for SIBs and PIBs anode material prepared via a hydrothermal approach.The obtained hierarchical material exhibited high-specific capacities of 533.5 mA h g−1after 200 cycles at a current density of 0.1 A g−1(SIBs) and 498.4 mA h g−1at 0.1 A g−1after 60 cycles (PIBs). The high performance of the CoSe2–MoSe2/rGO tubes could be put down to the synergistic effects of CoSe2and MoSe2, hierarchical structure, as well as effective structural buffer effect of rGO coating.
2. Results and Discussion
The formation route of CoSe2–MoSe2/rGO tubes is depicted in Figure 1a. The precursor of CoMoO4wires was prepared in a mixed solution containing Co2+and Mo6+via a hydrothermal reaction treatment. In the following hydrothermal selenization with selenium powder and wrapping procedure by GO, the CoMoO4wires were chemically turned into the hierarchical CoSe2–MoSe2/rGO tubes. The phase of sample was determined using X-ray powder diffraction(XRD).The peaks of the CoMoO4precursor in Figure S1a are in accordance with the XRD pattern of CoMoO4(JCPDS card no.21-0868).As displayed in Figure 1b,the peaks of CoSe2–MoSe2/rGO are indexed to the orthorhombic CoSe2(space group Pnnm (58), JCPDS card no.053-0449) and hexagonal MoSe2(space group P63/mmc (194),JCPDS card no. 015-0029), confirming the coexistence of CoSe2and MoSe2in the hybrids. Figure S2a shows the thermogravimetric (TG)curves of CoSe2–MoSe2/rGO and CoSe2–MoSe2conducted upon air flow.The TG curves of both samples show the similar shapes.The mass increases in range of 200–350 °C could be caused by the oxidation of selenium in CoSe2–MoSe2to form MSexOy(M = Co and Mo),[38,39]and the mass loss above 400 °C is due to the loss of SeO2. For the CoSe2–MoSe2/rGO,a 9.96 wt%content of the rGO is deduced by comparing the TG curve with that of CoSe2–MoSe2.

Figure 1. a) Schematic illustration of the synthetic route for the hierarchical CoSe2–MoSe2/rGO tubes,b) XRD pattern, c) SEM image, d, e) TEM images, f) HRTEM image, g) SAED pattern, and h) elemental mapping images of Mo, Co, Se, and C in CoSe2–MoSe2/rGO.
The Raman spectra of CoSe2–MoSe2/rGO and rGO are displayed in Figure S2b. The peaks around 1342.7 and 1583.2 cm−1are attributed to disorder-induced D band and the graphitic G band,respectively.And the intensity ratio of D and G bands (ID/IG) of CoSe2–MoSe2/rGO is calculated to be 1.16, which is higher than that of rGO, showing an amorphous/disorder characteristic.As shown in Figure S2c,the surface area values of CoSe2–MoSe2/rGO and CoSe2–MoSe2composites are calculated to be 60.5 and 11.01 m2g−1,respectively.The pore-size distribution pattern(Figure S2d)exhibits that the size of most pores existed in CoSe2–MoSe2/rGO is approximately 3.9 nm.The large values of surface area and pore size are beneficial to expose more active sites and facilitate the wetting of electrolyte.
The morphology of CoSe2–MoSe2/rGO tubes was verified through scanning electron microscopy (SEM) and transmission electron microscopy (TEM). Figure S3a displays that CoMoO4precursors are smooth wires with the average length of about 5 μm.The obtained CoSe2–MoSe2intermediate after selenization exhibits rod structure with dense MoSe2nanosheets on the surface of rods (Figure S3b). By contrast, CoSe2–MoSe2/rGO composite shows rough surface due to the in situ hydrothermal selenization treatment, as shown in Figure 1c–e. The high-resolution TEM(HRTEM) image is displayed in Figure 1f, the(102) plane with a lattice spacing of 0.261 nm could be indexed to the hexagonal MoSe2, and the (111) plane with 0.259 nm spacing belonged to orthorhombic CoSe2is also observed. The selected area electron diffraction(SAED) image (Figure 1g) can be ascribed to(111), (031) planes of CoSe2, and (203) plane of MoSe2. The elemental mapping images (Figure 1h) show the element distribution of Mo,Co,Se,and C in the CoSe2–MoSe2/rGO composite.The inductively coupled plasma(ICP)reveals that the molar ratio of Mo/Co is about 1:1.7 in the CoSe2–MoSe2/rGO.
X-ray photoelectron spectroscopy (XPS) was measured to analyze the bond state of CoSe2–MoSe2/rGO tubes (Figure 2). The presence of oxygen in the survey spectrum(Figure 2a)could be attributed to air exposure.For Co 2p spectrum(Figure 2b), the peaks located at 781.3 and 798.3 eV belong to Co 2p3/2and Co 2p1/2of Co2+, respectively. While, the peaks, located at 778.8 and 793.2 eV, are indexed to 2p3/2and 2p1/2of Co3+, respectively, which was formed owing to the oxidation on the surface of CoSe2.The peaks with binging energy of 785.3 and 803.8 eV are related to shake-up satellite.[40-42]The Mo 3d spectrum is displayed in Figure 2c.At 228.4 and 231.5 eV, the peaks correspond to Mo 3d5/2and Mo 3d3/2of Mo4+,[43]and the peaks at 229.6 and 232.6 eV are ascribed to Mo 3d5/2and Mo 3d3/2of MoSe3, respectively.[44]Besides, the peaks at 233.2 and 235.8 eV could be indexed to Mo6+,which might be due to the surface oxidation when exposed in the air.[45]The Se 3d spectrum can be deconvoluted into three peaks at 53.9, 54.5, and 59.7 eV (Figure 2d), referring to Se 3d5/2, Se 3d3/2,and SeOx, respectively.[46,47]Figure 2e displays the XPS spectrum of C 1s. The peak at 284.6 eV is ascribed to the C–C bond, and another at 281.5 and 286.6 eV are assigned to C–Mo and C–OH,respectively.[48]The formation of C–Mo bonding indicates the enhanced electronic coupling within the interface between rGO and CoSe2–MoSe2.[49]As for the N 1s spectrum in Figure 2f, the peaks at 398.6, 399.9, and 401.2 eV could be attributed to pyridinic N, pyrrolic N, and graphitic N,respectively.While the peak at 394 eV belongs to Mo 3p3/2.[50]
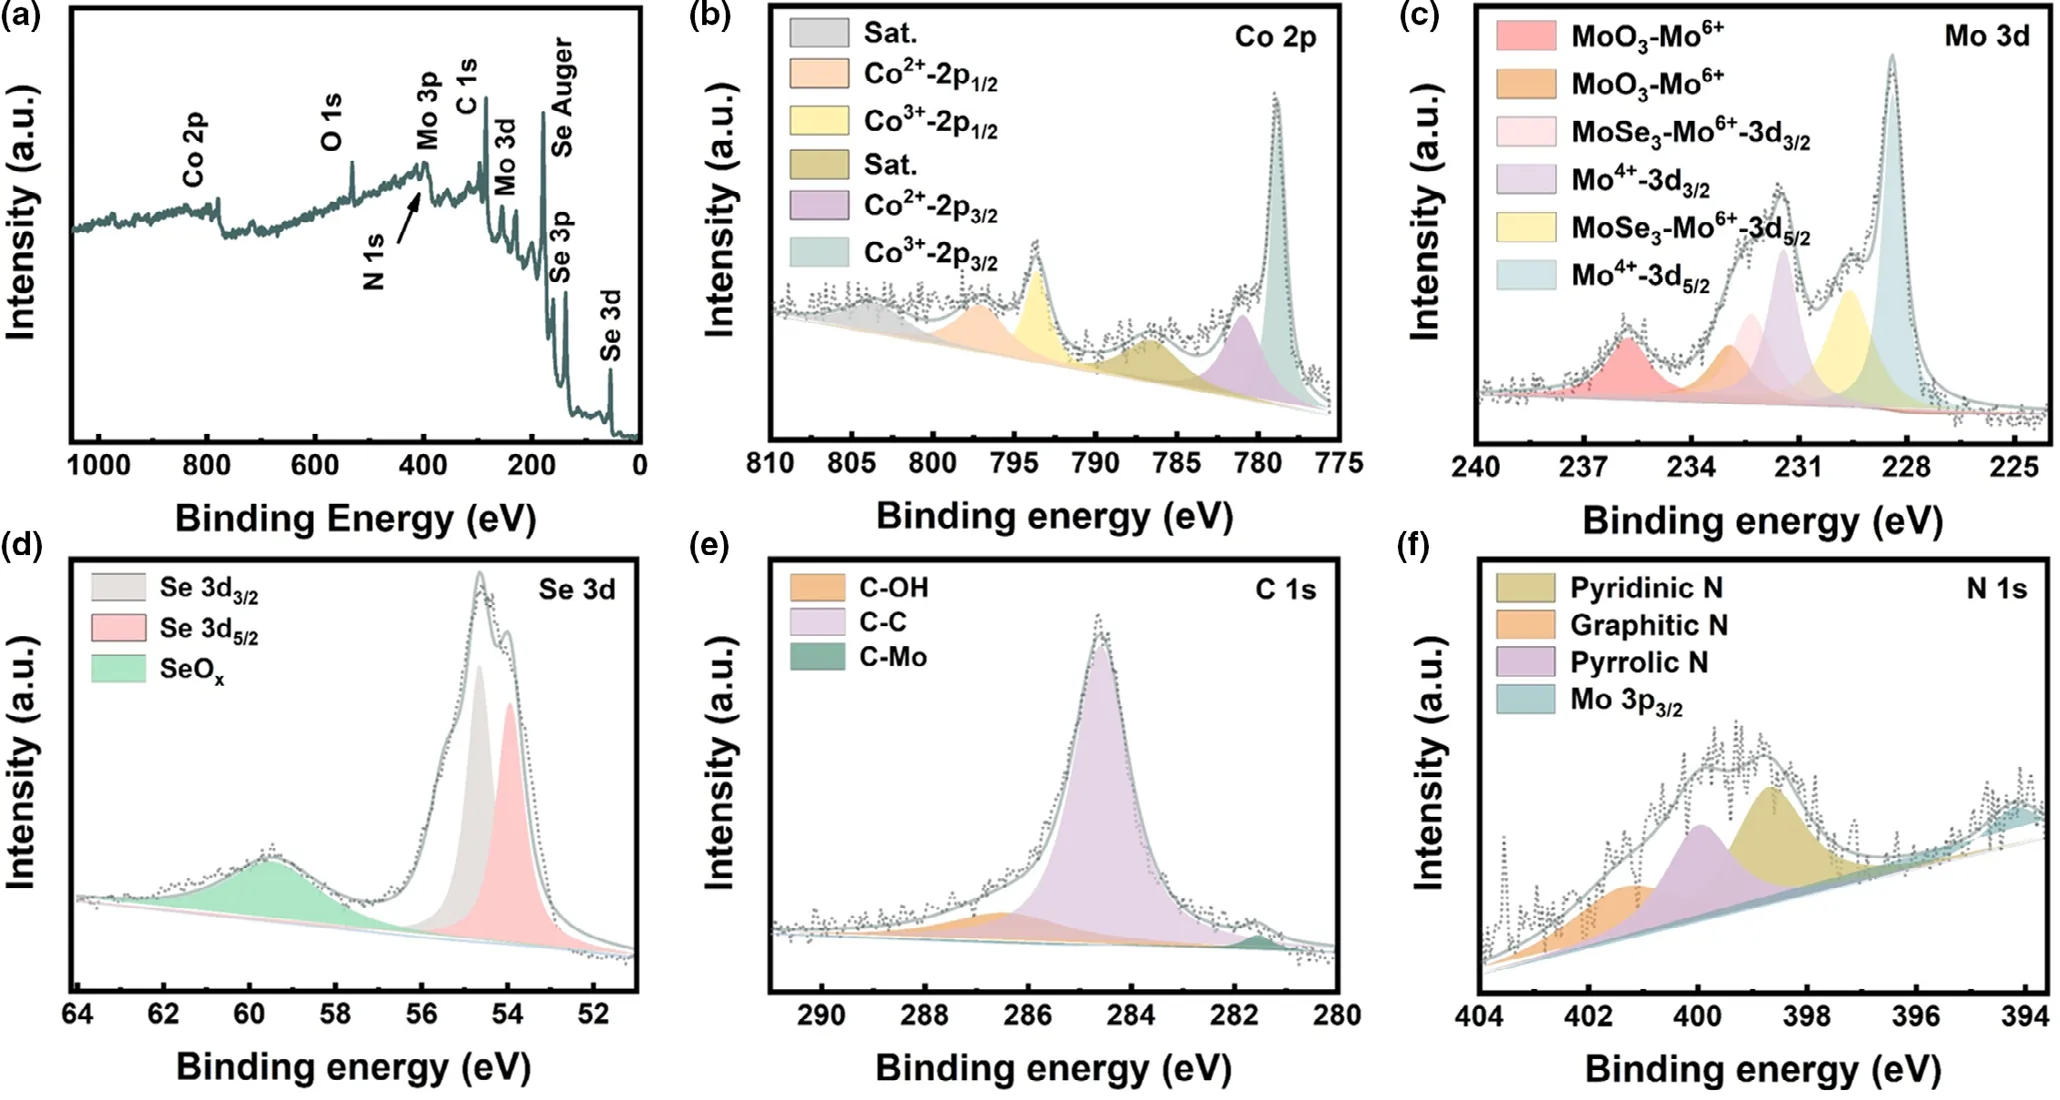
Figure 2. XPS spectra of CoSe2–MoSe2/rGO tubes: a) survey, b) Co 2p, c) Mo 3d, d) Se 3d, e) C 1s, and f) N 1s.
The electrochemical measurements of the hierarchical CoSe2–MoSe2/rGO tubes for SIBs are depicted in Figure 3. Cyclic voltammetry (CV)test was utilized to initially reveal the reaction mechanism of CoSe2–MoSe2/rGO at 0.1 mV s−1(Figure 3a).In the initial discharge process,two peaks at around 1.26 and 0.86 V could be observed,corresponding to the sodiation of CoSe2–MoSe2/rGO to form Co,Mo,Na2Se,as well as solid electrolyte interface (SEI) film. Specifically, the peak located at 1.26 V is ascribed to Na+intercalation into the CoSe2to form NaxCoSe2,and the conversion reaction of MoSe2with Na+to produce MoSeyand Na2Se. At 0.86 V, the peak belongs to the sequential transformation of NaxCoSe2and MoSeyto Co/Na2Se and Mo/Na2Se, respectively. In the following charge process, a peak at 1.94 V could be observed, corresponding to the desodiation reaction. Furthermore, the CV profiles of CoSe2–MoSe2are displayed in Figure S5.The bared CoSe2–MoSe2anode shows the similar electrochemical behaviors with CoSe2–MoSe2/rGO.
Figure 3b compares the rate capabilities of the two samples. The CoSe2–MoSe2/rGO delivered the average capacities of 584, 578.2,551.6, 516.7, and 471.8 mA h g−1at 0.1, 0.2, 0.5, 1, and 2 A g−1,respectively. Remarkably, for CoSe2–MoSe2/rGO, a high capacity of 393 mA h g−1at 5 A g−1was obtained. When the density of current recovered to 0.1 A g−1, the average discharge capacity returned to 550.4 mA h g−1, exhibiting a good reversibility. By contrast, CoSe2–MoSe2exhibited an inferior performance in rate at the identical test conditions, delivering the average capacities of 543.2, 506.8, 480.7,441.9, 315.9, and 148.7 mA h g−1at 0.1, 0.2, 0.5, 1, 2, and 5 A g−1, respectively. The corresponding galvanostatic charge/discharge (GCD) curves at various current densities are present in Figure 3c. Figure 3d displays the differential capacity (dQ/dV) profiles.And the peak potentials are corresponded to the platforms in the GCD profiles exhibited in Figure 3c.In addition,the electrochemical performance of pure rGO is shown in Figure S6. Obviously, rGO exhibited poor performance of cycling and rate.
Figure 3e compares the cyclic stability of CoSe2–MoSe2/rGO and bare CoSe2–MoSe2electrodes at 0.1 A g−1. For CoSe2–MoSe2/rGO, a high discharge capacity of 533.5 mA h g−1could be retained at the 200th cycle. However, CoSe2–MoSe2electrode suffered severe capacity degradation after 50 cycles and the capacity retentions after 100 cycles are merely 25.5%,which could be due to the pulverization of the electrode. The higher capacities of CoSe2–MoSe2/rGO are attributed to the unique hierarchical structure that brings about the adequate active sites,reduced diffusion pathway for ions/electrons, and sufficient contact with electrolyte. The GCD curves of CoSe2–MoSe2/rGO at different cycles(0.1 A g−1) are displayed in Figure 3f. The voltage platforms in the GCD profiles are accorded with the CV curve. Furthermore, the GCD curves of CoSe2–MoSe2are displayed in Figure S7. Figure 3g exhibits dQ/dV profiles of CoSe2–MoSe2/rGO at different cycles corresponding to Figure 3f. From Figure 3f,g, it can be observed that the reductive peaks appeared in the 2nd and 3rd cycles were merged in the initial cycle. The phenomenon can be ascribed to the cathodic peak at 1.15 and 0.75 V are too close to distinctly separate, which could be due to the large particle size of CoSe2–MoSe2/rGO tubes in micrometer distribution.[51]
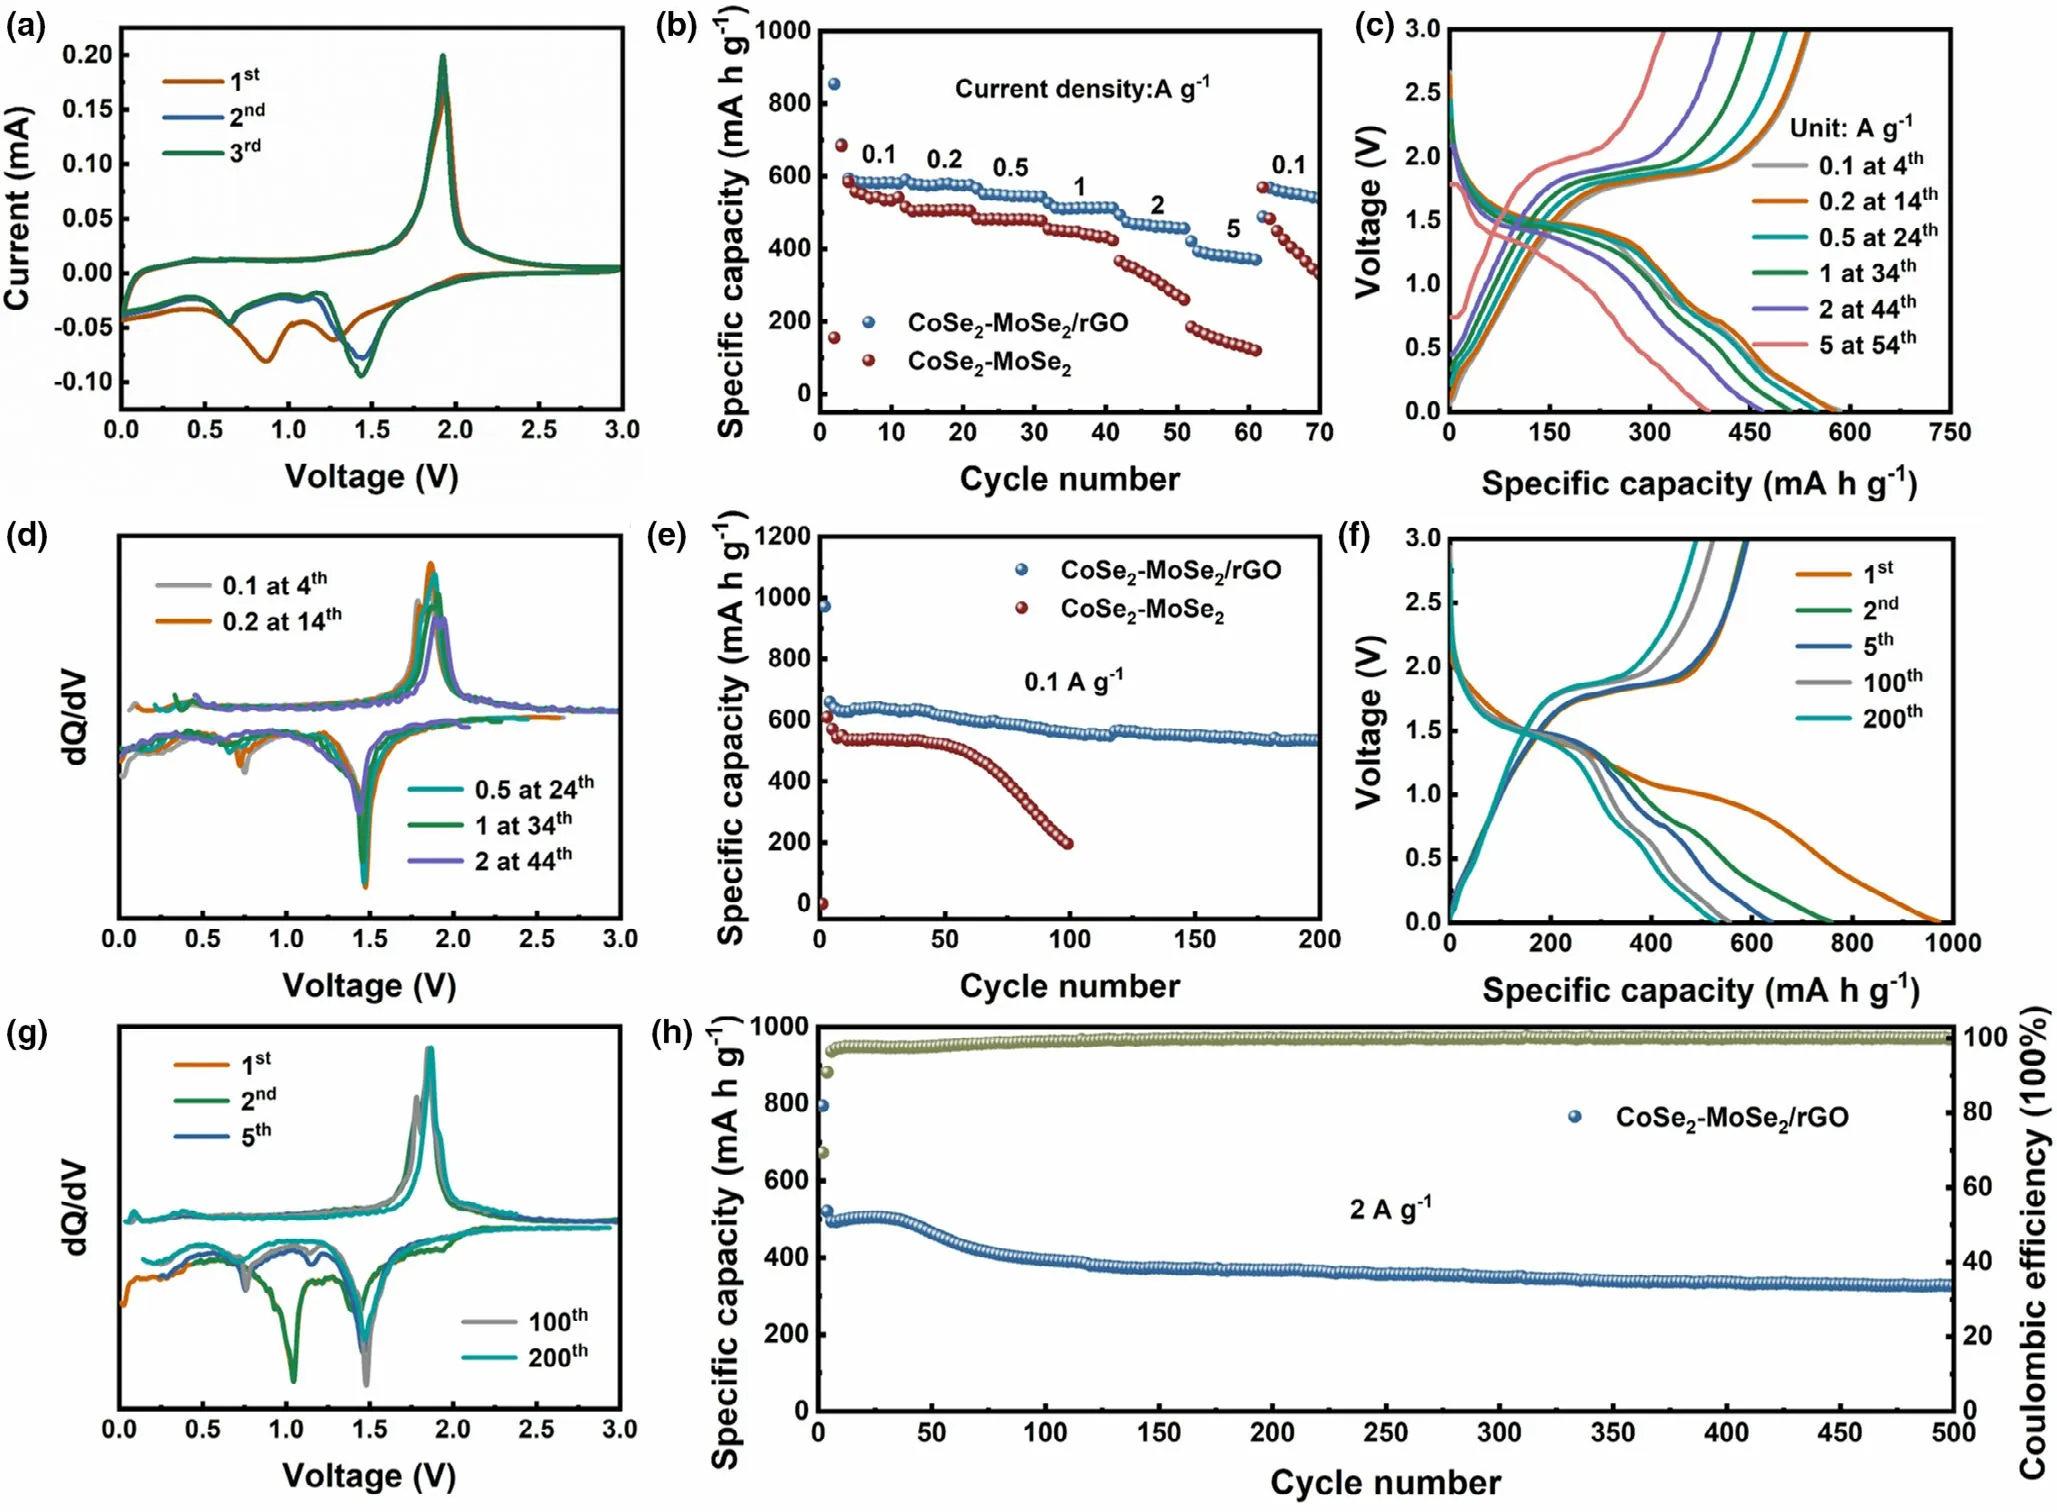
Figure 3. Electrochemical performance of CoSe2–MoSe2/rGO tubes for SIBs: a) CV curves at 0.1 mV s−1, b) rate capability compared with CoSe2–MoSe2, c)GCD profiles at various current densities, d) differential capacity (dQ/dV) profiles correspond to (c), e) cycling performance compared with CoSe2–MoSe2 at 0.1 A g−1, f) GCD profiles at different cycles at 0.1 A g−1, g) differential capacity (dQ/dV) profiles correspond to (f), and h) long-term cycling performance at 2 A g−1.
The long-term cycling performance of CoSe2–MoSe2/rGO tubes is shown in Figure 3h. After 500 cycles, CoSe2–MoSe2/rGO still retained a high capacity value of 326.6 mA h g−1. Compared with CoSe2-and MoSe2-based materials reported in the previous literatures,the CoSe2–MoSe2/rGO tubes exhibit better sodium storage performance (shown in Table S1), which could be attributed to both hierarchical structure and rGO coating. Specifically, the hierarchical structure of CoSe2–MoSe2/rGO could provide abundant active sites,shorten the Na+diffusion pathways, prevent the aggregation of nanoparticles, and facilitate the diffusion of Na+. And the highly conductive rGO coating could promote the electron transfer and withstand the large volume variation stemmed from the sodiation/desodiation reactions, thus ensure the structural robust enough within cycling.[9,14]Furthermore, the synergistic effects of CoSe2and MoSe2could also effectively improve the electrochemical performance of the composite.[52]In addition, the SEM image of CoSe2–MoSe2/rGO tubes in SIBs after 500 cycles at 2 A g−1is exhibited in Figure S8,showing that the morphology of CoSe2–MoSe2/rGO well retained after long-term cycling.
To further get insight into the electrochemical reaction kinetics of CoSe2–MoSe2/rGO tubes in SIBs, the capacitive contribution analyses were conducted by CV tests at various scan rates, as shown in Figure 4a.Furthermore,the relationship of the peak current(i)and the square root of scan rate(v)can be observed in Figure S9.The relationship between i and v is presented as follows:

The value of variable parameter b is deduced by the slope of log(i)/log(v)with a range of 0.5–1.The electrochemical reaction is controlled by ion diffusion if the b approaches to 0.5.While the value nearing to 1 means that capacitive behavior is dominant in the reaction.[53]The acquired b values of anodic and cathodic peaks are 0.86 and 0.94(Figure 4b), respectively, which reveal that the discharge/charge processes of CoSe2–MoSe2/rGO are dominated by the capacitive behavior.The capacitive contribution at various scan rates could be quantitatively calculated via the Equation(2):

in which k1v and k2v1/2represent the participations of the capacitive and diffusion behaviors in the reactions, respectively.[54]As illustrated in Figure 4c, the calculated capacitive contributions are 58.3%, 63.6%, 68.6%, 74.5%, 78.7%, and 80.3% at the scan rates of 0.1, 0.2, 0.4, 0.6, 0.8, and 1.0 mV s−1, respectively. The shaded area in the CV curve shown in Figure 4d stands for the 80.3% of the total capacity at 1.0 mV s−1originated from the capacitive contribution. In addition, the contribution ratios are higher than that of CoSe2–MoSe2(as shown in Figure S10), indicating that the rGO coating introduced more capacitive behavior in sodium storage by the increased surface area.
Figure 4e exhibits the electrochemical impedance spectra (EIS) of the CoSe2–MoSe2/rGO and CoSe2–MoSe2at 0.5 A g−1before cycling and after 100 cycles.In the Nyquist plots,the charge transfer resistance(Rct) of CoSe2–MoSe2/rGO tubes is smaller than that of CoSe2–MoSe2in pristine state,demonstrating its faster interface kinetics of Na+in the composite.As the cycle number increased to 100,the Rctvalues of both electrodes greatly decreased, indicating a continuously activation process of electrodes. The result is attributed to better surface activation and lattice expansion triggering.As shown in Figure 4f,the linear relationship between ω−1/2and Z′is fitted to compare the sodium-ion diffusion coefficients (DNa+) in CoSe2–MoSe2/rGO and CoSe2–MoSe2electrodes based on the following equations:
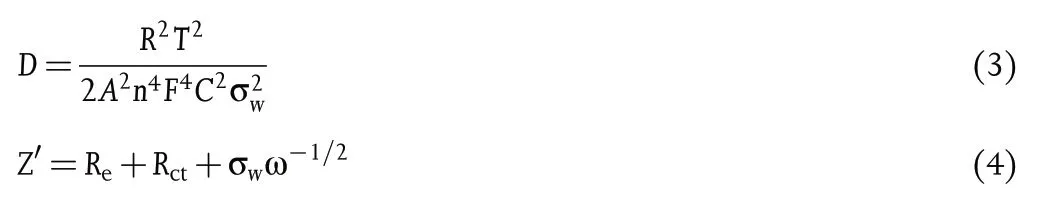
in which σwis the Warburg factor.[55]Figure 4f exhibits that the σwvalues are 117 and 266 for CoSe2–MoSe2/rGO and CoSe2–MoSe2, respectively. The smaller σwvalue of CoSe2–MoSe2/rGO electrode indicates a faster diffusion rate of Na+.
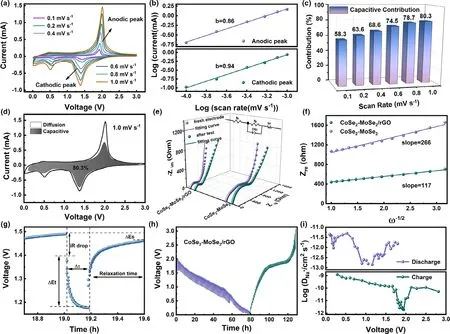
Figure 4. Kinetic analyses of the CoSe2–MoSe2/rGO tubes for SIBs: a) CV curves, b) relationship between log i and log v, c) contributions of capacitivecontrolled capacities, d) capacitive contribution (shaded region) to the charge storage, e) Nyquist plots before and after 100 cycles compared with CoSe2–MoSe2, f) relationship between Z′ and ω−1/2, g) E versus t curve for a single GITT, h) GITT curves, and i) the calculated sodium-ion diffusion coefficients.
Galvanostatic intermittent titration technique (GITT) was employed to give a deep analysis on the sodium reaction kinetics of the anode materials. Figure 4g,h and Figure S10e show the GITT curves of CoSe2–MoSe2/rGO and CoSe2–MoSe2composites between 0.01 and 3.0 V.The DNa+value could be calculated based on the equation:

where τ is the relaxation time,t is the time of duration current pulse,and ΔEsis the potential change of steady state caused by current pulse.As shown in Figure 4g,ΔEtis the potential change during the constant current pulse after eliminating the iR drop.L is the diffusion length of sodium ions.For a compact electrode,L equals to the thickness of the electrode.[56]The plots of the DNa+values of CoSe2–MoSe2/rGO and CoSe2–MoSe2are shown in Figure 4i and Figure S10f, respectively. The CoSe2–MoSe2/rGO anode shows higher DNa+values than that of CoSe2–MoSe2. And the excellent electrochemical properties of CoSe2–MoSe2/rGO tubes are also explained.
To further get insight into the reaction mechanism of the CoSe2–MoSe2/rGO tubes during the sodiation/desodiation processes, in situ XRD, ex situ XRD, and ex situ TEM analyses were systematically conducted as shown in Figure 5.The in situ XRD measurement of CoSe2–MoSe2/rGO was performed during the first cycle at 0.2 A g−1(Figure 5a,b). Notably, the peak at 38.4° belongs to BeO. The XRD peaks located at 30.5°,34.1°,and 35.7°correspond to the(101),(111),and(120) lattice planes of orthorhombic cobalt selenide (CoSe2). Specifically,the three peaks gradually shift toward lower angel within the initial sodiation process(sea green area),suggesting the crystal expansion originated from the Na+intercalation into CoSe2to form NaxCoSe2. In the subsequent sodiation process(khaki area),the three peaks gradually disappear. Meanwhile, a new peak at about 37.3° could be observed,which is indexed to Na2Se(JCPDS card no.01-077-2155).The formation of Na2Se indicates the occurrence of the conversion reaction between CoSe2and Na+.In the desodiation process(lavender area),the peaks of Na2Se gradually weaken and finally disappear(Figure 5b).
The ex situ XRD patterns of CoSe2–MoSe2/rGO give more information of the change of diffraction peaks,as shown in Figure 5c.When the electrode is discharged from open-circuit voltage(I)to 1.5 V(II),the typical peaks of CoSe2disappear.And at 1.1 V(III)and 0.6 V(IV)within discharging process,the characteristic peaks of Na2Se(JCPDS card no.01-077-2155)and Mo15Se19(JCPDS card no.038-0986)can be observed.When discharged to 0.6 V,there is a new peak appears at 47.8°,which could be indexed to metallic Co(JCPDS card no.005-0727).Further discharging to 0.01 V (V), no obvious metal Co or Mo peaks could be observed, which might be attributed to their low crystallinity.[57]At charging state of 1.5 V (VI), the diffraction peaks of Co, Na2Se, and Mo15Se19could be clearly observed.When further charged to 2.3(VII),the diffraction peaks of Na2Se disappear,indicating the conversion reaction occurred within 1.5–2.3 V. At fully charged state (VIII) at 3.0 V,two peaks at 32.5°and 34.5°appear,which could be ascribed to the formation of Mo3Se4(JCPDS card no.01-085-0455)and CoSe2(JCPDS card no.53-0449),respectively.The HRTEM images of CoSe2–MoSe2/rGO at fully discharged(0.01 V)and fully charged(3.0 V)states are displayed in Figure 5d,e.In the HRTEM image of electrode discharged to 0.01 V(Figure 5d), the interplanar spacing of 0.358 ((200) plane), 0.222((110)plane),and 0.340 nm((200)plane)index to metallic Co,Mo,and Na2Se,respectively.At fully charged state of 3.0 V(Figure 5e),no obvious lattice fringe can be observed, which verifies the weakness of peaks in the XRD pattern in Figure 5c.Furthermore,the elemental mapping images of the electrode material at the discharged state at 0.01 V reveal the distribution of Co,Mo,Na,Se,and C,which also confirm the intercalation of Na+at this stage (Figure 5f). In summary, combined with the analyses of CV,in situ XRD,and ex situ XRD,the storage mechanism of the CoSe2–MoSe2/rGO composite is a combination of intercalation (for CoSe2) and conversion (for CoSe2and MoSe2), as shown in Figure 5g,which could be deduced and described as following,
In the discharge process:

The electrochemical properties of CoSe2–MoSe2/rGO tubes were further explored in the PIBs system to disclose its energy storage potential.Figure 6a depicts the CV profiles of CoSe2–MoSe2/rGO at 0.1 mV s−1.Three peaks at 1.85, 0.76, and 0.37 V can be observed in the initial cathodic scan curve.At 1.85 V,the reduction peak could be assigned to the formation of KxCoSe2and KxMoSe2phases by the K+intercalation.The next reduction peak at 0.76 V belongs to the conversion reaction of KxCoSe2and KxMoSe2. The last one at 0.37 V is ascribed to the formation of SEI layer resulting from the decomposition of the electrolyte.In the anodic scan,the peaks between 1.5 and 2.2 V belong to the depotassiation reactions to form CoSe2and MoSe2.
Figure 6b illustrates the rate capability of the CoSe2–MoSe2/rGO tubes. The average capacities of 494.2, 517.9, 526.6, 504.7, 418, and 328.3 mA h g−1were delivered at 0.05,0.1,0.2,0.5,1,and 2 A g−1,respectively,when the density of current recovered to 0.1 A g−1,a high value of capacity of 404.5 mA h g−1could be acquired.The good rate capability indicates the superior K+diffusion and electron transport within the CoSe2–MoSe2/rGO electrode. The cycling performance at 0.1 A g−1is exhibited in Figure 6c,a high capacity of 498.4 mA h g−1was maintained after 60 cycles.Furthermore,after 1000 cycles,CoSe2–MoSe2/rGO still delivered a capacity of 133 mA h g−1at 1 A g−1(Figure S11),showing a good long-term cycling performance.
The CV curves of CoSe2–MoSe2/rGO were acquired conducted at different scan rates(0.1–1.0 mV s−1),showing similar outlines as plotted in Figure 6d.The calculated b values(Figure 6e)are 0.88 and 0.94 for the anodic and cathodic peaks,respectively,implying a capacitive dominant storage behavior. As shown in Figure 6f, the capacitive contributions are 62.7%,67.5%,69.8%,74.6%,77.8%,and 84.1%at the scan rates of 0.1,0.2,0.4,0.6,0.8,and 1.0 mV s−1,respectively.Figure 6g shows 84.1%of the total capacity of CoSe2–MoSe2/rGO originated from the capacitive contribution at 1.0 mV s−1.Figure 6h shows the potential response curves of CoSe2-MoSe2/rGO for both potassiation and depotassiation processes.The plots of the DK+values of CoSe2–MoSe2/rGO are shown in Figure 6i.
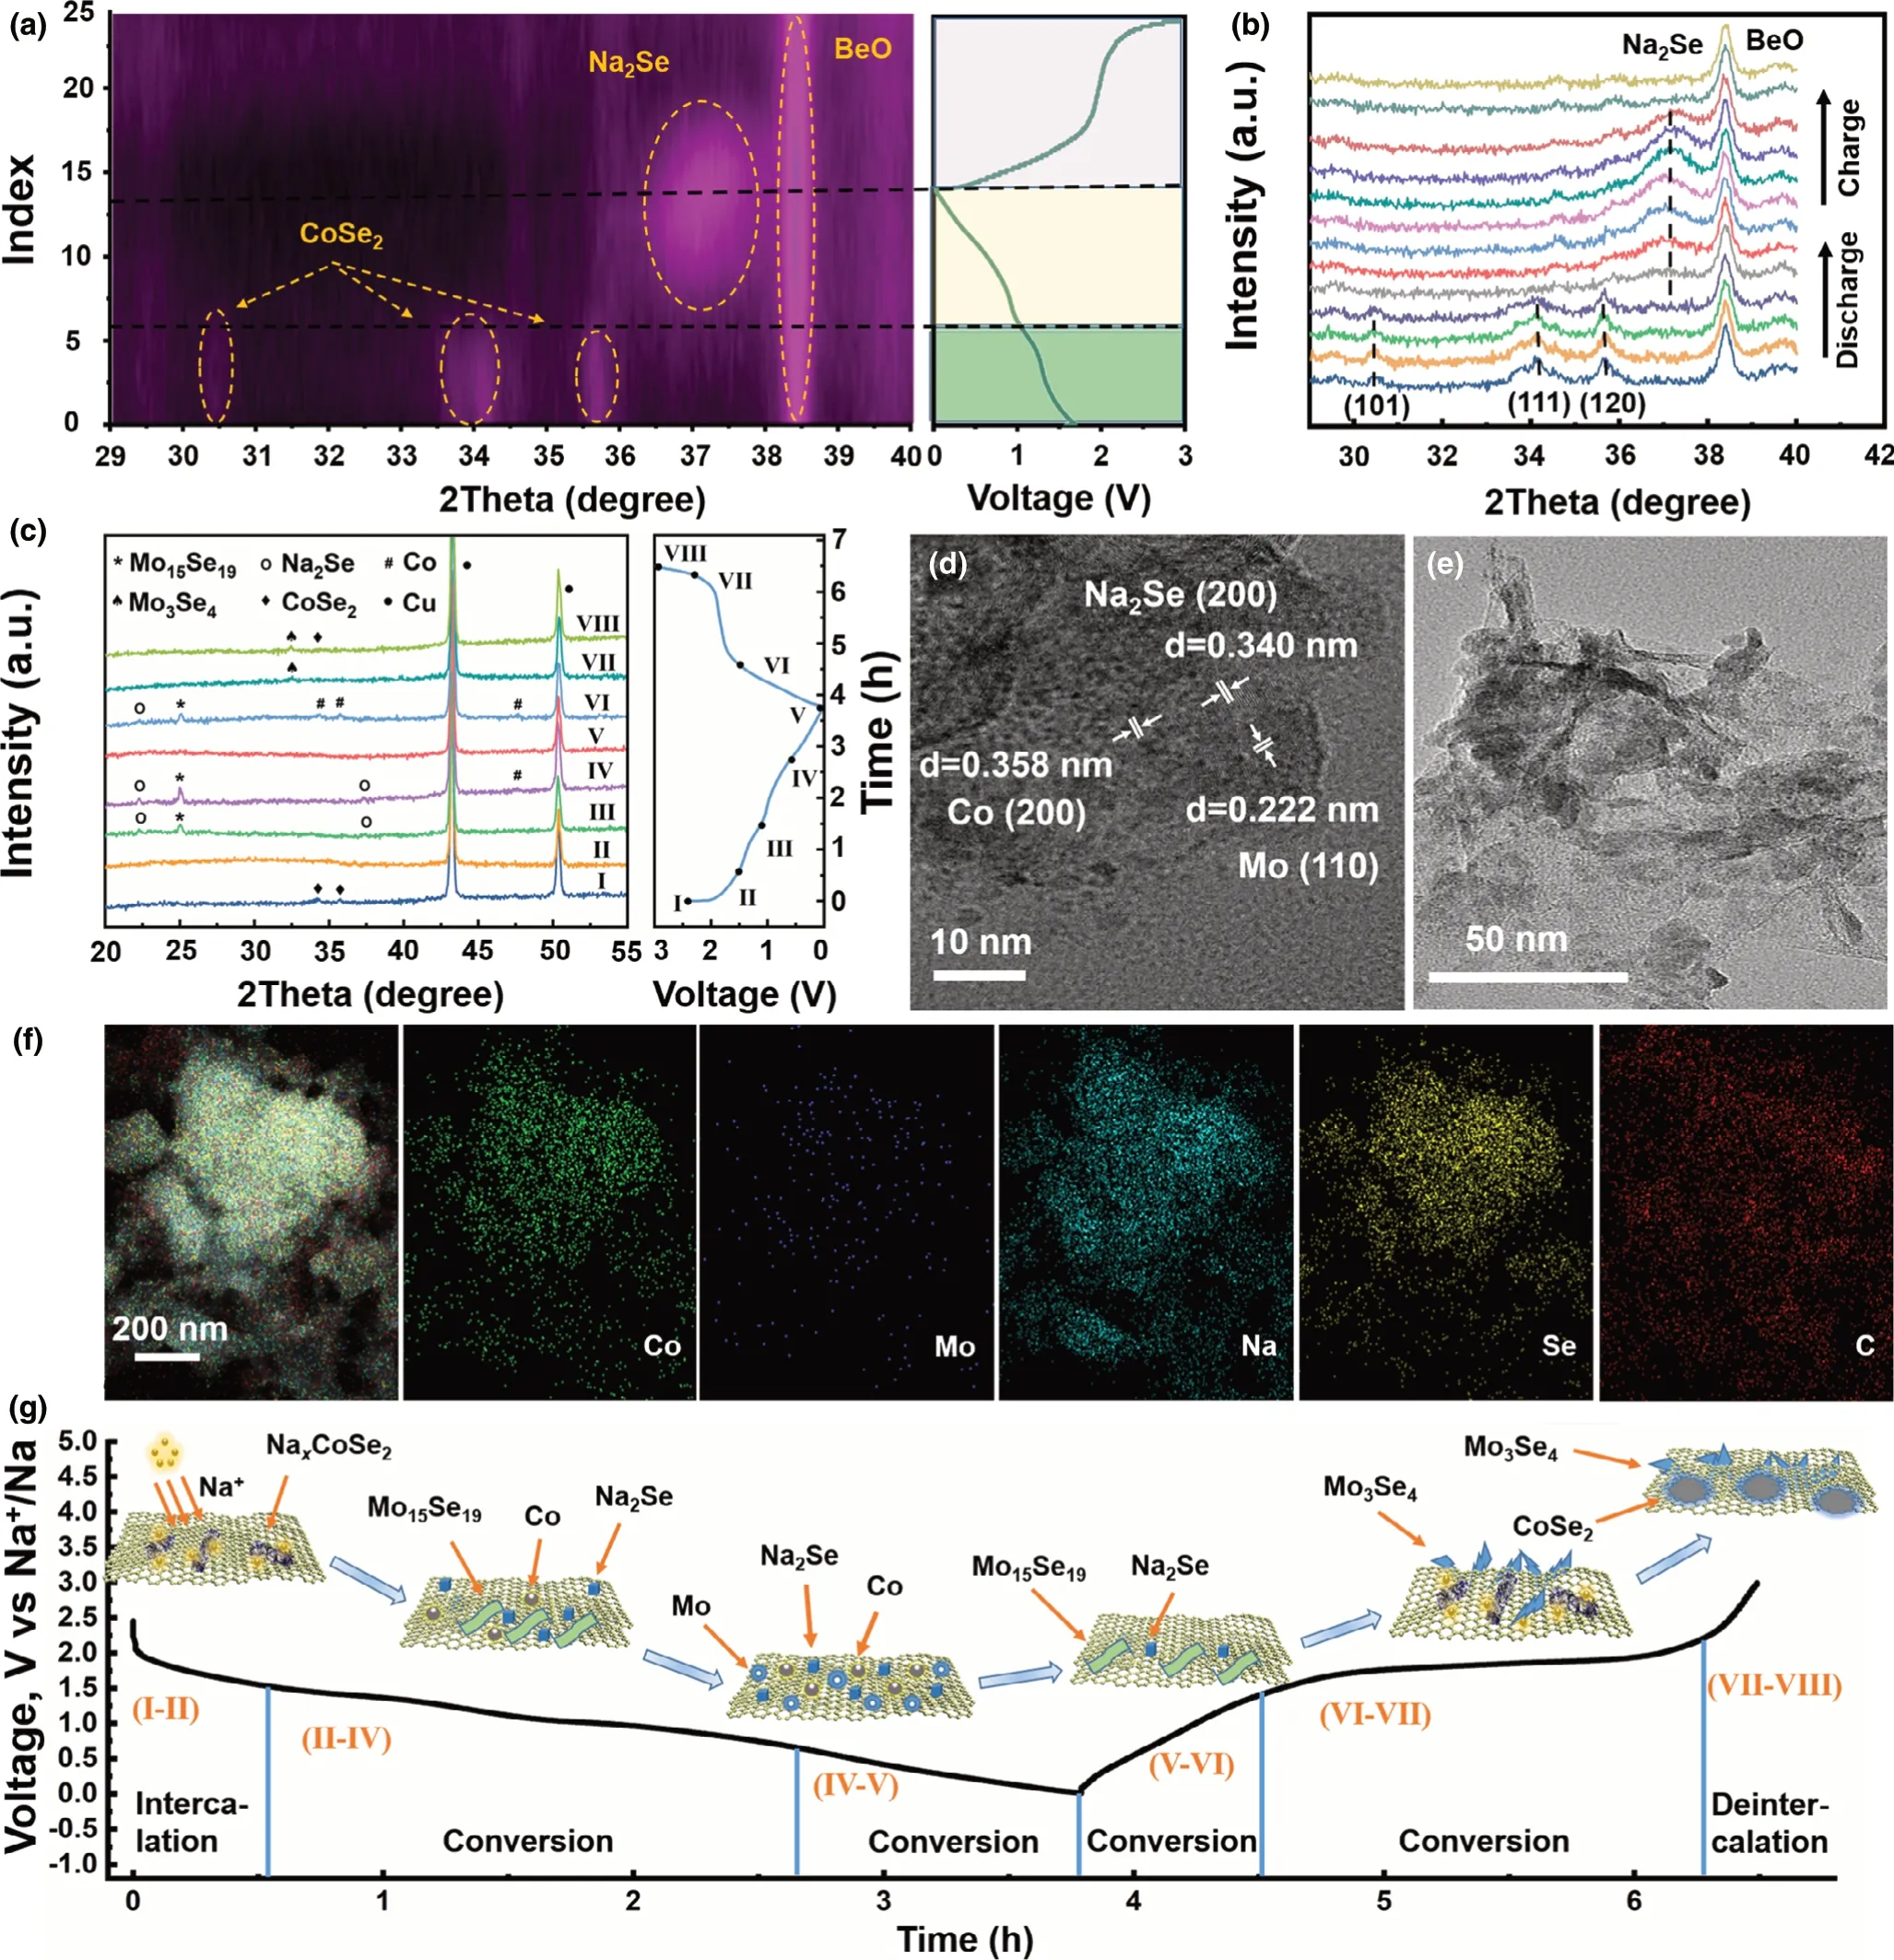
Figure 5. Reaction mechanism investigation of CoSe2–MoSe2/rGO tubes for SIBs: a) in situ XRD patterns in a contour plot for the first cycle at 0.2 A g−1, b)selected in situ XRD patterns at various potential states, c) ex situ XRD patterns at various potential states, ex situ HRTEM images of d) the first discharge to 0.01 V, e) the first charge to 3.0 V, f) elemental mapping images of Co, Mo, Na, Se, and C at discharged state of 0.01 V, and g) schematic illustration of the reaction mechanism at different stages.
Ex situ XRD test was carried out to further explore the mechanism of K+storage, and the diffraction patterns are shown in Figure 7a.When electrode is discharged from open-circuit voltage (stage I) to 1.0 V (stage II), the peaks of CoSe2and MoSe2disappear. At the same time, the peaks of K2CoSe2(JCPDS card no. 01-079-2149), KCo2Se2(JCPDS card no. 01-079-2129), KMo3Se3(JCPDS car no. 036-1323),K2Se5(JCPDS card no. 01-081-1013), and K2Se3(JCPDS card no. 01-071-0235) appear, indicating the intercalation of K+into CoSe2–MoSe2/rGO. Further discharging to 0.6 V (stage III), the peaks of Co(JCPDS card no. 01-070-2633), Mo (JCPDS card no. 01-088-2331),and K2Se3can be observed,suggesting the occurrence of the conversion reaction. When discharged to 0.01 V (stage IV), the peak of Mo disappears,which might be attributed to the low crystallinity.The peak intensity of K2Se3weakens when the electrode is recharged to 1.5 V(stage V).At further charged state of 3.0 V(stage VI),the characteristic peaks of CoSe2reappear.Notably,the characteristic peaks of CoSe2after cycling shift to lower angle compared with that of the pristine electrode, indicating that the interlayer spacing of CoSe2is enlarged after intercalation/de-intercalation of K+. And the expanded interlayer spacing,in turn,is conducive to the further insertion/extraction of K+.
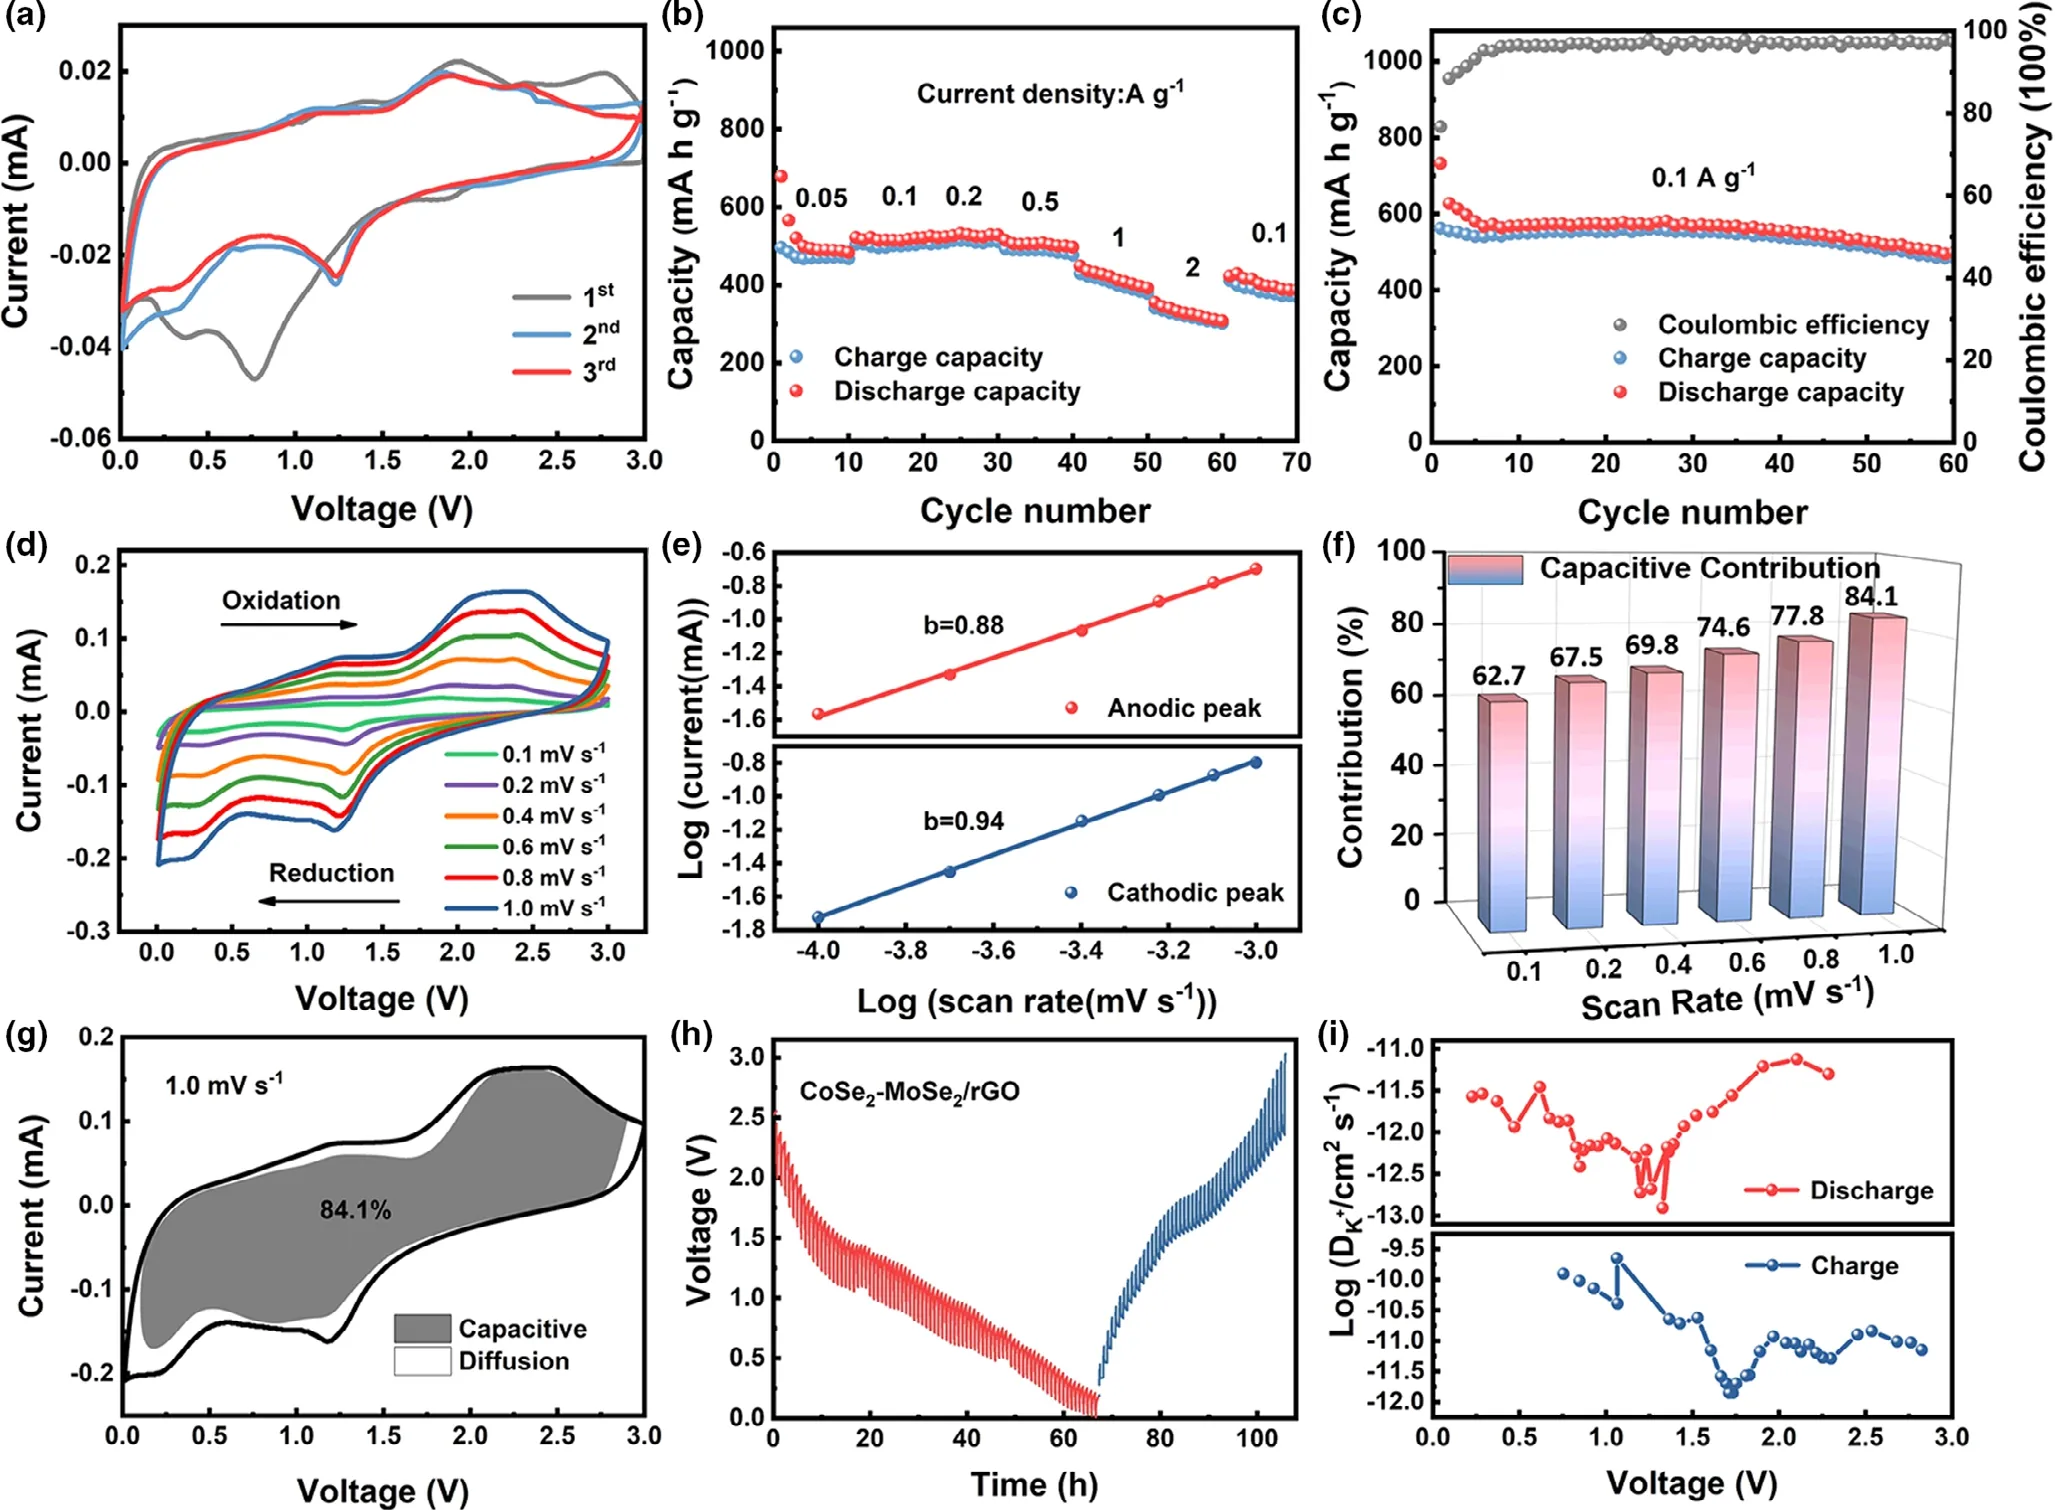
Figure 6. Electrochemical performance and kinetic analyses of CoSe2–MoSe2/rGO tubes for PIBs: a) CV curves at 0.1 mV s−1, b) rate capability, c) cycling performance at 0.1 A g−1, d) CV curves at different scan rates, e) relationship between log i and log v, f) contributions of capacitive-controlled capacities, g)capacitive and diffusion contribution to the charge storage at 1.0 mV s−1, h) GITT curves, and i) the corresponding potassium-ion diffusion coefficients.
In the HRTEM at fully discharged state of 0.01 V(Figure 7b),the lattice fringes are indexed to Co,Mo,and K2Se3.The elemental mapping images also confirm the coexistence of Co, Mo, K, Se, and C at fully discharged state, as shown in Figure 7c. At charged state of 3.0 V, the lattice fringes indexing to CoSe2and MoSe2can be observed in the HRTEM image, as shown in Figure 7d. On the basis of the above analyses, the reaction mechanism for PIBs of CoSe2–MoSe2/rGO can be deduced as follows,
Discharge:


Charge:

3. Conclusion
In summary, CoSe2–MoSe2/rGO has been successfully obtained via a facile in situ hydrothermal selenization treatment. The hierarchical structure offers CoSe2–MoSe2/rGO rich reaction active sites, large surface area, and shortened transport distance for Na+/K+as well as electrons. Furthermore, the uniform coating of rGO nanosheets could increase the electrical conductivity, buffer the large volume change caused by the intercalation/de-intercalation of Na+and K+during the reaction process, thereby retaining the structural integrity and stability of CoSe2–MoSe2/rGO. In consequence, the CoSe2–MoSe2/rGO composite manifests good electrochemical performance for both sodium and potassium storage,including good rate capability and high cyclability.The simple synthesis method and outstanding electrochemical properties make CoSe2–MoSe2/rGO tubes to be an attractive highperformance anode material for battery systems.
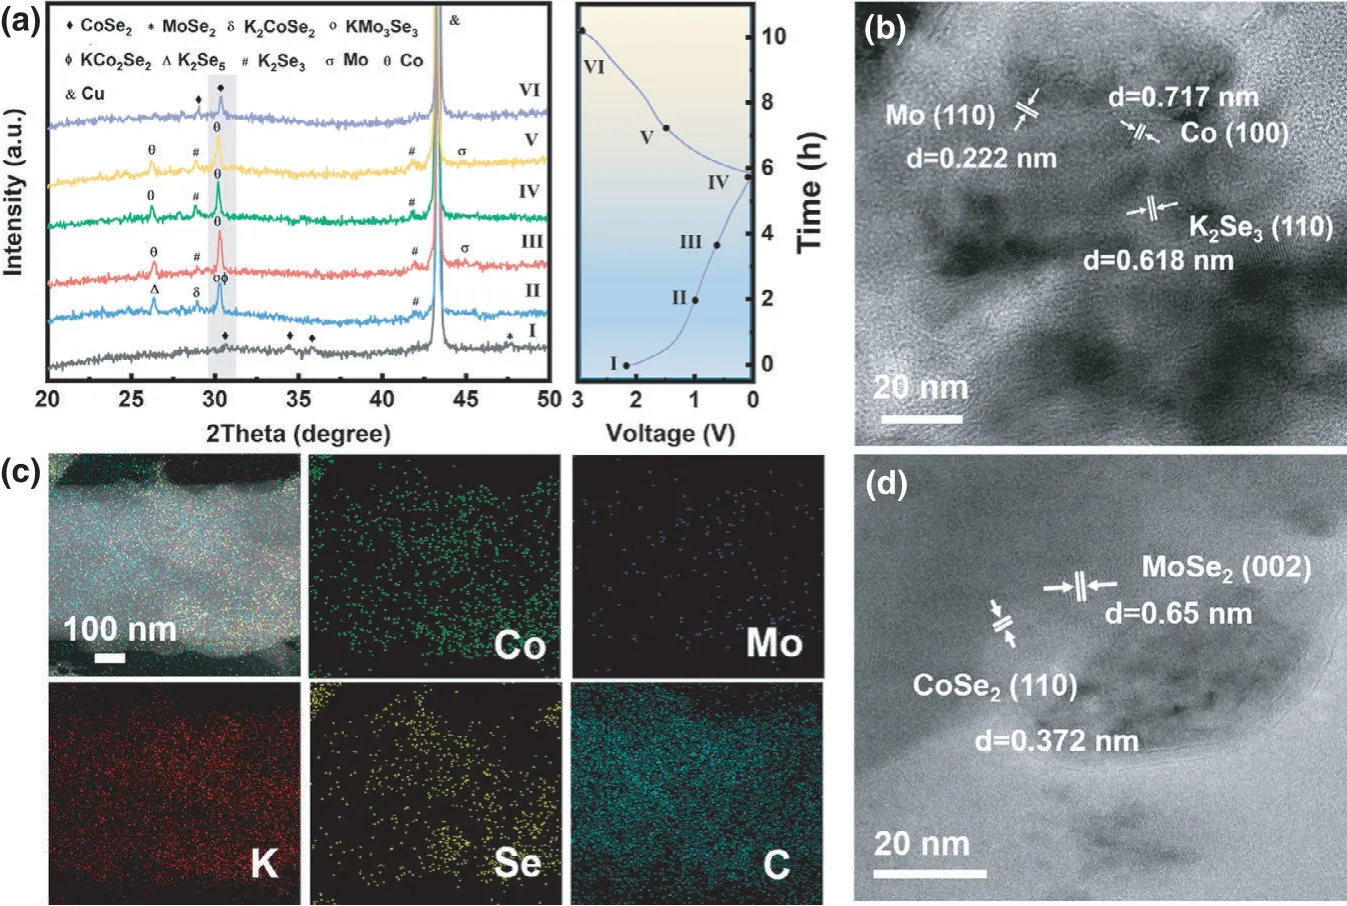
Figure 7. Reaction mechanism investigation of CoSe2–MoSe2/rGO tubes for PIBs:a)selected ex situ XRD patterns at various potential states in the initial cycle,b)ex situ HRTEM image at fully discharged state of 0.01 V, c) the elemental mapping images of Co, Mo, K, Se, and C at fully discharged state,and d) ex situ HRTEM image at fully charged state of 3.0 V.
4. Experimental Section
Materials synthesis:Synthesis of CoMoO4wires: CoMoO4wires were synthesized via a simple hydrothermal process. Typically, 2 mmol of Co(NO3)2∙6H2O and 2 mmol of Na2MoO4∙2H2O were mixed in 40 mL of deionized water under vigorous stirring to form a mixed solution, which was then transferred into a 50 mL Teflon-lined autoclave and maintained in an oven at 180 °C for 12 h. After cooling down to room temperature, the precipitation was collected via centrifugation and washed thoroughly with deionized water before drying at 65 °C for 12 h.Finally,the resulting purple powder was calcined at 350 °C for 2 h with a heating rate of 2 °C min−1to obtain the CoMoO4wires.
Synthesis of hierarchical CoSe2–MoSe2/rGO tubes: Eighty milligram of graphene oxide (GO), prepared based on a modified Hummers’ method,[58]was ultrasound in 64 mL of deionized water for 2 h. Then, 219 mg of the obtained CoMoO4wires was dispersed into the GO suspension under violent stirring.Next,6 mL of hydrazine hydrate solution containing 316 mg of selenium powder was dropwise added into the above mixed solution. Finally, the above-mentioned solution was transferred into a 100 mL Teflon-lined autoclave and kept at 180 °C in an oven for 24 h. After that, CoSe2–MoSe2/rGO tubes were collected after washing and freeze-drying.A graphene-free CoSe2–MoSe2composite was synthesized by a similar method for comparison.
Materials characterization: Crystal structures of the as-prepared samples were measured by X-ray powder diffraction (XRD, Bruker D8 advance, Cu Kα radiation).The morphologies and structures of the composites were examined by scanning electron microscope (SEM, JEOL JMS-6700F) and transmission electron microscope (TEM, JEOL JEM-2010F) at an accelerating voltage of 10 and 200 kV,respectively. The specific surface area and pore-size distribution of the samples were studied by nitrogen adsorption–desorption isotherms (ASAP 2420). X-ray photoelectron spectroscopy (XPS) analyses were conducted using AXIS Supra Imaging X-ray photoelectron spectrometer (Kratos Analytical Ltd. U.K.). The content of rGO in the CoSe2–MoSe2/rGO composite was determined by thermogravimetric analysis (TGA)on a STA449C instrument at air flow with heating rate of 10 °C min−1. Raman spectra were collected on a Labram high-resolution spectrometer with 532 nm wavelength.
Electrochemical measurements: The electrochemical properties of the as-prepared samples were analyzed by assembling CR2032-type coin cells in an argon-filed glove box. Sodium metal and potassium metal were used as the counter electrodes at room temperature.The anode slurry was prepared via mixing the active material, conductive carbon black, sodium carboxymethyl cellulose (CMC), and styrene-butadiene rubber (SBR) with a weight ratio of 80 : 10 : 5 : 5 in deionized water, which was coated on copper foil and then dried at 120 °C overnight to prepare the electrodes. The mass loading on each anode plate was about 1 mg cm−1.A solution containing 1 M NaClO4in a mixture of ethylene carbonate(EC)and dimethyl carbonate(DMC)(1:1 v/v)with 5 wt%fluoroethylene carbonate (FEC) additive was used as the electrolyte for SIBs. And a solution containing of 1 M potassium bis(fluorosulfonyl)amide (KFSI) in EC and diethyl carbonate(DEC)(1:1 v/v)was used as the electrolyte for PIBs.The electrochemical measurements were investigated using LAND CT2001A multi-channel battery testing system under the voltage range of 0.01–3.0 V. Cyclic voltammograms (CV) were acquired by an electrochemistry workstation (CHI660E) at the different scan rates. Electrochemical impedance spectroscopy (EIS) was carried out over a frequency range from 100 kHz to 0.01 Hz on the CHI660E electrochemistry workstation.
Acknowledgements
This study was financially supported by the National Natural Science Foundation of China(Grant No.21701144).
Conflict of Interest
The authors declare no conflict of interest.
Supporting Information
Supporting Informationis available from the Wiley Online Library or from the author.
Keywords
CoSe2, hierarchical structure, MoSe2, potassium-ion batteries, sodium-ion batteries
Received: January 21, 2021
Revised: April 13, 2021
Published online: April 16, 2021
[1] D. Li, H. Wang, T. Zhou, W. Zhang, H. K. Liu, Z. Guo, Adv. Energy Mater. 2017, 7, 1700488.
[2] Q. Zhou, L. Liu, Z. Huang, L. Yi, X. Wang, G. Cao, J. Mater. Chem. A 2016, 4, 5505.
[3] Y. Sun, S. Guo, H. Zhou, Adv. Energy Mater. 2018, 9, 1800212.
[4] B. Jia, Y. Zhao, M. Qin, W. Wang, Z. Liu, C.-Y. Lao, Q. Yu, Y. Liu, H. Wu,Z. Zhang, X. Qu, J. Mater. Chem. A 2018, 6, 11147.
[5] J. Zhu, Y. Dong, S. Zhang, Z. Fan, Acta Phys.-Chim. Sin. 2020, 36,1903052.
[6] Z. Yang, X.-H. Liu, X.-X. He, W.-H. Lai, L. Li, Y. Qiao, S.-L. Chou, M. Wu,Adv. Funct. Mater. 2021, 31, 2006457.
[7] H. Park, J. Kwon, H. Choi, D. Shin, T. Song, X. W. D. Lou, ACS Nano 2018, 12, 2827.
[8] Q. Zhang, J. Mao, W. K. Pang, T. Zheng, V. Sencadas, Y. Chen, Y. Liu, Z.Guo, Adv. Energy Mater. 2018, 8, 1703288.
[9] X. Xu, R. Zhao, W. Ai, B. Chen, H. Du, L. Wu, H. Zhang, W. Huang, T.Yu, Adv. Mater. 2018, 30, 1800658.
[10] Y. Zhang, S. Ullah, G. P. Zheng, X. C. Zheng, D. Li, Chem. Commun.(Camb) 2020, 56, 818.
[11] Y. Liang, W.-H. Lai, Z. Miao, S.-L. Chou, Small 2018, 14, 14.
[12] L. Li, L. Liu, Z. Hu, Y. Lu, Q. Liu, S. Jin, Q. Zhang, S. Zhao, S.-L. Chou,Angew. Chem. Int. Edit 2020, 59, 12917.
[13] S. Li, Z. Zhao, C. Li, Z. Liu, D. Li, Nano-Micro Lett. 2019, 11.
[14] J. Zhou, Z. Luo, L. Wang, G. Fang, A. Pan, S. Liang, J. Mater. Chem. A 2016, 4, 14.
[15] D.Li,J.Zhou,X.Chen,H.Song,ACS Appl.Mater.Inter.2018,10,22841.
[16] Z. Chen, R. Wu, H. Wang, K. H. L. Zhang, Y. Song, F. Wu, F. Fang, D.Sun, Nano Res. 2017, 11, 966.
[17] Z. Ali, M. Asif, X. Huang, T. Tang, Y. Hou, Adv. Mater. 2018, 1802745.
[18] M. Luo, Y. He, C. Dong, X. Ding, C. Yin, Y. Chen, A. Nie, Y. Qian, L. Xu,J. Mater. Chem. A 2019, 7, 3933.
[19] Z. Zhao, Y. Tang, X. Hao, Y. Wei, H. Zhang, Y. Wang, Y. Dong, X. Pan,Y. Hou, X. Wang, J. Qiu, J. Mater. Chem. A 2019, 7, 4469.
[20] S. Lu, T. Zhu, H. Wu, Y. Wang, J. Li, A. Abdelkader, K. Xi, W. Wang, Y.Li, S. Ding, G. Gao, R. V. Kumar, Nano Energy 2019, 59, 762.
[21] Y. Wang, Y. Wang, W. Kang, D. Cao, C. Li, D. Cao, Z. Kang, D. Sun, R.Wang, Y. Cao, Adv. Sci. (Weinh) 2019, 6, 1801222.
[22] H.-N. Fan, Q. Zhang, Q.-F. Gu, Y. Li, W.-B. Luo, H.-K. Liu, J. Mater. Chem.A 2019, 7, 13736.
[23] X. Zhao, J. Sui, F. Li, H. Fang, H. Wang, J. Li, W. Cai, G. Cao, Nanoscale 2016, 8, 17902.
[24] T.Chen,S.Li,J.Wen,P.Gui,G.Fang,ACS Appl.Mater.Inter.2017,9,35927.
[25] C. Dai, X. Tian, Y. Nie, C. Tian, C. Yang, Z. Zhou, Y. Li, X. Gao, Chem.Eng. J. 2017, 321, 105.
[26] Y. Fang, X. Y. Yu, X. W. D. Lou, Adv. Mater. 2018, 30, 1706668.
[27] J. Cao, K. Wang, J. Chen, C. Lei, B. Yang, Z. Li, L. Lei, Y. Hou, K. Ostrikov,Nano-Micro Lett. 2019, 11, 67.
[28] L.-C. Qiu, Q.-C. Wang, X.-Y. Yue, Q.-Q. Qiu, X.-L. Li, D. Chen, X.-J. Wu,Y.-N. Zhou, Electrochem. Commun. 2020, 112, 106684.
[29] H. Liu, B. Liu, H. Guo, M. Liang, Y. Zhang, T. Borjigin, X. Yang, L. Wang,X. Sun, Nano Energy 2018, 51, 639.
[30] Y. Feng, M. Xu, T. He, B. Chen, F. Gu, L. Zu, R. Meng, J. Yang, Adv.Mater. 2021, 33, 2007262.
[31] Y.Zhong,Z.Guo,Y.Liu,C.Mao,G.Li,Chinese Chem.Lett.2017,28,743.
[32] L. Hu, Y. Ren, H. Yang, Q. Xu, ACS Appl. Mater. Inter. 2014, 6, 14644.
[33] Y. Fang, D. Luan, Y. Chen, S. Gao, X. W. D. Lou, Angew. Chem. Int. Edit.2020, 59, 7178.
[34] C. Yang, X. Ou, X. Xiong, F. Zheng, Q. Pan, C. Jin, M. Liu, K. Huang,Adv. Funct. Mater. 2017, 27, 1606242.
[35] X. Wang, X. Li, Q. Li, H. Li, J. Xu, H. Wang, G. Zhao, L. Lu, X. Lin, H. Li,S. Li, Nanomicro Lett. 2018, 10, 46.
[36] X.Wang,K.Chen,G.Wang,X.Liu,H.Wang,ACS Nano 2017,11,11602.
[37] Q. Tan, Q. Xia, Electrochim. Acta 2019, 308, 217.
[38] X. Cao, Q. Su, T. Yu, X. Kong, Y. Wang, J. Chen, J. Lin, X. Xie, S. Liang,A. Pan, J. Mater. Chem. A 2019, 7, 22871.
[39] J. K. Kim, S.-K. Park, Y. C. Kang, J. Mater. Chem. A 2017, 5, 18823.
[40] H.Yin,H.-Q.Qu,Z.Liu,R.-Z.Jiang,C.Li,M.-Q.Zhu,Nano Energy 2019,58,715.
[41] S. Li, C. Li, W. K. Pang, Z. Zhao, J. Zhang, Z. Liu, D. Li, ACS Appl. Mater.Inter. 2019, 11, 27805.
[42] S.-K. Park, Y. C. Kang, ACS Appl. Mater. Inter. 2018, 10, 17203.
[43] Y. Tang, Z. Zhao, Y. Wang, Y. Dong, Y. Liu, X. Wang, J. Qiu, ACS Appl.Mater. Inter. 2016, 8, 32324.
[44] W. Song, K. Wang, G. Jin, Z. Wang, C. Li, X. Yang, C. Chen, ChemElectroChem 2019, 6, 4842.
[45] H. Wang, X. Zhao, Y. Yang, Z. G. Neale, R. C. Mass´ec, J. Cao, W. Cai, J.Sui, G. Cao, Energy Storage Mater. 2018, 12, 241.
[46] H. Liu, H. Guo, B. Liu, M. Liang, Z. Lv, K. R. Adair, X. Sun, Adv. Funct.Mater. 2018, 28, 1707480.
[47] G.Zhang,K.Liu,S.Liu,H.Song,J.Zhou,J.Alloy.Compd.2018,731,714.
[48] M. Zhu, Y. Liu, D. Chen, J. Mater. Chem. A 2015, 3, 11857.
[49] W. Cai, X. Zhao, Y. Yang, X. Song, Z. Neale, H.-E. Wang, J. Sui, G. Cao,Nano Energy 2018, 47, 224.
[50] J. Yang, F. Niu, N. Wang, D. Zhang, W. Fan, J. Yang, Y. Qian, Adv. Funct.Mater. 2017, 27, 1700522.
[51] S. S. Zhang, J. Mater. Chem. A 2015, 3, 7689.
[52] S.-K. Park, S. H. Yang, J. K. Kim, Y. C. Kang, J. Mater. Chem. A 2019, 7,13751.
[53] W. Zhang, X. Li, J. Cai, H. Yan, M. Cui, G. Wu, M. Li, Nano Energy 2019,62, 239.
[54] X. Cheng, Y. Pan, L. Gong, L. Shi, H. Zhang, Nanoscale 2018, 10, 20813.
[55] Y. Liu, X. Hu, G. Zhong, J. Chen, H. Zhan, Z. Wen, J. Mater. Chem. A 2019, 7, 24271.
[56] G. Fang, Q. Wang, J. Zhou, Y. Lei, Z. Chen, Z. Wang, A. Pan, S. Liang,ACS Nano 2019, 13, 5635.
[57] J. Chen, X. Lin, J. Fan, Y. Ma, P. Radjenovic, Q.-C. Xu, L. Huang, S. Passerini, Z. Tian, J.-F. Li, Adv. Energy Mater. 2019, 9, 1902312.
[58] X. Wu, J. Chen, Y. Gong, P. Wang, W. Li, Q. Tan, Y. Chen, Ceram. Int.2017, 43, 4655.
 Energy & Environmental Materials2022年2期
- Energy & Environmental Materials的其它文章
- Progress of Pb-Sn Mixed Perovskites for Photovoltaics:A Review
- Development Strategies in Transition Metal Borides for Electrochemical Water Splitting
- Polymer-/Ceramic-based Dielectric Composites for Energy Storage and Conversion
- Controllable Construction of Bifunctional CoxP@N,P-Doped Carbon Electrocatalysts for Rechargeable Zinc–Air Batteries
- Unveiling the Underlying Mechanism of Transition Metal Atoms Anchored Square Tetracyanoquinodimethane Monolayers as Electrocatalysts for N2 Fixation
- Rational Design of High-Performance Bilayer Solar Evaporator by Using Waste Polyester-Derived Porous Carbon-Coated Wood