
Recent progress on the J-TEXT three-wave polarimeter-interferometer
2022-07-13 00:36YuhanWANG王钰涵LiGAO高丽PengSHI石鹏XinXU徐鑫YinanZHOU周乙楠QinglongYANG杨庆龙ChengyuYANG杨诚宇QinlinTAO陶沁林ChengshuoSHEN沈呈硕YajunWANG汪亚军LuWANG王璐ZhipengCHEN陈志鹏DonghuiXIA夏冬辉ZhongyongCHEN陈忠勇NengchaoWANG王能超ZhoujunYANG杨州军YonghuaDIN
Plasma Science and Technology 2022年6期
Yuhan WANG (王钰涵),Li GAO (高丽),∗,Peng SHI (石鹏),Xin XU (徐鑫),Yinan ZHOU (周乙楠),Qinglong YANG (杨庆龙),Chengyu YANG (杨诚宇),Qinlin TAO (陶沁林),Chengshuo SHEN (沈呈硕),Yajun WANG (汪亚军),Lu WANG (王璐),Zhipeng CHEN (陈志鹏),Donghui XIA (夏冬辉),Zhongyong CHEN (陈忠勇),Nengchao WANG (王能超),Zhoujun YANG (杨州军),Yonghua DING (丁永华),Yuan PAN (潘垣) and J-TEXT Team,3
1 International Joint Research Laboratory of Magnetic Confinement Fusion and Plasma Physics,State Key Laboratory of Advanced Electromagnetic Engineering and Technology,School of Electrical and Electronic Engineering,Huazhong University of Science and Technology,Wuhan 430074,People’s Republic of China
2 United Kingdom Atomic Energy Authority,Culham Centre for Fusion Energy,Culham Science Centre,Abingdon,Oxon OX14 3DB,United Kingdom
Abstract The J-TEXT three-wave polarimeter-interferometer system (POLARIS),which measures timespace distribution of electron density and current density,has been optimized with both the optical system and the equilibrium reconstruction method.The phase resolution of a Faraday rotation angle has been improved from 0.1 to 0.06 degree in chords from -0.18 to 0.18 m(plasma minor radius),and the sawtooth oscillation behavior has been detected by Faraday rotation angle measurement.By combining the POLARIS measured data and the equilibrium and fitting code (EFIT),an upgraded equilibrium reconstruction method has been developed,which provides a more accurate temporal and spatial distribution of current density and electron density.By means of the optimized POLARIS and improved equilibrium reconstruction,variations of profiles with increasing density have been carried out,under both Ohmic and electron cyclotron resonance heating discharges.
Keywords: current density profile,EFIT,polarimeters
1.Introduction
The measurement of current density and electron density profiles are of great important in tokamak physics research.Due to the inaccessibility of hot plasma,it is difficult to obtain information on a magnetic field at the core region,which can derive the toroidal current profile in tokamaks with large sizes.A polarimeter,based on the Faraday rotation effect,is one of the most reliable instruments for measuring core magnetic fields in tokamaks.By utilizing the Faraday rotation effect,the first three-wave polarimeter-interferometer was designed and applied to the Rijnhuizen Tokamak Project(RTP) by Dodel and Kunz [1],and then it was also successfully demonstrated on other devices,such as TEXTOR[2],JET [3],MST [4] and EAST [5].In 2012,a new threewave polarimeter-interferometer was developed on J-TEXT tokamak,providing the chord-integral density and Faraday rotation angle simultaneously.The Joint-TEXT tokamak(J-TEXT) is a medium tokamak with a major radius (R0) of 1.05 m and a minor radius(a)of 0.25-0.3 m.The POLARIS is equipped with three far-infrared lasers at 432 μm,and achieves high resolution in both time (1 μs) and phase (0.1 degree) [6,7].Seventeen equally-spaced measuring chords with 3 cm spatial resolution were applied at the beginning.The seventeen chords are located at-24:3:24 cm(0 cm is the vacuum center,-24 cm and 24 cm are the high-and low-fieldside edges,respectively).In 2020,five new chords are implemented at 10.5:3:22.5 cm,and POLARIS achieves the spatial resolution of 1.5 cm in the low field side (LFS) [8].
The three pumped HCOOH lasers have been working for nearly 10 years,since 2011,and the total output power has been greatly reduced by 45% compared to the original,and the stability of lasers has also deteriorated.In addition,some new diagnostics and auxiliary systems have been established near the detector array and optical path of the POLARIS system,which has brought a complicated electromagnetic environment to the system.Therefore,in order to maintain the high signal-to-noise ratio of the POLARIS system for future experiments,some optimizations have been made recently.The rest of this article describes the methods and results of POLARIS optimization.Optimizations of the optical part of POLARIS system and typical results of the raw data after improvement are given in details in sections 2.1-2.3,and section 2.4 presents the optimization of the equilibrium reconstruction.The application of the optimized POLARIS on experimental research is provided in section 3,and the discussion and summary are given in section 4.
2.Optimization of the POLARIS system
2.1.Improving the power distribution of the three beams
The three-wave polarimeter-interferometer,which consists of two circularly polarized probing beams and one linearly polarized reference beam,can simultaneously provide chordintegral density and Faraday rotation angle.The Faraday rotation angle can be determined by the two probe beams which are counter-rotating and the chord-integral density is calculated by the phase difference of probe and reference beams.The phase shift of electron densityφand Faraday rotation angleψcan be obtained by equations (1) and (2).

where B(z) is the component of the magnetic field parallel to the beam wave-vector,neis the electron density,and λ is the wavelength of beams,in MKS units.ΔφRandΔφLare the phase shift of the right- and left-hand circularly polarized beams,respectively.Obviously,the phase shift of the electron density is much larger than the Faraday rotation angle due to the fact that λ is quite a small value.This indicates that the Faraday rotation angle measurement requires a much higher phase resolution than electron density measurement.Thus,it is better to increase the power of two probe beams than to enhance the reference beam.However,after ten years running,the output power of two lasers serving as probe beams decreased with a larger amplitude than the reference laser.Besides,the total power of three beams has to be attenuated before acquisition to avoid the saturation of the acquisition system.Previously,the attenuation was done at front of the mixer detector,which would decrease the power of all three beams.Recently,in order to optimize the Faraday rotation angle measurement,an improved strategy has been carried out,which is to only attenuate the reference laser near the output port and to keep two probe beams working at maximum power.
Figure 1 shows the power distribution of the three beams,before and after optimization.Obviously,the proportion of#1 and #2 beam power has been increased significantly.Figure 2 presents the frequency spectrum of raw data of mixer output,where the three intermediate frequencies can be seen.ω1(0.9 MHz) is the intermediate frequency between two counter-rotating probe beams,the amplitude of which is significantly enhanced by improving the power distribution of the three beams.In this way,the signal-to-noise ratio of Faraday rotation angle can be improved.In addition,ω2(1.4 MHz)andω3(2.3 MHz)are the intermediate frequencies for measuring the chord-integral electron density,and a decrease of the two intermediate frequencies would have little influence on the density measurement.

Figure 1.The former (a) and new (b) power distribution of three beams,where #1 and #2 are probe beams,and #3 is the reference beam.
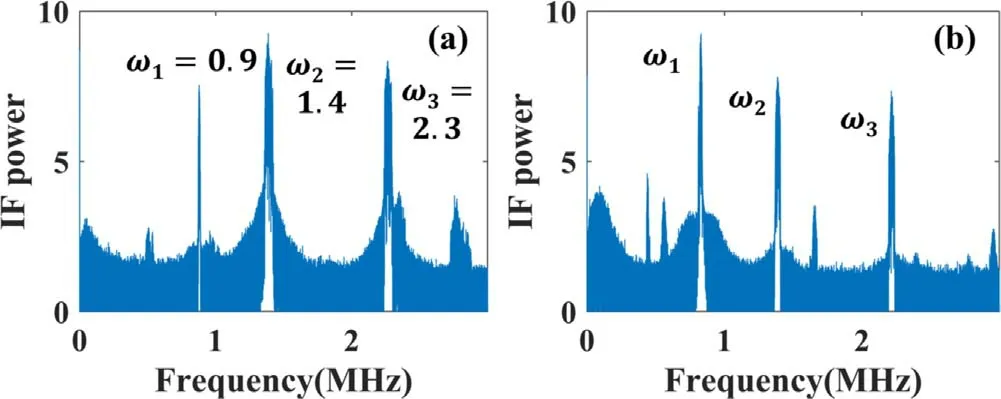
Figure 2.Frequency spectrum of raw data of mixer output before(a)and after (b) improving the power distribution of three beams,ω1 is the intermediate frequency between two probe beams,ω2 and ω3 are intermediate frequencies between probe and reference beams.
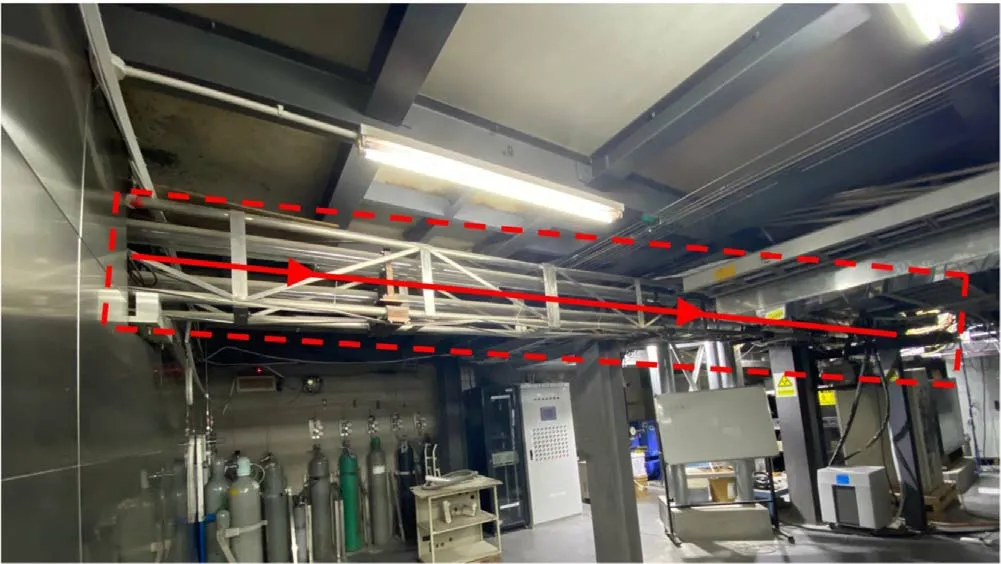
Figure 3.Photo of the optical path from the laser room to the J-TEXT machine.
2.2.Built-up of collinear optical scheme
Collinearity of the two counter-rotating circularly polarized beams is one of the most important prerequisites for achieving accurate Faraday rotation angle measurement in a three-wave polarimeter-interferometer.The collinear error is mainly composed of two parts,and physical principle is described by equation (3):

Whereψis Faraday rotation angle without collinear error,lis beam path in plasma,Δxis the spatial offset of two probe beams,∇neis density gradient between two probe beams in plasma,ΔLis the total path difference,and λ is the wavelength of beams,in MKS units.
One part of the collinear error results from finite density gradients of two probe beam traces in plasma,and a millimeter misalignment would introduce a systematic error equivalent to the magnitude of the measurement [9].The other part of collinear error is caused by total path length difference.Figure 3 presents a part of the optical path from the laser room to the J-TEXT machine.Thus,even a small vibration of optical components would induce significant systematic error if the collinearity is not good enough.

Figure 4.Auxiliary optical scheme for collinear alignment of two counter-rotating circularly polarized beams,(a) far-field and (b)near-field.
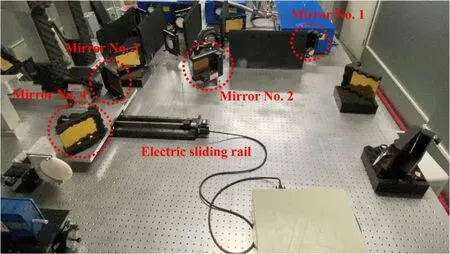
Figure 5.Auxiliary optical layout in laser room.
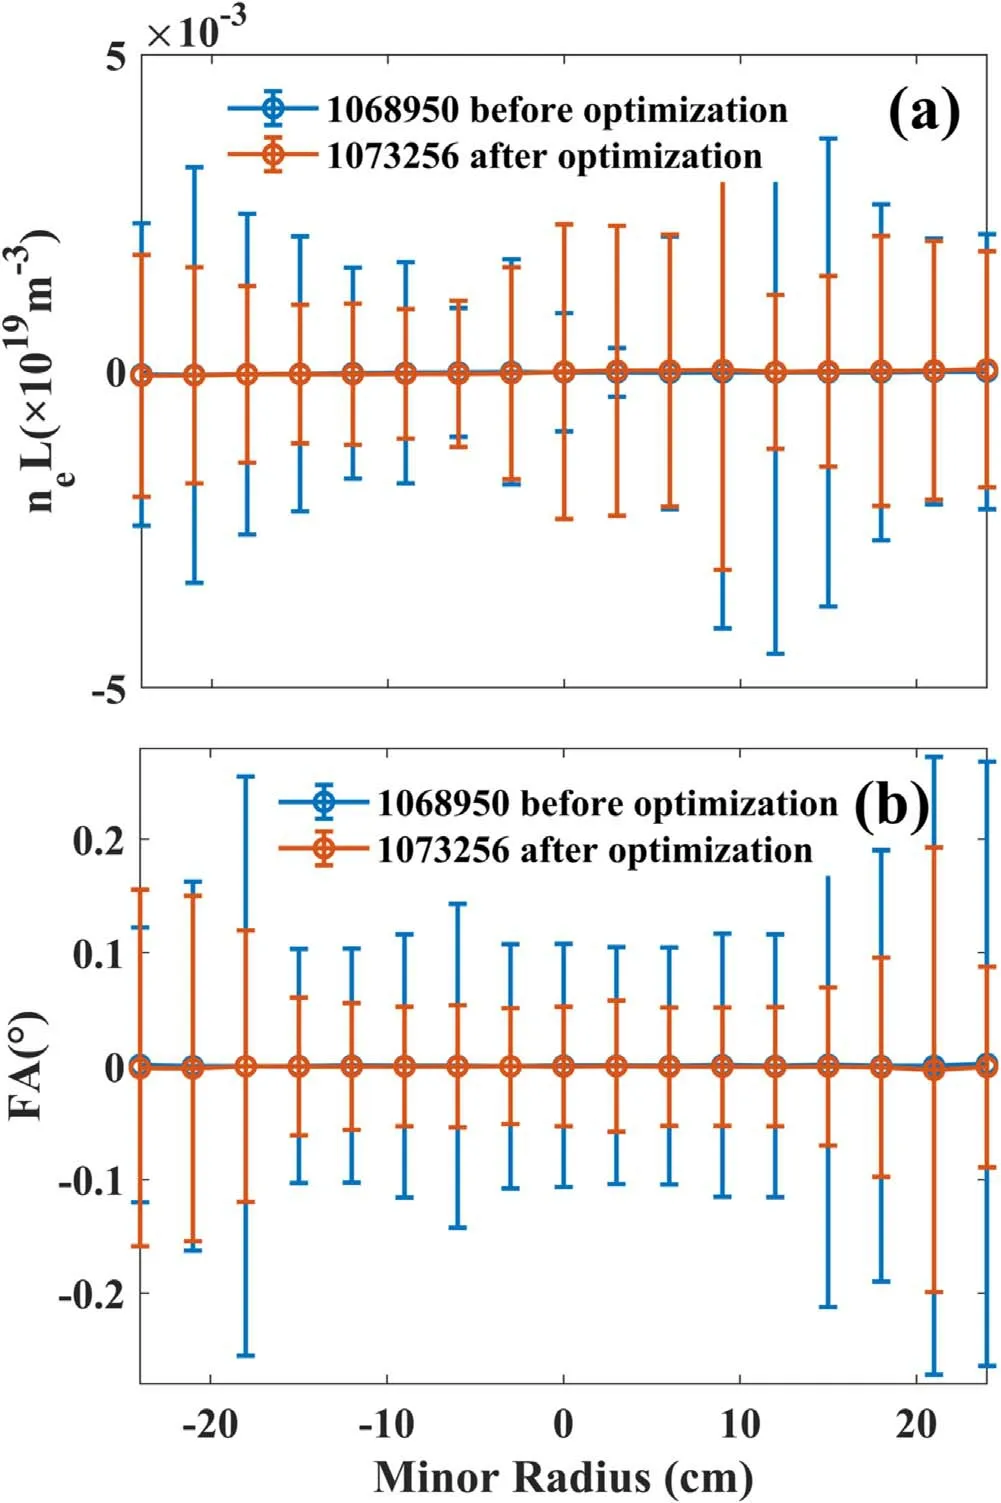
Figure 6.Comparison between the former (blue) and the new (red)phase resolution of (a) chord-integral density and (b) Faraday rotation angle.neL is chord -integral density and FA represents Faraday rotation angle.
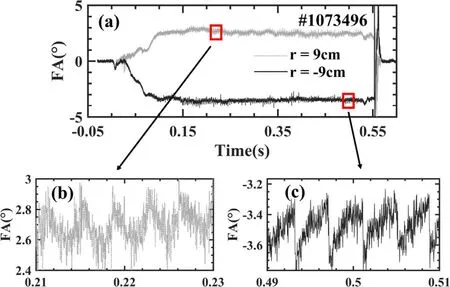
Figure 7.(a) The sawtooth oscillation behavior in Faraday rotation angle signals and detail of sawtooth for(b)r=9 cm(gray dash-line)and (c) r=-9 cm (black solid-line),r is the minor radius.
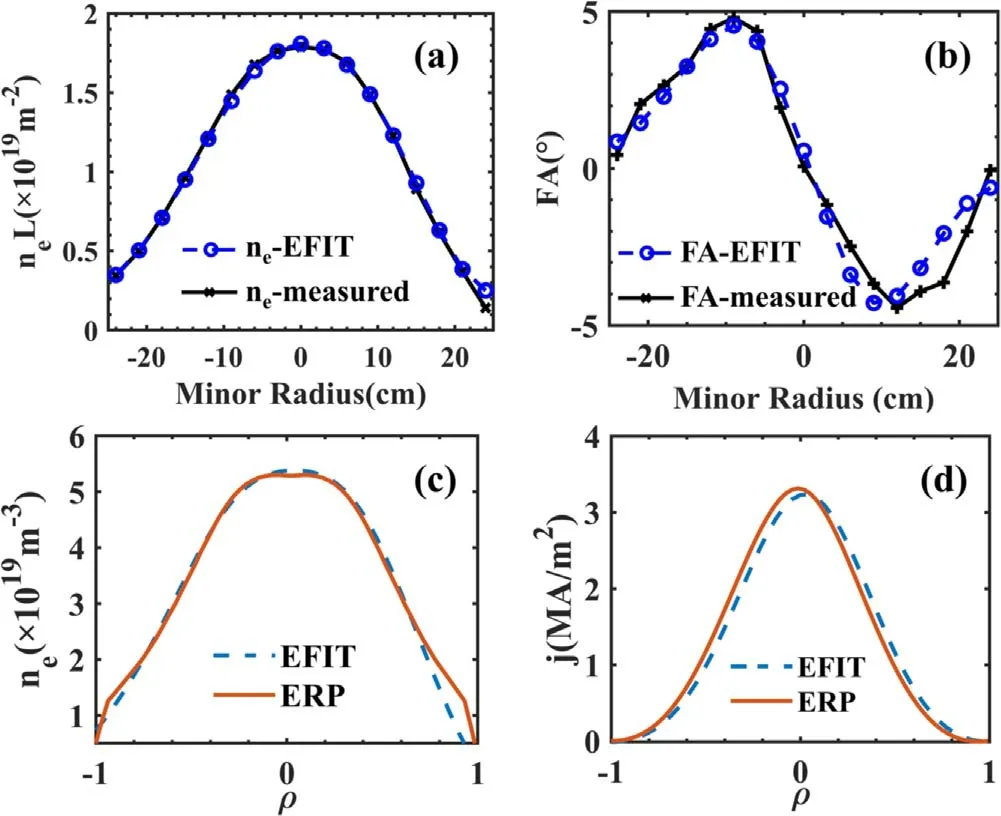
Figure 8.(a) and (b) Inversion transform of chord-integral density,Faraday rotation angle (black solid-line with x symbols) and measured data (blue dash-line with o symbols),(c) electron density profile and (d) current density profile by EFIT (blue solid-line) and ERP (red dash-line).
In order to minimize the collinear error of two probe beams,an auxiliary collinear optical scheme was built up near the laser source and it is shown in figure 4.
This auxiliary optical layout can be switched between far-field and near-field easily by moving mirror No.3 and No.4.Mirrors are installed on an electric sliding rail and can move back and forth in some distances,as depicted in figure 5.A beam analyzer,which is sensitive to the invisible FIR beams,can display the intensity distribution of laser beam by cooperating with the software,Beam Gage Standard.With this auxiliary optical component,a good collinearity can be achieved by adjusting mirror No.1 in the near field and No.2 in the far-field to make sure the two probe beams coincide each other in both near and farfields.
It has also been found that visible light,especially the visible light near the laser sources,would affect the phase resolution of Faraday rotation angle by experiments.The error of turning on the light in the laser room is 0.01° larger than that of turning off the light.Therefore,a further improvement on the accuracy of the Faraday rotation angle has been achieved by using absorbing material to reduce stray light near the J-TEXT device and laser sources.
2.3.Improved system performance
The phase resolution of the measurement can be reflected by the noise level.With the above optimizations on the POLARIS system,the noise level has been reduced,as shown in figure 6.The phase resolution of Faraday rotation angle and chord-integral electron density have been improved.The phase noise of the Faraday rotation angle is ~0.06 degree in the center chords after optimization.
As figure 6(b)shows,the phase resolution of the Faraday rotation angle on center chords has been significantly improved,while the three chords close to the boundary have had few improvements.This is because the beams intensity in the center region is stronger than that at the boundary after being reflected by the parabolic mirror and dividing into multiple chords.In addition,the phase resolution of chordintegral electron density has had few improvements for the power redistribution of three beams.The proportion of the intermediate frequency for measuring chord-integral electron density has been decreased,in order to optimize the measurement of Faraday rotation angle.In actual measurement,the phase of the electron density is much larger than the Faraday rotation angle,so it is completely feasible to sacrifice a part of the phase resolution of the electron density to improve the phase resolution of the Faraday rotation angle.
A high resolution POLARIS system provides great benefits for the study of equilibrium and perturbation of electron density and magnetic field,especially those associated with sawtooth and other MHD activities.Previously,the sawtooth oscillation behaviors were observed only by electron density measurements.Interestingly,it can also be observed on Faraday rotation angle after the improvement of phase resolution,as presented by data of shot 1073496 in figure 7.
2.4.Equilibrium reconstruction by cooperating with EFIT
The POLARIS mainly aims to resolve the radial profiles of safety factors,current density and electron density.Thus,a sophisticated equilibrium reconstruction method is highly important in applications of POLARIS in experimental researches.Previously,a method named as Equilibrium Reconstruction Procedure (ERP) was developed and applied on J-TEXT[10].The ERP firstly calculates the density profile by using chord-integral densities,and then determines the equilibrium flux profile by utilizing the density profile and chord-integral Faraday rotation angle.In this way,the inversion errors of magnetic flux are certainly larger than that of the electron density.In order to improve the accuracy of safety factor q and current profiles,we have recently incorporated the POLARIS measurement with the EFIT [11].The new EFIT method uses the position of limiter to determine the last closed flux surface (LCFS),and the core flux surface is determined only by POLARIS data.Besides,EFIT iterates the electron density and magnetic flux simultaneously,until the results converge.Therefore,magnetic flux shares the same inversion errors to electron density.Figures 8(a)and(b)show the inversion transformation of chord-integral density,Faraday rotation angle and measured data; figures 8(c) and (d)present the comparison between EFIT and ERP inversion results.The inversion results and measured data are wellfitted,which greatly benefit the accurate inversion of the internal flux surface.
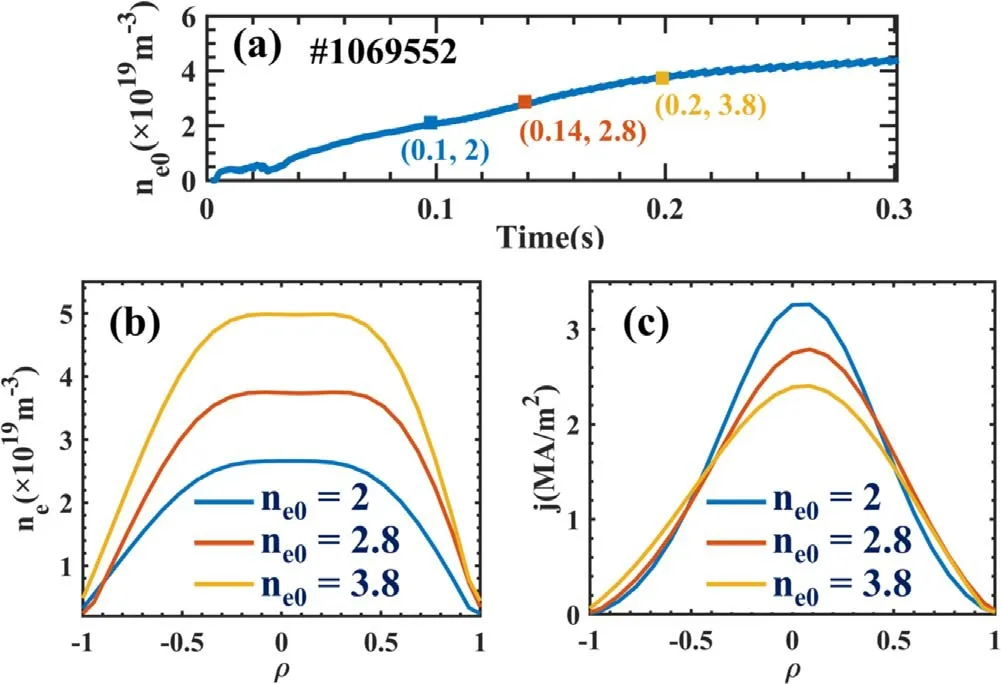
Figure 9.Typical high-density disruption discharge.(a) Time trace of chord-integral density ne0,(b) electron density profile and (c)current density profile at different ne0.ρ is the normalized radius.
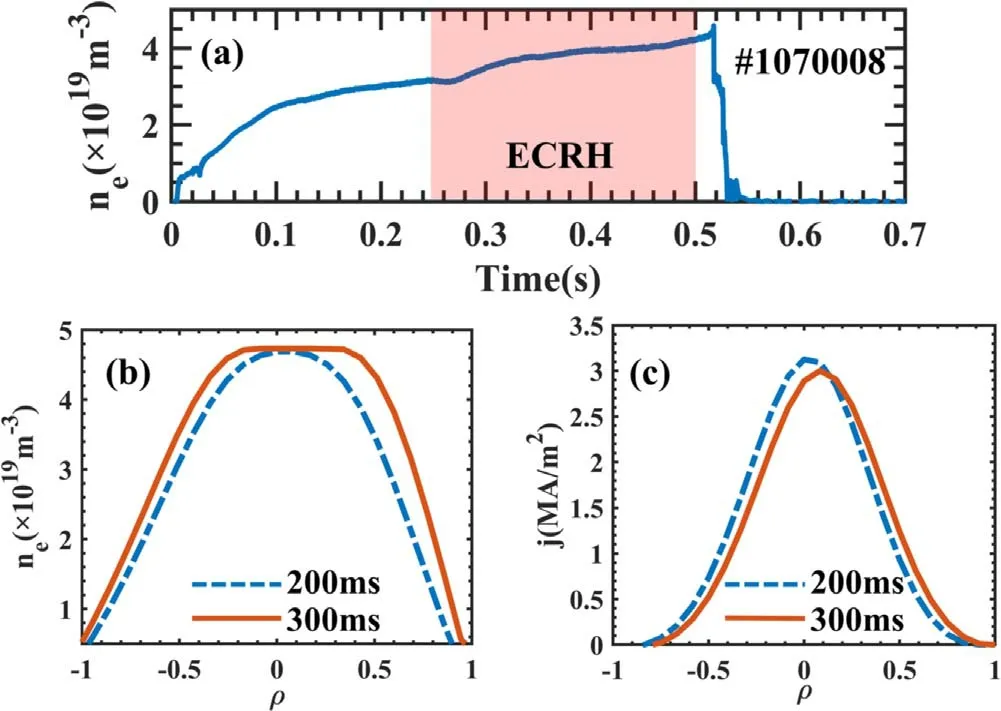
Figure 10.High-density disruption discharge with ECRH from 250 to 500 ms.Time trace of (a) chord-integral density,(b) electron density profile and(c)current density profile for shots 1070008.The dash-dotted line denoted discharge at 200 ms without ECRH,ne0=3×10¹⁹ m-3,and the solid line is at 300 ms with ECRH,ne0=3.5×10¹⁹ m-3.
3.Applications of optimized POLARIS in experiments
3.1.Evolution of profiles in high-density disruption
With the benefits of improved POLARIS,profiles of current density and electron density in high-density disruption discharge have been studied on the J-TEXT.Some interesting features of current density profile variations in high-density disruption are identified by EFIT with measured data supplied by POLARIS.In the high-density plasma shown in figure 9,the current is Ip=180 kA,the toroidal magnetic field is Bt=2 T,and density ramps up to 5.2×10¹⁹m-3until density limit disruption.With the density ramping up,the peak of the electron density profile gradually increases and the current density flattens,as shown in figures 9(b) and (c).
3.2.Effects of ECRH on profiles
The evolution of electron density profile in high-density under Electron Cyclotron Resonance Heating (ECRH) has been carried out in J-TEXT.In the ECRH applied pulse,plasma current is Ip=120 kA,toroidal magnetic field is Bt=1.9 T,the ECRH is switched on from 0.25 s to 0.2 s,with heating power of 320 kW,as presented in figure 10(a).The profiles of electron density and current density affected by ECRH are presented in figures 10(b) and (c).Within 200-300 ms,the plasma density ramps up from 3×10¹⁹to 3.5×10¹⁹m-3.Unlike the peaking tendency with density increasing in Ohmic pulse shown in figure 9,the electron density profile in ECRH pulse tends to flatten significantly,which indicates that a pump-out of particles is induced by ECRH.Meanwhile,the variation of the current density profile with increasing density is similar to the Ohmic case depicted in figure 9(c),inferring that the ECRH has few effects on current density profiles.
4.Discussion and summary
The improved performance of the POLARIS system in J-TEXT has been achieved by optimizing the power proportion of three beams,the collinear of two probe beams and reducing stray lights near the laser source.The phase resolutions of Faraday rotation angle have been improved from 0.1 to 0.06 degree on most chords,and the sawtooth oscillation behavior has been observed on Faraday rotation angle.In addition,the equilibrium reconstruction method has been upgraded from ERP to EFIT,which is combined with the measurement of POLARIS that the calculated Faraday rotation angle and chord-integral density are continuously obtained from the inversion profiles for fitting the measurement parameters during the iterations.By means of the optimized POLARIS and improved equilibrium reconstruction method,the evolution of the profiles in physical experiments have been studied.It has been found that the peaking factor of the electron density profile gradually increases with the plasma density ramping up,while the current density profile evolves to be more flat.The pump out of electron density after applying the ECRH is also observed on the electron density profile.
Acknowledgments
This work is supported by the National MCF Energy R&D Program of China (No.2018YFE0310300) and National Natural Science Foundation of China (Nos.11905080 and 51821005).
ORCID iDs
猜你喜欢
快乐学习报·教师周刊(2022年13期)2022-05-16
外国语文研究(2022年1期)2022-05-12
数学小灵通(1-2年级)(2022年3期)2022-03-17
交通科技与管理(2021年13期)2021-09-10
初中生学习指导·中考版(2021年4期)2021-09-10
考试与评价·七年级版(2020年6期)2020-11-02
考试与评价·七年级版(2020年1期)2020-10-23
声屏世界(2020年3期)2020-05-09
伙伴(2019年8期)2019-09-24
数学学习与研究(2018年7期)2018-05-16
 Plasma Science and Technology2022年6期
- Plasma Science and Technology的其它文章
- Design of the stripping unit and the electromagnetic analysis unit for the E//B NPA on HL-2A/2M tokamak
- Space-resolved vacuum-ultraviolet spectroscopy for measuring impurity emission from divertor region of EAST tokamak
- Development of a combined interferometer using millimeter wave solid state source and a far infrared laser on ENN’s XuanLong-50(EXL-50)
- Bench test of interferometer measurement for the Keda Reconnection eXperiment device (KRX)
- Neutron yield measurement system of HL-2A tokamak
- Study of the fast electron behavior in electron cyclotron current driven plasma on J-TEXT