
Space-resolved vacuum-ultraviolet spectroscopy for measuring impurity emission from divertor region of EAST tokamak
2022-07-13 00:36LiangHE何梁YongcaiSHEN沈永才HongmingZHANG张洪明BoLYU吕波CheonhoBAEHuajianJI计华健ChaoyangLI李朝阳JiaFU符佳XueweiDU杜学维FudiWANG王福地QiupingWANG王秋平XianghuiYIN尹相辉ShunkuanWAN万顺宽BinBIN宾斌YichaoLI李义超andShuyuDAI戴舒宇
Plasma Science and Technology 2022年6期
关键词:万顺
Liang HE(何梁),Yongcai SHEN(沈永才),Hongming ZHANG(张洪明),Bo LYU (吕波),∗,Cheonho BAE,Huajian JI (计华健),Chaoyang LI (李朝阳),Jia FU (符佳),Xuewei DU (杜学维),Fudi WANG (王福地),Qiuping WANG (王秋平),Xianghui YIN (尹相辉),Shunkuan WAN (万顺宽),Bin BIN (宾斌),Yichao LI (李义超) and Shuyu DAI (戴舒宇)
1 Institute of Plasma Physics,HFIPS,Chinese Academy of Sciences,Hefei 230031,People’s Republic of China
2 University of Science and Technology of China,Hefei 230026,People’s Republic of China
3 School of Physics and Materials Engineering,Hefei Normal University,Hefei 230601,People’s Republic of China
4 Institute of Energy,Comprehensive National Science Center,Hefei 230026,People’s Republic of China
5 School of Electrical Engineering,University of South of China,Hengyang 420001,People’s Republic of China
6 Anhui Spectreation Instrument Co.Ltd,Hefei 230088,People’s Republic of China
7 National Synchrotron Radiation Laboratory,University of Science and Technology of China,Hefei 230029,People’s Republic of China
8 School of Physics,Dalian University of Technology,Dalian 116024,People’s Republic of China
Abstract The measurement of impurity distribution in the divertor region of tokamaks is key to studying edge impurity transport.Therefore,a space-resolved vacuum-ultraviolet(VUV)spectrometer is designed to measure impurity emission in the divertor region on EAST.For good spectral resolution,an eagle-type VUV spectrometer with 1 m long focal length with spherical holograph grating is used in the system.For light collection,a collimating mirror is installed between the EAST plasma and the VUV spectrometer to extend the observing range to cover the upper divertor region.Two types of detectors,i.e.a back-illuminated charge-coupled device detector and a photomultiplier-tube detector,are adopted for the spectral measurement and high-frequency intensity measurement for feedback control,respectively.The angle between the entrance and exit optical axis is fixed at 15°.The detector can be moved along the exit axis to maintain a good focusing position when the wavelength is scanned by rotating the grating.The profile of impurity emissions is projected through the space-resolved slit,which is set horizontally.The spectrometer is equipped with two gratings with 2400 grooves/mm and 2160 grooves/mm,respectively.The overall aberration of the system is reduced by accurate detector positioning.As a result,the total spectral broadening can be reduced to about 0.013 nm.The simulated performance of the system is found to satisfy the requirement of measurement of impurity emissions from the divertor area of the EAST tokamak.
Keywords: impurity measurement,vacuum-ultraviolet spectrometer,EAST divertor
1.Introduction
The study of divertor physics is one of the most important issues for improving tokamak fusion plasma performance,and it includes heat load on the divertor,stable radiative divertor operation,impurity transport in the divertor region,and the effect of resonant magnetic perturbation (RMP) on plasmas [1,2].Spectroscopic diagnostics are an efficient method to study the behavior of impurities in the divertor region.In recent years,with the increase of edge plasma parameters in EAST,impurity emissions in the divertor area are mainly in the vacuum-ultraviolet (VUV) band.It is not possible to observe the divertor region on EAST using existing VUV spectroscopy due to the limitation of the long horizontal port[3].Therefore,it is necessary to develop a new spatially resolved VUV spectrometer for the impurity profile in the EAST divertor region.Considering typical EAST plasma parameters,emissions from the injected impurity seedings are mainly located near the X-point in the divertor region during the radiative divertor operation.Therefore,the measurement of the impurity radiation and profile near the X-point is also very important for stable radiative divertor operations.In addition,previous studies have shown that RMP is an effective way to suppress impurity accumulation in the plasma [4,5].According to the simulation results with impurity transport code EMC3-EIRENE,the impurity profile from the divertor area clearly changes as RMP is applied[6].Therefore,it is also very important to measure the impurity profile in the divertor area in order to investigate the mechanism of impurity suppression with RMP.
VUV spectroscopy is an important diagnostic for measuring edge impurity radiation.Various VUV spectrometers have been applied on LHD [7],JET [8],J-TEXT [9] and ASDEX Upgrade[10].VUV spectroscopy is also planned for ITER [11].Recently,a compact Seya-Namioka-type VUV spectrometer was developed at EAST to observe edge impurity emissions in the wavelength range of 50-300 nm without spatial resolution.Several important impurity lines have been identified in the wavelength range of 50-300 nm.However,the study of edge impurity behavior requires profile measurement with a spatially resolved VUV spectrometer.The preliminary design and test results have been presented in a previous paper [12].In this study,the detailed design and realizations are presented.Section 2 presents the physics requirements for the space-resolved VUV spectroscopy.Section 3 details the optical design of the spectroscopy system.Section 4 presents the engineering design.Finally,the paper is summarized in section 5.
2.Objective and requirements of the VUV spectroscopy on EAST
The purpose of developing the VUV spectroscopy is to observe the impurities in the divertor region at EAST.Several visible spectroscopic diagnostic systems are being used to observe edge emissions in the wavelength range of about 300-700 nm[13].However,with the increase of edge plasmatemperature,the emissions from the divertor region are dominant in the shorter wavelength range,i.e.the VUV and extreme ultraviolet (EUV) ranges.EUV spectroscopic diagnostics with a wavelength range of 1-50 nm are being used at EAST [14,15].VUV spectroscopy covering the 50-300 nm wavelength range will supplement the spectroscopic measurement on EAST.

Table 1.Impurity spectra in the VUV range [3,16].
In the above-mentioned wavelength range,several import lines of concern have been identified for the divertor physics study [3,16].For the impurity monitoring,measurements of impurity carbon (C) and oxygen (O) are very important for general plasma operations.For the study of tungsten (W)transport,measurements of the W line emissions are very important.In addition,for the radiative divertor study,measurements of neon (Ne) impurity are needed.The potentially measurable emission lines are listed in table 1.It can be found that the desired wavelength range of 50-300 nm is sufficient to observe these impurity species.
In a previous study,the impurity distribution near the divertor X-point at EAST was measured by a fast bolometer[17].It was found that the strong radiative belt near the X-point was about 5-10 cm in size.Therefore,the requirement of spatial resolution is expected to be ≤50 mm near this region.In order to observe the impurity emission of the entire divertor region,a minimum view field of about 400 mm is necessary for the VUV system.The time scale of impurity transport is relatively slow compared with that of the magnetohydrodynamic (MHD) phenomenon.Usually,measurements of impurity emission with a temporal resolution of 10 ms are enough for the study of impurity transport.However,a good temporal resolution for feedback control is needed.According to a previous detachment plasma study at EAST,a 10 kHz temporal resolution is necessary for feedback control [18].
In order to meet the above requirements,the spaceresolved VUV spectroscopic system is designed with two types of detectors,i.e.a charge-coupled device (CCD)detector and a photomultiplier-tube (PMT) detector,which can be switched from one type to another on demand.A comparison between the physics requirements and the designed parameters of the VUV spectroscopy is summarized in table 2.For the system with the CCD detector,impurityspectra in the wavelength range of 50-300 nm can be observed.The spectral resolution can be improved by adjusting the width of the entrance slit and switching grating.The system can observe impurity emissions around the X-point with a spatial of range of 450 mm with the designed spatial resolution of approximately 20 mm.The expected temporal resolution is about 5 ms.By selecting a similar grating and CCD detector,the sensitivity of the overall system is comparable to that of the existing system in the HL-2A tokamak,which works well when observing edge impurity emissions[19].As for the system with the PMT detector,the impurity emissions can be observed in the wavelength range of 50-300 nm.One slit with adjustable width is placed vertically in front of the PMT detector to isolate one transition.The spatial extension around the X-point is about 225 mm,which is sufficient for feedback control.The maximum sampling rate of the PMT detector is about 1 MHz,which is also high enough for feedback control during the radiative divertor operation.

Table 2.Comparison of physics requirements and designed parameters of VUV system.
3.Optical design of VUV spectrometer system
In order to obtain a good spectral resolution,the spaceresolved VUV spectroscopy of an eagle-type spectrometer[20,21] is designed at EAST.The advantages of the eagletype spectrometer are its compactness,high resolution and low aberrations through the Rowland circle mounting scheme[22].Figure 1 shows the optical design of the VUV spectrometer,in which the detector position and the grating rotation angle can be changed and rotated concurrently to reduce aberration,and the location of the entrance slit is independent of the wavelength.

Figure 1.The optical design of the space-resolution VUV spectrometer.
The angle (2K) between the entrance and exit optical axis is fixed at 15°.The entrance arm (r) and grating radius have a radius of curvature of 986.9 mm and 998.8 mm,respectively.The exit arm (r′) moves along with the exit optical axis as the grating rotates.The relationship between the entrance angle α,the diffraction angle β and the grating rotation angle θ can be described as follows:

The grating equation is

where n is the diffraction order,σ is the distance between the adjacent grating grooves,and λ is the output wavelength.
Figure 2(a) shows the corresponding output wavelength,which is obtained by the grating equation with 2400 grooves/mm.When a CCD detector is used,the spectra can be recorded.Figure 2(b) shows the single measurement of the CCD,whose effective image area is 26.7×6.9 mm2.In addition,the dispersion direction is the long side of the image area to observe more spectra.Therefore,the single-measurement spectral range of the CCD is about 11 nm.With the increased linear dispersion,the spectral range increases slightly.
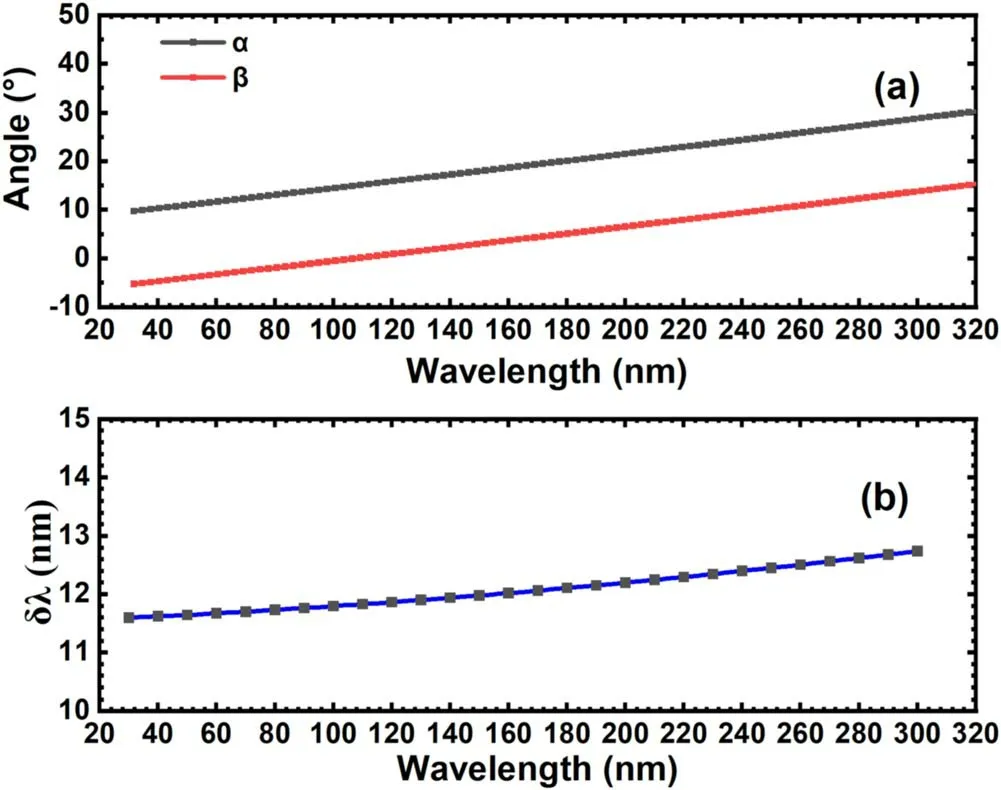
Figure 2.(a)Change of output wavelength with entrance angle α and diffraction angle β;(b)the single observation wavelength range with CCD detector.

Figure 3.(a) Line dispersion at different output center wavelengths;(b) line dispersion at different positions of CCD detector at center wavelengths of 30 nm and 300 nm.
The line dispersion of the center wavelength spectrum recorded by CCD can be expressed as follows:

where r′is the focal length,which is the same as the exit arm.Figure 3(a)shows the line dispersion at the center position of the CCD detector.In the wavelength range of 30-300 nm,the line dispersion is within the range of 0.418-0.468 nm mm-1.It can also be seen that the line dispersion increases with the wavelength.The line dispersions in the CCD plane at 30 nm and 300 nm are shown in figure 3(b).It is shown that changes in line dispersion in the CCD horizontal direction are small enough.
The spectral resolution of the monochromator is mainly defined by the width of the entrance slit,aberration,and diffraction limit,etc.The effects of the entrance slit and exit slit width on the spectral resolution are described in the following equations [23]:

where S1and S2are the entrance slit and pixel width,respectively.
Additionally,the effect of aberration on the spectral resolution can be described as [24]

where ΔYAis the aberration in the diffraction direction of the grating,w is the length of the edge perpendicular to the grating line,l is the length of the grating line,F20is the defocusing aberration,F30is the coma,F12is the astigmatic coma and F40is the spherical aberration.In a VUV spectrometer,the influence of these four factors on resolution must be considered.
The effects of the defocusing aberration F20,coma F30,astigmatic comma F12and spherical aberration F40on the spectral resolution are described by ΔλDe,ΔλCo,ΔλAsand ΔλSp,respectively,in the following equations (7)-(10):

where T(r,α),T(r′,α),S(r,α),S(r′,α),α20,α02and α40are defined separately in the following equations (11)-(17):


where R is the meridian radius and ρ is the radius of curvature.The grating surface is of spherical shape; therefore,the radius of curvature ρ is equal to the meridian radius R.
The impact of the diffraction limit on the spectral resolution is shown as follows:

where N is the total number of irradiated grating lines.
The total spectral resolution is described as follows[23,24]:

The aberration can be seen as the deviation distance between the diffraction ray on the focal plane and the Gaussian image point.Therefore,the aberration deviation distance is the sum of different aberration contributions.Figure 4 shows the calculated CCD position and the effect of various terms on the spectral resolution using the spectrometer hardware parameters as shown in table 3.According to the aberration equation(6),the effect of aberration on the spectral resolution can be reduced by optimizing the detector position.Figure 4(a)shows the optimized detector position.Figure 4(b)shows the influence of the defocusing aberration,coma aberration,astigmatic aberration and aspherical aberration on the spectral resolution.The diffraction ray deviates in the direction of diffraction due to the aberration and astigmatic aberration.In addition,coma and aspherical aberration deflect the diffraction ray in the opposite direction.The deviation distance of astigmatic and coma aberration increases with the wavelength,and the deviation distance of astigmatic aberration increases obviously in the long-side wavelength.The deviation distance of aspherical aberration is about 0.05 nm.According to equations (7)-(10),the detector arrangement mainly affects the defocusing aberration,but has little effect on other terms.Therefore,the overall aberration is corrected by the defocusing aberration through detector arrangement.Figure 4(c) shows the effect of the entrance slit width,pixel size,diffraction limit and aberration influence on the spectral resolution.The aberration effect on the spectral resolution is controlled effectively by careful detector arrangement.The diffraction limit’s effect on the spectral resolution is small at shorter wavelengths and slightly increases at longer wavelengths.Due to the high photon emission intensity from tokamak plasmas,an entrance slit with a width of 30 μm is sufficient for photon intensity.The effects of the entrance slit and the pixel size on the spectral resolution broadening are about 0.011 nm and 0.0058 nm,respectively.According to equation(19),the spectral resolution broadening of all optical arrangements is about 0.013 nm.

Figure 4.(a) The optimized CCD position; (b) the effect of aberration on spectral resolution; (c) the influence of various factors on spectral resolution.
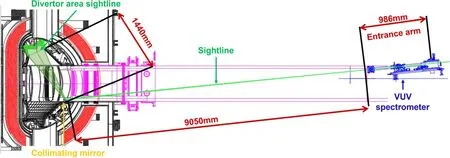
Figure 5.The layout schematic view of the VUV spectrometer.

Figure 6.Engineering design of VUV spectrometer.

Table 3.Spectrometer hardware parameters.
4.Engineering design of the VUV spectrometer
4.1.Setup of VUV spectroscopy on EAST
The VUV spectrometer is designed to cover a 50-300 nm spectral range.As one of the key diagnostics of measuring edge impurity emission,VUV spectroscopy can provide impurity radiation distributions for studying impurity transport and momentum transport in the divertor region.
Figure 5 shows the schematic view of the VUV spectrometer,which is installed on the back of the vacuum expansion chamber that is connected to the EAST vacuum vessel [12].The distance between the plasma center and the VUV spectrometer is about 9 m,which provides a large enough observation range.In the divertor region,there are abundant impurity radiations emitted in the VUV range.In order to collect impurity radiation distribution in the divertor region,a gold-coated convex mirror is installed at the bottom of the vacuum extension chamber to reflect the divertor impurity radiation towards the VUV spectrometer.The reflectivity of the mirror reaches over 40% in the wavelength range of 100-300 nm and rapidly degrades in the wavelength range below 100 nm.For example,the reflectivity can only reach 10%-20% at 50 nm.Considering that the distances between the mirror and the observation area and entrance slit are 1440 mm and 9050 mm separately,the distance between the entrance slit and the detector is fixed at about 1950 mm,and the CCD’s pixel surface is of a height of 6.9 mm.The mirror is designed with its radius of curvature of R=400 mm(80×30 mm2)with an included angle of 118.35°.As shown in figure 5,the designed observation range of the system is about 450 mm,which is sufficient to cover the divertor area.The magnification ratio of the image of the observation area to the CCD is about 65.The observation area can be aligned by a collimating laser installed inside the VUV spectrometer.
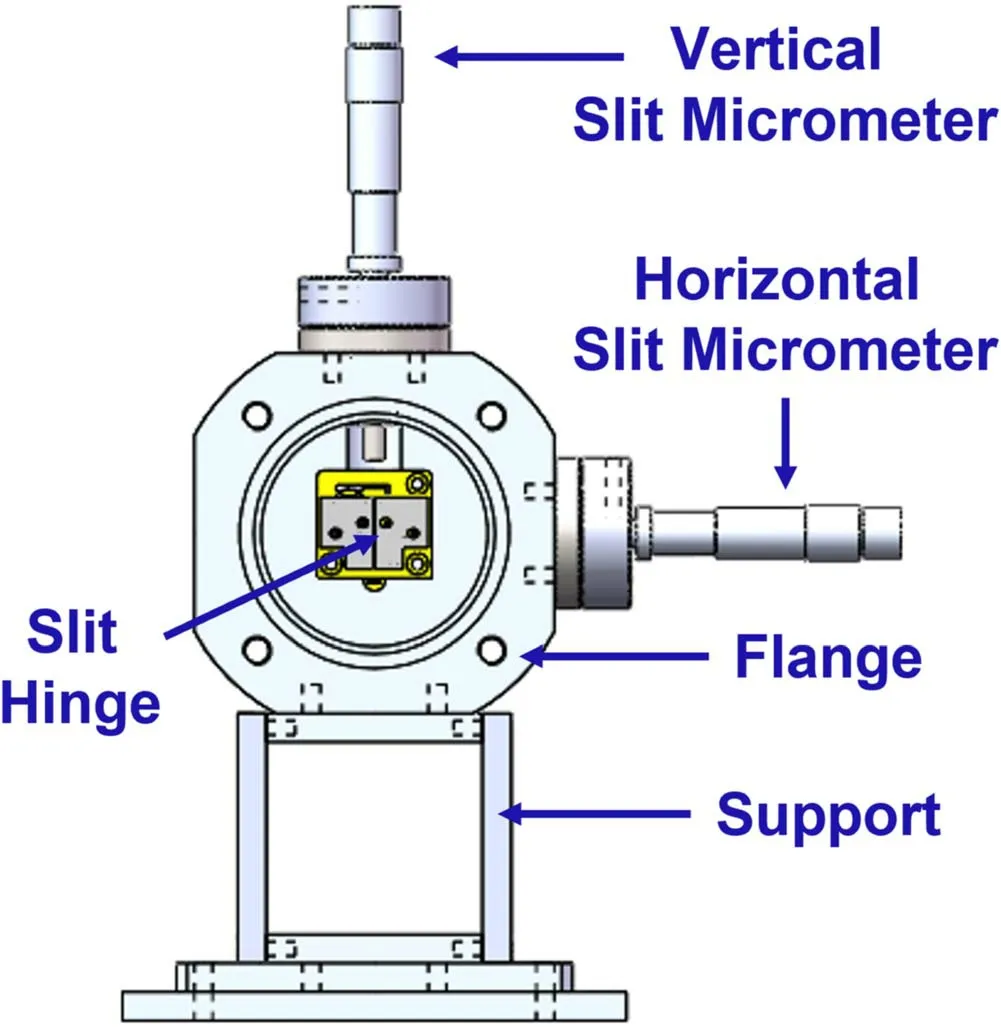
Figure 7.The arrangement of slit assembly.
In order to experimentally calibrate the position of view field,an off-line calibration method is used after the system is installed on EAST.A visible point light source is placed in the upper divertor region inside the EAST vacuum chamber.At the same time,the spectrometer is set to observe the zeroth-order spectra with incident angle α=7.5°.By changing the position of the light source,the size of the observation field can be calibrated.
4.2.Design of VUV spectrometer
A schematic of the VUV spectrometer is shown in figure 6.In order to obtain good spectral resolution,the focal length of the spectrometer is set to about 1 m.The grating diffracts the light that passes through the entrance slit and the spaceresolved slit.Then,the diffracted spectra are recorded either by a CCD or PMT detector located at the end of the exit tube.
An entrance slit is vertically placed for spectral dispersion.Spectra with different dispersions can be obtained by changing the width of the entrance slit.Then,a spaceresolved slit is placed horizontally just behind the entrance slit to observe the emission profiles with the pin-hole imaging principle in the vertical direction.The spherical grating is installed on the grating switching station,which switches the grating by a stepping motor under the vacuum condition.The grating can also be rotated horizontally along its center to scan the output wavelength.Two types of detectors are used in the VUV spectrometer,a back-illuminated CCD and a PMT detector,which are applied to the measurement of spectra and for feedback control,respectively.The detectors are held steadily on a displacement station,which can move along the exit optical axis.
In addition,a feedthrough and vacuum exhaust port are installed in the VUV spectrometer.The feedthrough is designed to connect the internal and external electrical components of the VUV spectrometer.The vacuum exhaust port is connected to the vacuum pump system to keep the internal vacuum pressure inside the VUV spectrometer below 5×10⁻⁴Pa.The collimating laser light mentioned before is reflected by the grating and the reflecting mirror passing through the entrance slit to light up the divertor region for spatial calibration.
4.3.Key components of the spectrometer
The VUV spectrometer is mainly composed of a slit assembly,a grating assembly and an imaging assembly.Figure 7 shows the design of the entrance slit assembly.It is integrated in the flange,which is fixed on the support.One spacedresolved slit is installed in the horizontal direction for profile measurement of impurity emissions.The width of the entrance slit and space-resolving slit can be adjusted by the vertical and horizontal micrometers,respectively.The width of the entrance slit and the space-resolved slit can be adjusted in the range of 0-500 μm and 0-5 mm,respectively,with an accuracy of 2 μm.

Figure 8.The arrangement of grating scanning and grating switching assembly.
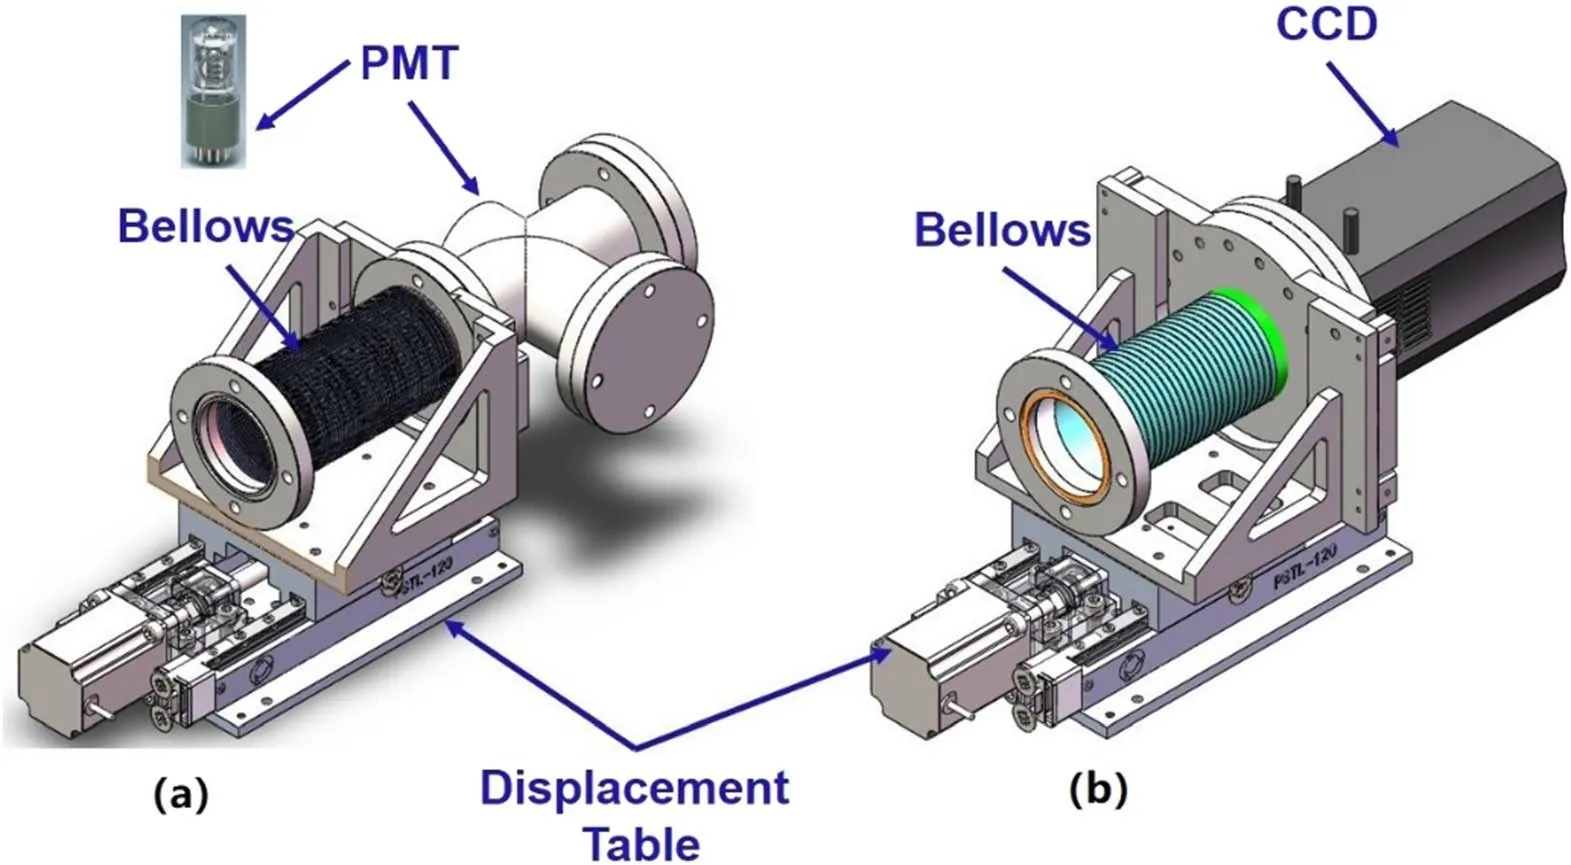
Figure 9.(a) PMT detector assembly; (b) CCD detector assembly.
Two spherical gratings with 2400 grooves/mm and 2160 grooves/mm are installed in the spectrometer,which uses the same coating material of Al+MgF2.The grating diameter and radius of curvature are 63.5 mm and 998.8 mm,respectively.The detailed grating assembly is shown in figure 8.The gratings are installed on the grating switching station,which is fixed on the scanning turntable.A driving lever is used to connect the scanning turntable and the rotary actuator.The repetitive positioning accuracy and motion resolution of the rotary actuator are found to be within 4″ and ±1 μm,respectively,which ensures that the wavelength scanning is stable and accurate.
The VUV spectrometer is equipped with a PMT or a CCD detector.The arrangement of the detector is shown in figure 9.The detector is mounted on the support station,which is connected with a bellow that can be compressed by a stepping motor to reduce the aberration.The PMT detector is installed in the vacuum chamber that is also connected to the exit tube by the bellow.In order to reduce the aberration during wavelength scanning,the maximum moving range of the displacement station is designed to be 120 mm.Similar to the rotary actuator,the displacement table has high repetitive positioning accuracy and good motion resolution for stable and accurate focusing.
The PMT (Hamamatsu R8486) is installed in the VUV spectroscopy for feedback control for stable radiative divertor operation.The PMT can achieve the maximum sampling rate of 1 MHz.The effective area of the PMT is 8×12 mm2with a quantum efficiency of 25%,whose anode radiant sensitivity and gain can reach 5.2×10⁵A W-1and 1.0×10⁷,respectively.One vertically placed slit is installed in front of the PMT detector to limit the detected wavelength range.
The CCD (Andor DU940P,2048×512 active pixels,13.5×13.5 μm2/pixel)is used for the spectral measurement of impurity emissions.The maximum sampling rate of the CCD detector is 200 Hz.The image area of the CCD is 27.6×6.9 mm2.The spatial profile of the observed emission is indeed recorded in the direction of the short side of the CCD(6.9 mm side).The CCD can be cooled down to-80°C by an air-cooling system,which can effectively reduce the dark current.
5.Summary
To measure impurity emissions in the VUV band at EAST,a VUV spectrum system is designed.The system uses a normal-incident eagle-type spectrometer with a CCD or a PMT detector.The detector position is shifted along the exit optical axis as the grating rotates,in order to reduce aberration.According to the optical simulation,the line dispersion increases slightly with the wavelength.It is also found that the difference between the horizontal line dispersion of the CCD detector in the center wavelength of 30 nm and that in the center wavelength of 300 nm is very small.The overall aberration is significantly reduced by adjusting the detector position,which is very effective for reducing the defocus aberration.Therefore,a very low aberration and high resolution can be obtained.One space-resolved slit is installed in the horizontal direction to observe the impurity emissions profile.Two gratings with groove densities of 2160 g mm-1and 2400 g mm-1are installed with the grating holder,which allows switching of the gratings without opening the vacuum chamber.The CCD detector is used to observe the line spectra,while the PMT detector is used to measure the highfrequency intensity behavior of the specific impurity line.One collimating laser light is installed near the exit tube for position calibration when the system is being installed on EAST.The impurity emissions in the wavelength range of 50-300 nm from EAST plasma can be observed by rotating the grating.A spectral resolution of ~0.02 nm can be obtained with the 2400 g mm-1grating based on the present design.
Acknowledgments
The work was supported by the National Magnetic Confinement Fusion Science Program of China (Nos.2017YFE0301300,2019YFE03030002 and 2018YFE0303103),National Natural Science Foundation of China (No.12175278),Anhui Province
Key Research and Development Program(No.202104a06020021),ASIPP Science and Research Grant (No.DSJJ-2020-02),Anhui Provincial Natural Science Foundation(No.1908085J01),Distinguished Young Scholar of Anhui Provincial Natural Science Foundation (No.2008085QA39),Instrument Developing Project of the Chinese Academy of Sciences (No.YJKYYQ20180013),the Comprehensive Research Facility for Fusion Technology Program of China(No.2018-000052-73-01-001228),the University Synergy Innovation Program of Anhui Province (No.GXXT-2021-029) and CAS President’s International Fellowship Initiative (No.2022VMB0007).
ORCID iDs
猜你喜欢
当代党员(2021年15期)2021-08-27
小小说月刊·下半月(2020年10期)2020-11-06
人民交通(2020年16期)2020-11-03
人民交通(2020年15期)2020-08-25
人民交通(2020年13期)2020-07-15
人民交通(2019年13期)2019-12-12
人民交通(2018年11期)2018-10-24
人民交通(2018年4期)2018-04-19
人民交通(2018年17期)2018-03-27
民生周刊(2017年20期)2017-11-08
 Plasma Science and Technology2022年6期
- Plasma Science and Technology的其它文章
- Recent progress on the J-TEXT three-wave polarimeter-interferometer
- Design of the stripping unit and the electromagnetic analysis unit for the E//B NPA on HL-2A/2M tokamak
- Development of a combined interferometer using millimeter wave solid state source and a far infrared laser on ENN’s XuanLong-50(EXL-50)
- Bench test of interferometer measurement for the Keda Reconnection eXperiment device (KRX)
- Neutron yield measurement system of HL-2A tokamak
- Study of the fast electron behavior in electron cyclotron current driven plasma on J-TEXT