
Effect of observation time on source identification of diffusion in complex networks
2022-08-01 05:58ChaoyiShi史朝义QiZhang张琦andTianguangChu楚天广
Chinese Physics B 2022年7期
关键词:张琦
Chaoyi Shi(史朝义), Qi Zhang(张琦), and Tianguang Chu(楚天广),†
1College of Engineering,Peking University,Beijing 100871,China
2School of Information Technology and Management,University of International Business and Economics,Beijing 100105,China
Keywords: complex network,source identification,statistical inference,partial observation
1. Introduction
Recent years, researchers have witnessed tremendous growth in studies concerning the diffusion processes in complex networks, such as modeling epidemic spreading,[1–4]identifying influential spreaders,[5–9]and analyzing diffusion dynamics.[10–12]Among a plethora of research thrusts, the problem of identifying the diffusion sources in complex networks based on observed information has gathered increasing attention due to its broad applications in such problems as identifying the origin of a rumor,[13,14]locating the source of epidemic,[15–18]and so on. Clearly, studies in this direction are crucial in preventing or controlling spread of adverse or detrimental influences in a network system consisting of large amount of interconnected individuals or nodes.
Basically, source identification problem aims at estimating the location of source node that initiates the diffusion in a network by using certain observation information of the diffusion. So far, several approaches have been proposed to solve the source identification problem with observations that involve the states of observed nodes,[13,15–18]or the (infection) time at which the diffusion arrives at the observed nodes.[14,19–22]Early studies often assume complete observation condition, i.e., the state of each node is observed, and make use of the measures of certain centricity to evaluate the source detection probability of the maximum likelihood(ML)estimator.[13,15]However, it is usually hard in practice to obtain complete observations of a network, since the costs for observing all nodes can be expensive and the states of some nodes may be hidden.[3,14]In view of these, considerable efforts have been devoted to the study of source identification problems under partial observation conditions, i.e., the states or infection time of only a fraction of nodes can be available.For instance,in Refs.[16–18]the authors considered a single snapshot of partial observations at a given time and proposed different propagation algorithms to find the source of diffusion in networks.There have been also works addressing source localization by exploiting observed information of propagation delays from the source, under various assumptions on delay distributions, e.g., Gaussian and uniform distributions.[19–21]Another effective approach to locating diffusion source via incomplete observations in a network makes use of statistical inference based on Monte Carlo simulations.[22–24]The basic idea of this approach is to infer the diffusion source by evaluating the similarity between the simulation data and the observed data. Essentially,the approach applies to arbitrary network structures and therefore has wide applications. Notice that most existing studies assume that the initial time of diffusion is known in estimating source location,some of them are also concerned with the impact of the size of observation set on the results.[13,15–18]
In this paper,we intend to discuss the effect of the observation time on source identification in a diffusive network. So far in literature,little has been available concerning such an issue. Generally speaking,identification of diffusion source in a network essentially relies on the diffusion model,the observation condition,and the underlying network structure. Here we consider the case that the diffusion process is described by a discrete-time SIR model,with the initial condition of all nodes in susceptible states except one in infected state as the source.In literature, this type of models is often used to describe the spread of epidemics[16,17]and computer virus.[15,19]We consider the problem of estimating both the source location and the initial time of diffusion with snapshot of partial nodes,and formulate it as an ML estimator in terms of the marginal probabilities of a node in different states. A method based on Monte Carlo simulation(MCS)is developed to evaluate the marginal probabilities of a candidate source node,whereby to examine the effect of the observation time as well as the fraction of the observers on solutions of the concerned problem with numerical experiments on typical synthetic and real-world networks.
2. Problem formulation
We consider the case that the diffusion outbreak occurs at a single node and the states of only a fraction of nodes can be observed with a snapshot. The task of source identification is to determine the location of source and the initial time of diffusion in a network based on the partial observation. In the following, we will introduce the diffusion model and the ML estimator for the source identification problem.
2.1. The diffusion model
To describe the discrete-time SIR diffusion process, we model the underlying contact network as an undirected graphG(V,E)withNnodes,whereVis the set of nodes,E ∈V×Vis the set of edges. At timet, each nodei ∈Vhas three possible states represented by a variableXti: susceptible,Xti=S;infected,Xti=I;or recovered,Xti=R.In each time step,an infected nodeiinfects its susceptible neighborjwith probabilityλij,or recovers with probabilityμi,and no longer get infected.Thus,a susceptible nodeibecomes infected with probability,
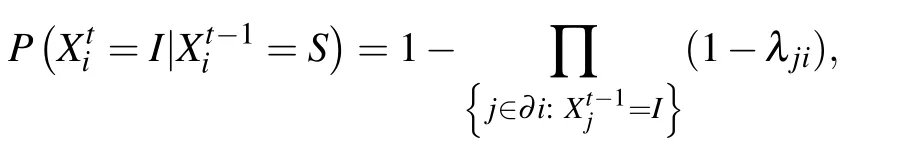
where∂iis the set of neighbors of nodei.As mentioned above,we assume that at an unknown initial timet0,all nodes are in stateSexcept only one infected nodei0,the source,that initiates diffusion process in the network.
2.2. Snapshot observation
Figure 1 shows an example of the diffusion process and snapshot observation on an arbitrary graphG.
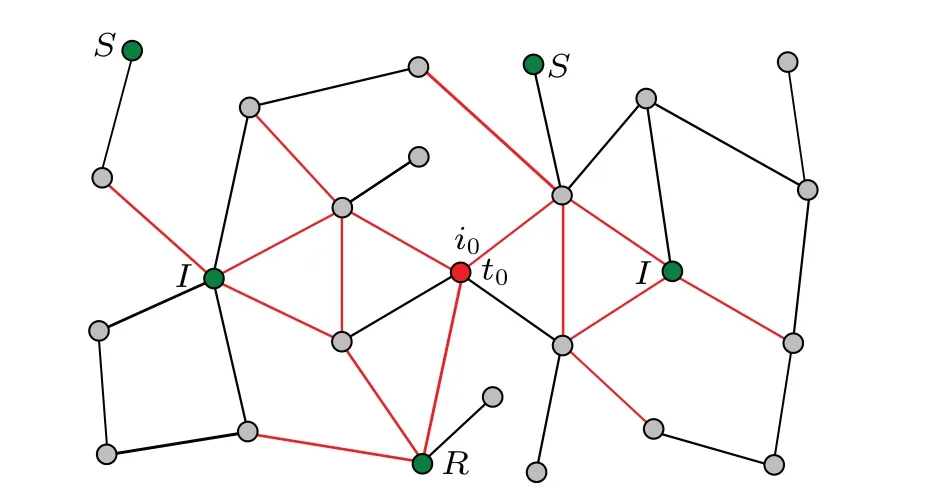
Fig. 1. Visualization of the diffusion process and observed data on graph G. At unknown time t0, the source node i0 (red) initiates the diffusion. The red edges are the links on which the spread occurs. In this example, a snapshot of the observers (green) is taken at time T,which has three types of nodes with the state S, I, or R for each. The goal is to identify the source location and initial time of diffusion from the snapshot observation.
2.3. Maximum likelihood estimator

Therefore,we can formulate the source identification problem as the following ML estimator:
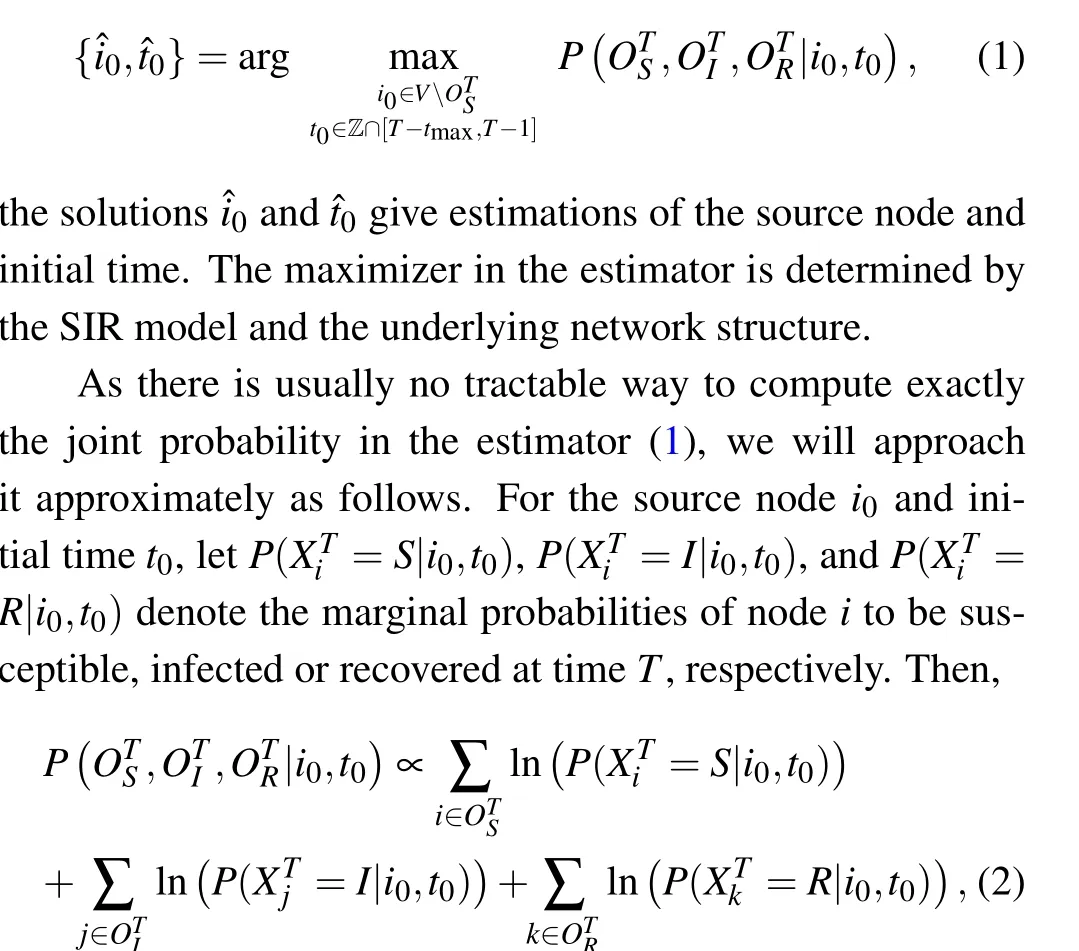
and clearly,
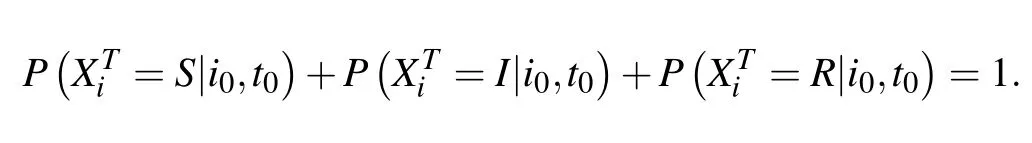
We will make use of the marginal probabilities instead of the joint probability in the estimator(1)to infer the source node and initial time of diffusion.
3. Monte Carlo simulation
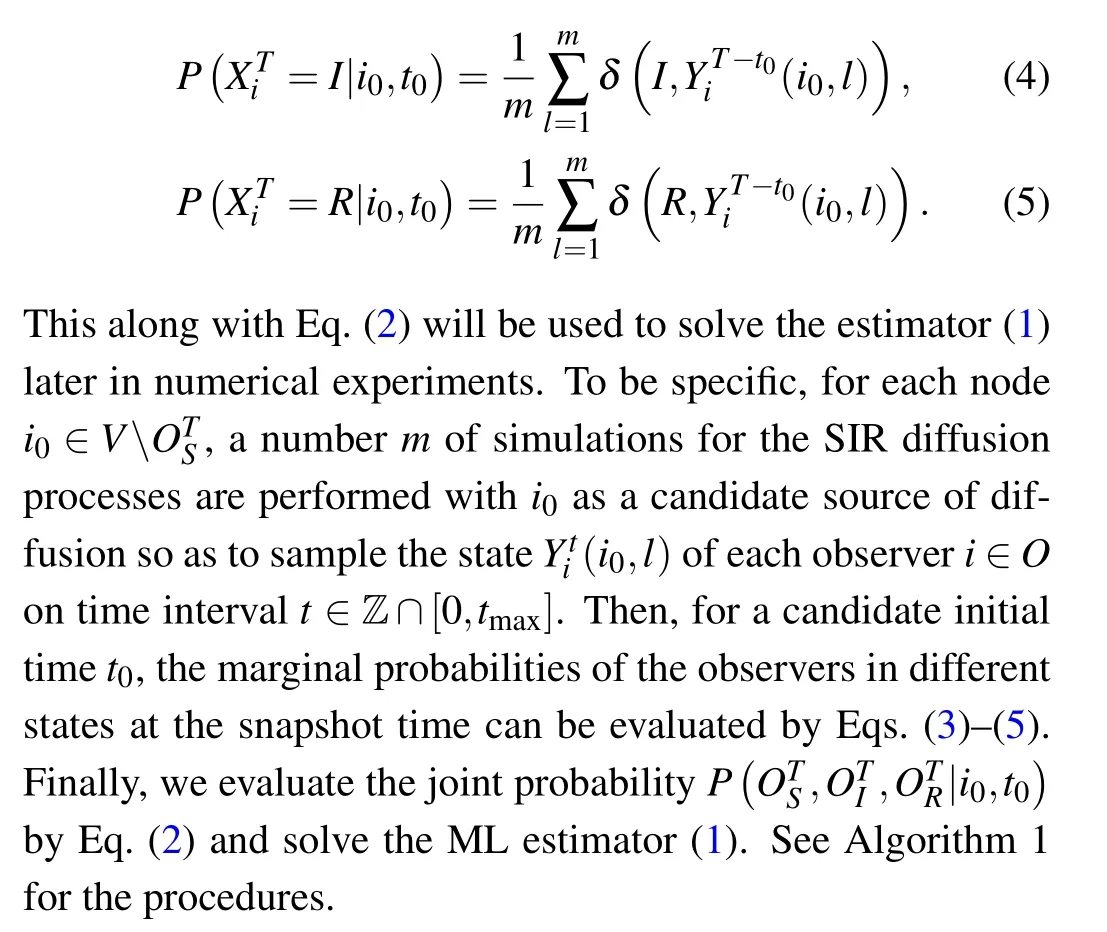
Now we present an MCS approach to estimate the marginal probabilities of a node. The basic idea is that for a candidate source nodei0∈V∖OTS,we perform simulations ofmtimes for the diffusion process following the SIR model on time interval [0,tmax], and sample the state of every observeri ∈Oat timet ∈Z∩[0,tmax]. Then, by examining the similarity of the samples and the snapshot to determine the source and initial time of the diffusion.
To be specific,letYti(i0,l)be the state of nodeiat timetfor thel-th simulation with the candidate source nodei0,it is clear that
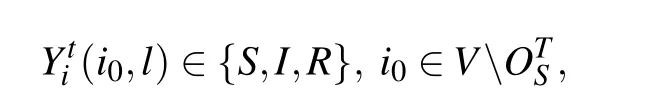
and fort=0,
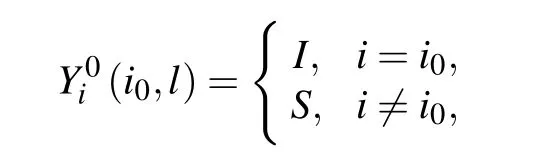
forl=1,...,m. In simulations,a node in the network updates its state by the following rule.
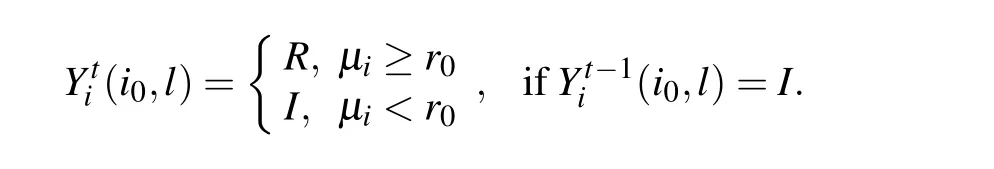
For a susceptible nodeiat timet-1,each infected neighborjwill execute an independent infection attempt with success probabilityλji,triggered by a Bernoulli trial(flipping an independent coin)that generates a random numberr0from the uniform distribution between 0 and 1 as threshold. Namely,the state of nodeiin the next steptis given by

Similarly, for a nodeiin the stateIat time stept-1, it will execute a recovery attempt with success probabilityμiaccording to a Bernoulli trial numberr0as before, and updates its state at time steptas follows:
According to the specification of the SIR model described before,all recovered nodes will not be infected anymore and remain the recovered state during the simulation process,i.e.,
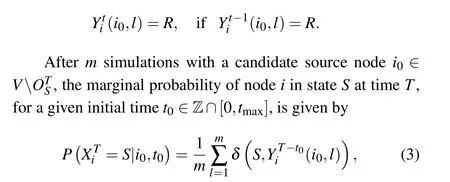
whereδ(·,·)denotes the Kronecker delta function. Similarly,the marginal probabilities of the nodeibeing in statesIandRat timeTare given respectively by

Algorithm 1 MSC-based source identification algorithm Input: G(V,E);λij;μi;OTS;OTI ;OTR,tmax Output: the source location ˆi0;the initial time of diffusion ˆt0 for a candidate source node i0 ∈V∖OTS do for l=1 to m do Sample the state Yti(i0,l)of each observer i ∈O at time t ∈Z∩[0,tmax]end for for a candidate initial time t0 ∈Z∩[T-tmax,T-1]do Evaluate the marginal probabilities P(XTi =S|i0,t0),P(XTi =I|i0,t0),i ∈O Evaluate the joint probability P(OTS,OTI ,OTR|i0,t0)by Eq.(2)),P(XTi =R|i0,t0 end for end for{ˆi0,ˆt0}=argmax )i0∈V∖OTS t0∈Z∩[T-tmax,T-1]P(OTS,OTI ,OTR|i0,t0
We remark that the algorithmic complexity for a single SIR simulation isO(N〈k〉tmax), where〈k〉is the average degree of the graphG, thus runningmsimulations for a candidate source nodei0requiresO(mN〈k〉tmax) time. In experiments we found that it is enough to takem=200 for obtaining a satisfactory identification result, further increasing the simulation times does not improve the accuracy of identification significantly.
Compared with some related studies, our method can be implemented directly by Monte Carlo simulations,without the need of complicated calculations or additional assumptions.For instance, the methods proposed in Refs. [21,22] require to calculate the multiple integrations of joint probability for partial observations. In Ref. [24], the source likelihood was estimated by using the Gaussian weighting function.
4. Experiments and discussion
We give numerical experiments to examine the effect of the observation time as well as the fraction of the observers on source identification for synthetic networks and real-world networks.In all the cases a fractionγ=K/Nof nodes is available in observation at timeTfor the source identification problem, and the sourcei0and the initial timet0are estimated by Algorithm 1. The performance of the method is assessed in terms of the success rate of locating source node for different fractionγand snapshot timeT.
4.1. Synthetic networks
We consider three typical synthetic networks,i.e.,Erd¨os–R´enyi(ER)random network,Barab´asi–Albert(BA)scale-free network, and Watts–Strogtz (WS) small world network,[1]all containingN= 1000 nodes with average degree〈k〉 ≈6. For convenience in simulation and without loss of generality,[13,17,24]we consider uniform infection and recovery probabilities by lettingλi j=λandμi=μ. In each experiment, a node is randomly selected to initiate the diffusion at timet=0 and we run SIR process fortmaxsteps,which can be approximated by
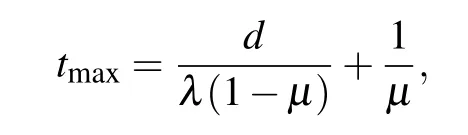
wheredis the diameter of a network,the first term on the left side is the maximum infection time of a node, and the second term is the average recovery time of a node. Then, the state of a fractionγof nodes is observed at timeT,whereγ ∈{0.1,0.2,...,0.9,1.0}and the snapshot timeT ∈{1,...,tmax}.We repeated the experiment 4000 times for each case to get the average success rate of located source.
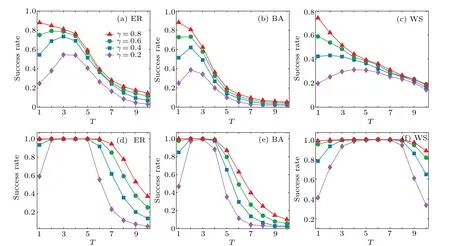
Fig.2. Effects of the snapshot time T and the fraction γ of observers on source identification results: (a)–(c)λ =0.4,μ=0.2,(d)–(f)λ =0.8,μ =0.2. The success rate of locating source on ER,BA,and WS networks,with N=1000 nodes and average degree,〈k〉≈6. The diffusion starts at t=0,a fraction γ ∈{0.2,0.4,0.6,0.8}of nodes is observed at time 1 ≤T ≤10.
We examine the effect of the snapshot timeTand the fractionγof observers on source identification results. Existing studies mainly considered the effect ofγon source localization accuracy, regardless of considering the snapshot timeT.Our results as illustrated in Fig.2 reveal an involved influence of the two factors on source identification problem. We can see that, in general, the source identification problem will be hard to attack for observations with large time delay; and the greater the number of observed nodes,the more accurately our methods can infer the true source. Indeed, a large value ofTallows for a full development of diffusion(hence infection)in a network,this would reduce effectiveness of the snapshot information. The cases for different infection probabilityλand recovery probabilityμare similar and hence omitted.
In more detail,Fig.2 indicates different trends of the success rate of source localization with respect toTandγ. For very large values ofγ(e.g.,not less than 0.8),the success rate decreases monotonically with the increase ofT; whereas for the major portion of values ofγ(e.g., (0,0.8)), the success rate first rises to a highest level and then drops down with the increase ofT. This implies that one could try to choose an optimal timeTfor observation to get more reliable results. As shown in Fig. 2, it is better in general to take a snapshot at early stage of the diffusion process, and the range for such a timeTalso depends on SIR model parametersλandμ. However,for very smallγ(e.g.,0.2)the accuracy of source localization is low in early stages of diffusion as little information about infected nodes is available. Thus, it may be difficult to infer the source at early stages of diffusion from a very small observation set.
Figure 3 illustrates the impact of the snapshot timeTand the infection probabilityλon the success rate of locating the source, where the value ofλvaries from 0.1 to 1.0. The results are different, depending on the network structures. For the ER network,the observation timeThas little effect on the source localization when the infection probabilityλis small(e.g., (0.1,0.3)). For the other two types of networks, this is true for relatively large values ofλ(e.g., (0.1,0.4) for BA,(0.1,0.7)for WS).On the other hand,for a large value ofλ,a relatively earlier observation is in favor of source localization in ER and BA networks.For the WS network,the effect of different observation timeTis less evident in the case of larger values ofλ.
Figure 4 depicts the average snapshot timeTof successfully locating the source for different observation fractionγ. It shows that in generalTdecreases monotonically with the increase ofγfor all networks. This implies that a snapshot of a larger observation set facilitates the inference of the source at early stages of diffusion. This is consistent with the results as shown in Fig.2. In particular,given an observation fractionγ,one could try to choose an appropriate timeTfor observation by Fig.4 to get more reliable results.
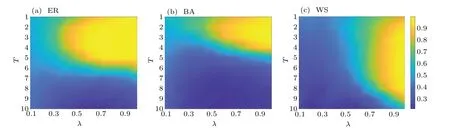
Fig. 3. Effects of the snapshot time T and infection probability λ on success rate of locating source for ER, BA, and WS networks, with N =1000 nodes and average degree 〈k〉≈6. The diffusion starts at t =0 with λ =0.1,...,1.0 and μ =0.1, a fraction γ =0.4 of nodes is observed at time 1 ≤T ≤10.
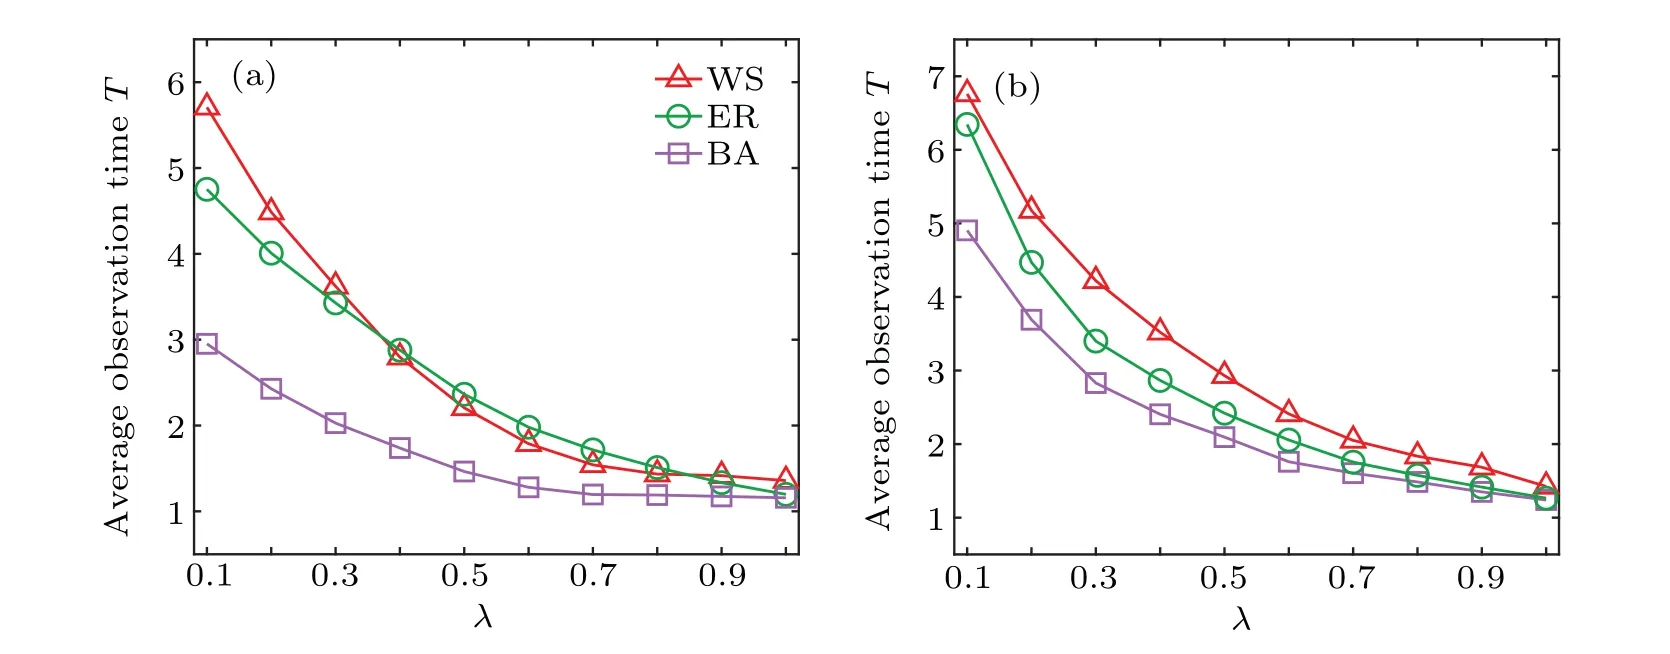
Fig.4. Observation time T of successfully locating the source for different fraction γ on ER,BA,and WS networks,all containing N=1000 nodes with average degree〈k〉≈6: (a)λ =0.4,μ =0.2,(b)λ =0.3,μ =0.1. The diffusion process starts at t=0 from a randomly selected node,and a snapshot of γN nodes is taken for γ ∈{0.1,0.2,...,0.9,1}.
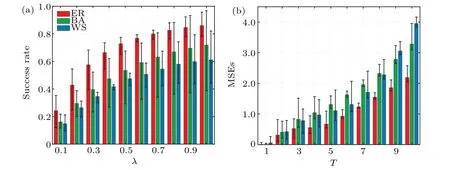
Fig.5. Source localization and initial time estimate results on ER,BA,and WS networks,all containing N=1000 nodes with average degree〈k〉≈6. The diffusion process starts at t =0 from a randomly selected node with λ =0.4 and μ =0.2,and a snapshot of γN nodes is taken at time T for γ ∈{0.1,0.2,...,0.9,1}and 1 ≤T ≤10. (a)Success rates of locating source node for different fraction γ. The lower and upper values of the success rate are calculated by using snapshot observation at different time T. (b)MSEs of the initial time estimates for different snapshot time T. The lower and upper values of each MSE are computed with different γ.
Figure 5 shows the source localization and initial time estimate results for different fractionγof observers and snapshot timeT. From Fig.5(a)we can see that the success rate of locating source increases rapidly asγincreasing from a small value till to certain value (e.g., 0.6), after that, adding more observer nodes does not improve the identification accuracy significantly. Figure 5(b) gives the mean square error (MSE)of the initial time estimates for different snapshot timeT, it indicates that the snapshots taken at early stage of diffusion result in small MSE values for different graph structures.
4.2. Real-world networks
Furthermore,we consider two real-world network examples of email[26]and US West-Coast power grid,[27]as detailed in Table 1, which are often cited to test source identification methods in the literature.[17,18]In our experiments, the diffusion process starts att=0 from a randomly selected node,withλ ∈{0.1,0.2,..., 0.8, 0.9}andμ=0.2 respectively in each running, and a snapshot ofγNnodes is taken at timeTforγ ∈{0.05,0.1,...,0.45,0.5}and 1≤T ≤10 respectively in each time.
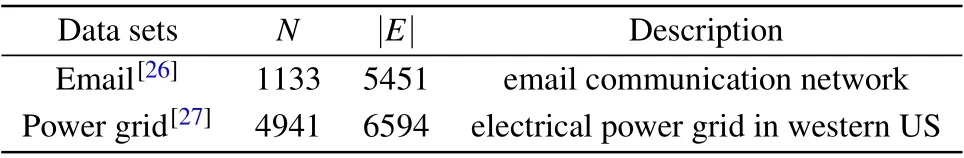
Table 1. The network parameters in the experiments,N and|E|denote the network size and the number of edges,respectively.
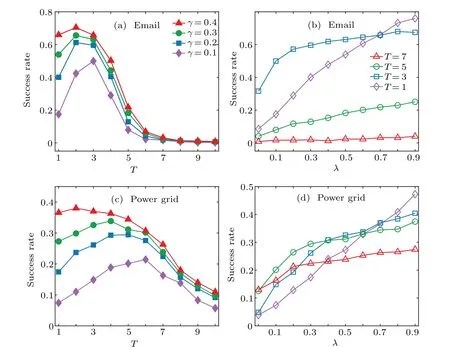
Fig. 6. Effects of the snapshot time T and the fraction γ of observers on source identification results for email and US West-Coast power grid. The diffusion process starts at t =0 with λ ∈{0.1,0.2,...,0.8,0.9} and μ =0.2, and a snapshot of γN nodes is taken at time T for γ ∈{0.05,0.1,...,0.45,0.5}and 1 ≤T ≤10. (a)–(d)Success rate of locating source node for different T and γ.
Figure 6 depicts the average results over 1000 experiments. It shows an evident impact of the observation time as well as the fraction of the observers on the source identification problem,which is similar to the case of the synthetic networks. Particularly, Figs. 6(a) and 6(c) indicate that the success rate of locating source is small at early stage of the diffusion process,and it will be hard to locate the source for large observation time. Figures 6(b)and 6(d)show that,in general,the success rate of locating source increases with the number of observer for different snapshot timeT. For a small value ofT(e.g., 1), the success rate of locating source increases rapidly as the fractionγof observers increasing,whereas for a big value ofT(e.g.,7),adding more observer nodes does not improve the source localization accuracy significantly.
5. Summary
We have discussed the effect of the observation time as well as the size of the observation set on source identification of diffusion in a network with discrete-time SIR spreading process, under incomplete observation conditions. The method makes use of the Monte Carlo simulation in evaluation of the marginal probabilities of a node that are involved in ML estimator of the source. Numerical experiments in synthetic networks and real-world networks reveal interesting yet involved nonlinear effects of the observation time and the fraction of observers on source identification. In general,a large value of snapshot time will not be in favor of the source identification for most values of the fraction of observers,since it allows for a full development of diffusion(hence infection)in a network,reducing effectiveness of the snapshot information. In particular,for very large values of the fraction of observers,the success rate of source localization decreases monotonically with the increase of the observation time. On the other hand,however, for a very small observation set, it is usually difficult to infer the source at early stages of diffusion because little information about infected nodes is available. More complicated and interesting cases occur for neither too small nor too large values of the fraction of observers, where the success rate of source localization first rises to a highest level and then drops down with the increase of the snapshot time,indicating possible choice of an optimal observation time to get more reliable results.
Acknowledgements
Project supported by the National Natural Science Foundation of China (Grant Nos. 61673027 and 62106047), the Beijing Social Science Foundation (Grant No. 21GLC042),and the Humanity and Social Science Youth foundation of Ministry of Education,China(Grant No.20YJCZH228).
猜你喜欢
Chinese Physics B(2022年4期)2022-04-12
科学与财富(2021年36期)2021-05-10
现代信息科技(2021年21期)2021-05-07
党员文摘(2020年6期)2020-07-16
廉政瞭望·下半月(2020年3期)2020-05-26
杂文选刊(2020年4期)2020-04-19
文萃报·周五版(2020年13期)2020-04-07
中国新闻周刊(2019年34期)2019-09-20
美与时代·城市版(2017年3期)2017-05-19
中国民族民间医药·上半月(2017年2期)2017-03-09

- Chinese Physics B的其它文章
- Real non-Hermitian energy spectra without any symmetry
- Propagation and modulational instability of Rossby waves in stratified fluids
- Topological phase transition in cavity optomechanical system with periodical modulation
- Practical security analysis of continuous-variable quantum key distribution with an unbalanced heterodyne detector
- Photon blockade in a cavity–atom optomechanical system
- Anderson localization of a spin–orbit coupled Bose–Einstein condensate in disorder potential