
Interaction between plasma and electromagnetic field in ion source of 10 cm ECR ion thruster
2022-08-01 05:59HaoMou牟浩YiZhouJin金逸舟JuanYang杨涓XuXia夏旭andYuLiangFu付瑜亮
Chinese Physics B 2022年7期
Hao Mou(牟浩), Yi-Zhou Jin(金逸舟), Juan Yang(杨涓),†,Xu Xia(夏旭), and Yu-Liang Fu(付瑜亮)
1College of Astronautics,Northwestern Polytechnical University,Xi’an 710072,China
2Shanghai Institute of Space Electric Propulsion,Shanghai 200000,China
Keywords: electron cyclotron resonance plasma,plasma diagnosing,ion source
1. Introduction
The 10 cm ECR ion thruster(ECRIT)has the properties of long-life span, high reliability and high specific impulse.The properties make it a candidate for the application in space flying missions.[1–3]
The 10 cm ECRIT is composed of the ECR ion source and neutralizer,both of which ionize the propellant gas according to the ECR heating mechanism. This kind of thruster can regulate the thrust through changing the microwave power,mass flow rate and acceleration voltage. Nowadays,the commercial market of spacecraft in low Earth orbit(LEO)is fast growing,it is required to perform the maneuvers including attitude control,drag compensation,and evenly to fuel the electric thruster with the rare gas at the flying orbit.[4,5]The new space flying mission needs to study the performance of ECRIT operating at the rare atmosphere environment,[6]in which N2is a main component and its ionization takes an important role in the rare gas discharge. The first ionization energy threshold of N2is similar to that of argon.[7,8]Therefore,studying the plasma property of 10 cm ECRIT operating on argon gas can provide useful information to understand the gas ionization and performance property as the thruster running at rare atmosphere environment.
In previous study,[9]four kinds of ECR ion source of 10 cm ECRIT operating on argon were developed to experimentally study the influence of magnetic field on ion beam extracting performance. Define the energy absorbing efficiency of ion source asη, which is the ratio of the absorbed to incident microwave power. The state of ion source with low,medial and high exhausted ion beam current is defined separately at low,medial and high level. It was found that the different sources can operate on different states as the incidence microwave power andηchanging.
Coralet al.[10]studied the local electron behavior in an ECR discharge using the estimation method, based on measured performance parameter and Langmuir probe diagnostics to evaluate the microwave power absorption efficiency and clarify the physics behind the performance variations. Taniet al.[11]designed and tested a new ECR ion source using a 10 cm ECRIT. They found that the performance of the new source was improved and the plasma production volume enlarged. However, this improved performance comes with an increase in the electric power consumption.
Even the above references presented the influence of magnetic field on the ion beam performance and developed a new design for improved performance at increasing power consumption,it is still required to research the interaction between the plasma,magnetic field and microwave electric field inside of the 10 cm ECR ion source. This is because the high density of plasma upwind of the screen grid will generate a high ion beam current and best thrust performance,the plasma density upwind the grid is also decided by its whole distribution inside of the ECR ion source. For ECR ion source, the plasma density distribution is decided by the electron behavior of migrating to the system wall and resonating with the microwave electric field on ECR layer. This behavior is associated with the magnetic field structure and interfered with the microwave electric field intensity.[12–14]Therefore,reviewing the multi-field interaction of 10 cm ECR ion source running on argon gas is required as creating the source and explaining its mechanism. It is necessary to use the probe diagnosing method to make clear the plasma density distribution and its relation with magnetic field.
The microwave electric field intensity in an ECR ion source had ever been firstly detected via EO probe.[15]Another method to obtain the microwave electric field intensity in plasma is PIC method combined by FDTD, however, using this method is time consuming and the microwave power absorbed by plasma is required modified for much more times through varying the microwave electric field intensity to obtain the appropriate result.[16]Through the software of COMSOL and based on the diagnosed plasma density distribution, calculating the microwave electric field intensity in the plasma of ECR ion source is convenient to make clear the relationship of plasma density and microwave electric field intensity. Therefore, through calculating the plasma dielectric tensor based on the diagnosed plasma density,[17]the microwave electric field intensity in plasma can be simulated more actually. This method is time saving.
Based on the above background,in this study,four 10 cm ECR ion sources with different magnetic field properties are generated to reveal the multi-field interaction of ECR ion source. In Section 2,the four ion sources with different magnetic field structures, plasma density diagnosing system and the methods for diagnosing and calculation are described. In Section 3,the result and analysis of the diagnosing and calculation and the revelation obtained from the study are presented.Section 4 is the conclusion.
2. The 10 cm ECR ion source and study methods
2.1. The 10 cm ECR ion source


Fig.1. Schematics of ECR ion source.
As Fig.2 showed,at the fixed length,L,between the surfaces A and B, four ion sources, numbered from 1 to 4, with different magnetic field structures and ECR layers are formed according to the lengths ofL1andL2,which separately present the distance between the small magnetic ring and surface A,the large and small magnetic ring centers. The distribution of magnetic flux density in the sources was calculated through the COMSOL.The vacuum, magnetic yoke and permanent magnet of samarium cobalt separately with relative permeability in 1,4000 and 1.36 were considered in calculation. The calculation result was calibrated through the measuring data. As the microwave frequency used by the ion source is 4.2 GHz, the magnetic flux density on ECR layer is 0.15 T. The structure property of the four sources is showed in Table 1. The different volumes of regions 1,3(a)and 3(b)provide the condition to study the volume influence on plasma distribution and indicate the multi-field interaction inside of ion source.

Table 1. Structure property of four ion sources.

Fig.2. Simulated magnetic flux density in(a)source 1,(b)source 2,(c)source 3,(d)source 4.
2.2. Study methods
2.2.1. Diagnosing system and method
Diagnosing the plasma density inside of the four ECR ion sources will provide important information to analyze the relation between the plasma density and magnetic fields,and also help to understand the ECR and UHR heating property.
The diagnosing system is showed by Fig.3(a). The diagnosing system is composed of solid state microwave source,circulator, attenuator, power meter, ECR ion source, a bent Langmuir probe,2D coordinator,electric power source,computer,gas tank and controller,vacuum chamber and oil diffusion vacuum pump. The incident microwave power of the ion source is calibrated before the experiment, and the reflected microwave power from the ECR ion source is transmitted to the power meter for measurement. The precision of 2D coordinator,power meter for microwave power measuring,the ammeter and voltmeter used to measure the current and voltage of the probe are separately within 0.5 mm/100 mm,0.1 W/100 W,and 0.1%. For diagnosing, as shown by Fig. 3(b), only one punched screen grid for passing probe is used. Under the action of the 2D coordinator,the Langmuir probe can be moved step-by-step in the radial and axial direction of diagnosing plane,XOZ. The data acquisition line is used to transfer the collected current and voltage signals of probe to a computer for analyzing the plasma density. The tip axis of bent Langmuir probe is vertical to the diagnosis plane,its diameter and length related with current collecting is separately 0.2 mm and 5 mm.

Fig. 3. Plasma diagnosing system: (a) facility, (b) diagnosing plane coordinate.
In the experiment,when the plasma was generated in ion source,before the probe is inserted into the ion source,the reflected power of the four sources is generally less than 20%of incident power. After the probe is inserted into, the reflected power fluctuates 5% on the basis of 20%. And since the ion source and the screen grid are grounded, the grid current is always zero during the diagnosing procedure.

In the diagnosing experiment, the thin tip can decrease the magnetic field interference on the collecting current and increase the special resolution of experiment.[20–22]The length between the adjacent diagnosing points is 5 mm, which is larger than the thickness of sheath and ensures the accuracy of data acquisition. The diagnosing experiment is just at three microwave power levels of 10 W, 20 W and 30 W, while the argon gas flow rate is fixed at 4 sccm.
2.2.2. Calculation method

whereE,ε,ε0andμ0are separately the complex number of microwave electric field intensity,the relative permittivity tensor, vacuum permittivity and permeability tensor. In the permittivity tensor,
whereme,e, j andvare separately electron mass, electronic charge quantity, imaginary unit and electron collision frequency. Equation (1) and formula (2), without the influence of wave power,build the relationship between the plasma density,magnetic field and microwave electric field,and the wave transmission and electric field intensity distribution are not associated with power but related with plasma density,n. After calculating the permittivity tensor and presenting plasma density,n,by diagnosed parameter,ni,the complex number module value of microwave electric field intensity can be obtained by solving Eq.(1)with COMSOL software.
3. Result and analysis
3.1. Result of diagnosing and analysis on the interaction between magnetic field and plasma density
The spatial distributions of the diagnosed plasma density at each ion source configuration,power levels of 10 W,20 W and 30 W and fixed argon gas flow rate of 4 sccm are shown in Fig. 4, where the red and green lines present the ECR and UHR layer, respectively. The electrons on the whole ECR layer can resonate with microwave electric field and be heated.However,on the UHR layer,only the small blue circle region,where the electron oscillating and resonating frequencies satisfy the relation ofω2=ω2ce+ω2pe,can provide the condition for electron heating. Therefore, in the ion source, electron heating mainly happens on the ECR layer, and the region of UHR wave acting on electron is so small to be neglected. The diagnosing result shows that the diagnosed density distribution of the four sources forms a bow shape expanding towards screen grid as power increasing. From the boundary of bow shape to the center,the density varies from lower to higher.
At the power level of 10 W, the plasma areas of the sources position all in region 1. The whole plasma area in source 1 is less than source 2.In sources 3 and 4,the whole ion density regions are smaller than sources 1 and 2. Therefore,only in source 2 the plasma density upwind the screen grid is the highest. As the microwave power is increased to 20 W,the ion density of the all sources increases largely, also the whole density region in sources 4,3,1,and 2 is from smaller to larger, and the variation of density before the screen grid is from lower to higher in the same serial number. This situation also presents that only in source 2 the plasma density upwind the screen grid is the highest. When the microwave power continues increasing to 30 W,the diagnosed density of the all sources increases further, the high density and whole plasma region in sources 4, 3, 2, and 1 is from smaller to larger. Compared with other sources, the plasma area of the source 1 enlarges mostly in all directions to generate higher plasma density distribution upwind the screen.

Fig.4. Diagnosed density in source(a)1,(b)2,(c)3 and(d)4 at fixed gas flow rate of 4 sccm and power levels of 10 W,20 W and 30 W.The lines of 0.15,0.11,0.8 and 0.4 respectively represent the magnetic flux density in their area,and the unit is T.
From the plasma diagnosing results, it can be seen the density distribution is decided by not only the power level but also the magnetic field. At the low and medial power level of 10 W and 20 W, the electron loss controls the plasma distribution, because at the two power levels few motive electrons can be generated to ionize gas. As Table 1 showed, even the volumes of regions 1 and 3(a)in source 1 are larger than those of source 2,and the volume of region 3(b)is inversely smaller compared with source 2, the electron annihilation caused by the longer range of migrating in region 1 is faster than that of source 2,and consequently the whole plasma region and density upwind the screen grid of source 1 is smaller and lower compared with source 2. Compared with source 4,the regions 1 and 3(b)of source 3 are separately larger and smaller to generate a larger plasma region and higher density area upwind the screen grid. Compared with sources 1 and 2, in source 3 the smaller region 1,larger regions 3(a)and(b)make the lower density distribution upwind the screen grid.
At the power level of 30 W,much more wave energy heats electrons to increase density, the electron loss is much lower compared with plasma generation. For the four sources, the source 1 has the largest region 1 and smallest region 3(b),even the electron loss in region 3(a) with larger volume is higher,the gas ionization at high power compensates the loss, therefore the whole plasma area and density upwind screen grid will be the largest and highest,separately. As for sources 2,3 and 4,the region 1 of source 2 is the largest,and its plasma density distribution property is similar to that of source 1. This situation explains that at high power level the plasma generation volume decides the plasma distribution.
3.2. Result of calculation and analysis on the interaction between plasma density and microwave electric field
To prevent the huge data operation, the calculating parameter is chosen as log10(|E|+1), where|E| is the complex number modulus of the microwave electric field intensity.For verifying the influence of microwave power on the electric field intensity,the source 4 with inside empty environment and filled by plasma generated at microwave power of 30 W is calculated at the transmission microwave powers of 10 W,20 W and 30 W.The result is showed by Fig.5,which demonstrates that the power levels influence the magnitudes of calculated parameter,however hardly change their distributions in empty and plasma environments separately.It is the plasma density to vary the calculation result largely. Therefore, the microwave electric field intensity in the four sources is calculated only at one power level of 30 W for wave transmission and three power levels of 10 W,20 W and 30 W for plasms generation or diagnosed plasma density. The results are shown by Fig.6.
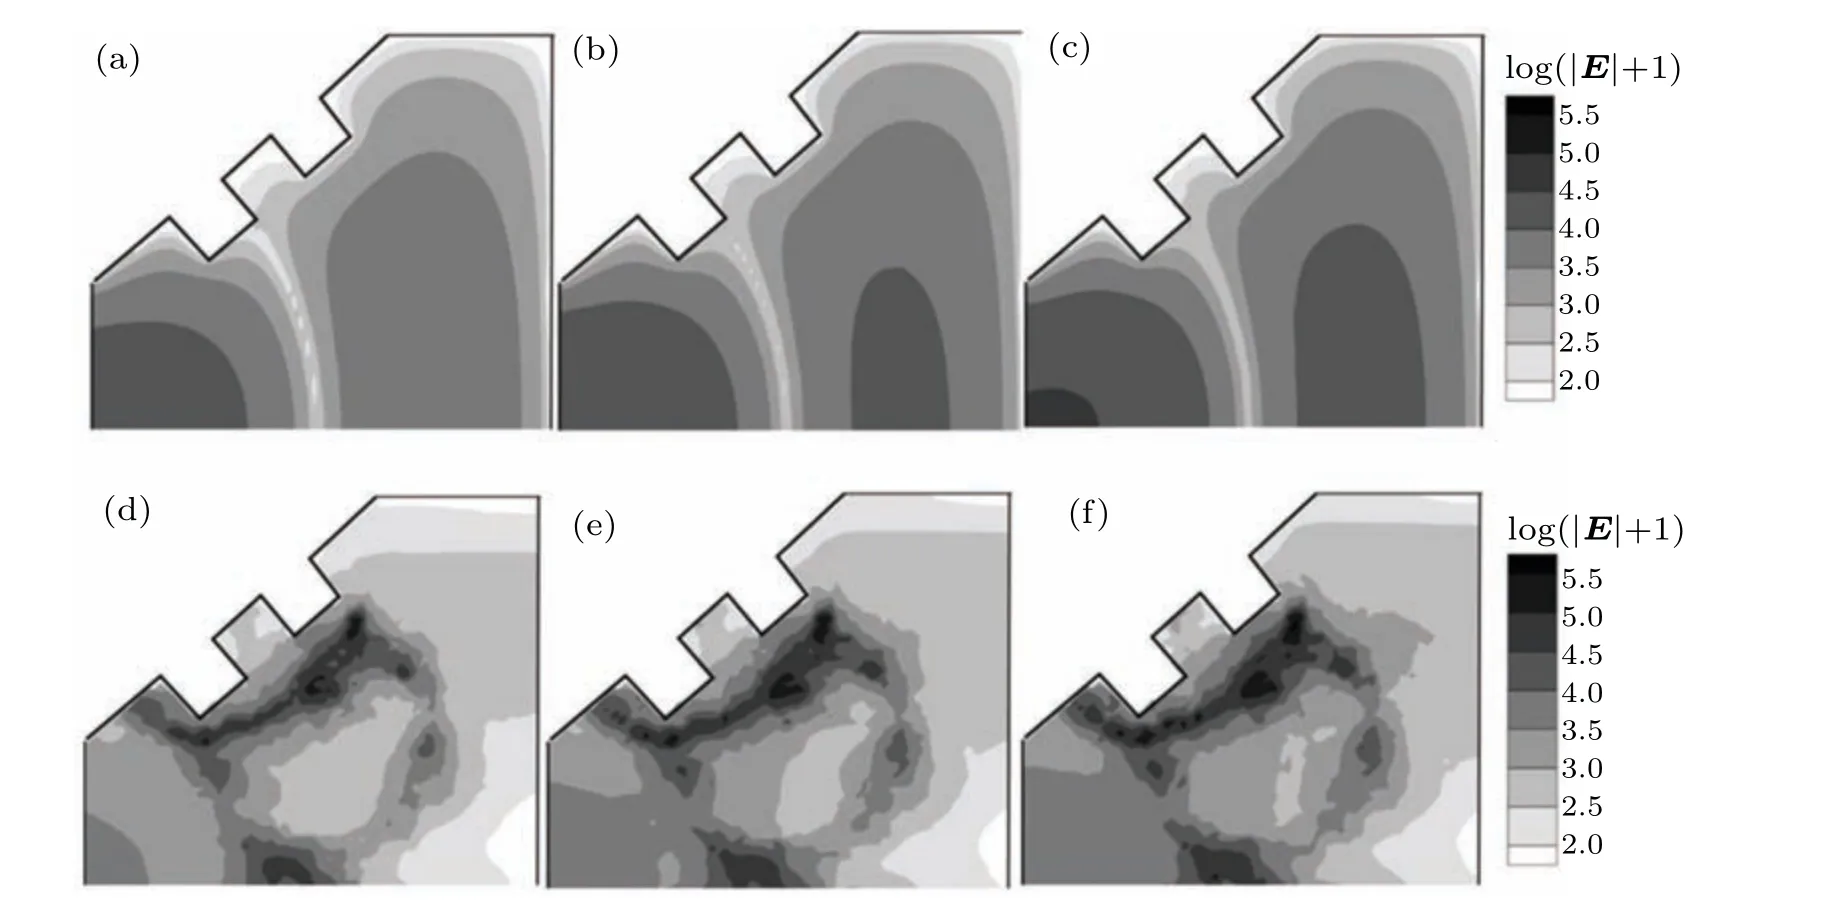
Fig.5. The distribution of calculated parameter in source 4 without plasma and at microwave power of(a)10 W,(b)20 W,(c)30 W,and with plasm induced by power of 30 W and at microwave power of(d)10 W,(e)20 W,(f)30 W.
Before the plasma is generated,it can be seen from Fig.6 that log10(|E|+1)distributions in all the sources are similar and relatively uniform, and the maximum calculated parameter is also around the axis line,which shows that the wave can transmit to the whole cavity space. But when the plasma is generated at power level of 10 W,as showed by the related pictures of Fig. 6, the calculated parameter is non-uniform, and concentrates around ECR layers,where the diagnosed density is conversely much lower as Fig.4 showing.
When the power to generate plasma increases from 10 W to 30 W, in the four sources the regions of the highest calculated parameter gradually form bow shapes similar to those of density distribution. The two kinds of bow shape overlap as showed by Figs. 4 and 6. The calculated values inside of boundary regions are higher than those in the center areas, however the density distributions in the bow shapes of Fig. 4 present reverse variations. The calculated parameter and plasma density distributions imply that the plasma has the property of dissipative medium, the large area of higher density plasma obtain more wave energy to form the large region of the low microwave electric field intensity.
As the four sources filled with plasma generated at the power of 10 W, compared with sources 1, 3 and 4, in source 2 the calculated parameter and the plasma density before the screen grid is separately weakest and highest as Figs.4 and 6 showed.When the plasma is induced at the power of 20 W and 30 W,compared with sources 3 and 4, in sources 1 and 2 the weakest microwave electric field intensity range is very near to the screen grid,and it is reasonable to observe the higher density distribution before the screen grid. In this point of view,it demonstrates that if the plasma density bow and the lower electric field intensity region inside of its bow are near to the screen grid,the density upwind the screen grid will be higher.

Fig.6. Calculated parameter in source(a)1,(b)2,(c)3,(b)4 separately with plasma generated at power of 0,10 W,20 W and 30 W.
3.3. The revelation obtained from study
For ion thruster with gas propellant,the thrust can be calculated by[24]

whereγ,Ib,M, andVbare the correction parameter of beam divergence angle and the divalent ion,the extracted ion beam current,ion mass and acceleration voltage,respectively.Therefore, thrust is proportional toIbassuming the other parameters in constant. The extracted ion beam current is calculated by

whereAs,Ts,n0andTeare grid area, ion transmittance of screen grid,electron density at the sheath boundary upstream of the screen grid,and electron temperature,respectively. The two relations show that the high and uniform distribution of plasma density upwind the screen grid is a critical factor to generate high thrust and ion beam current.
The ion beam extracting experiment data in Ref. [9] is showed by Table 2, in which the data is coincide with the plasma diagnosing result. It can be seen from the table, for source 1 at power of 30 W,the ion beam current is the highest.It satisfies the relation(7),because the above study of source 1 operating at 30 W present the highest density distribution and the bow formed by calculated parameter value are all nearest to the screen grid. At the power of 10 W and 20 W, the ion beam currents from source 2 are the highest,which is consistent with that the highest density distribution and calculated bow shape are nearest to the screen grid.

Table 2. Measured total ion beam current.
Two revelations from the diagnosing and calculation can be obtained. The first is that when creating an ECR ion source the balance between gas ionization and electron loss must been considered. The former process is related with plasma generation region 1,ECR layer and power level,and the letter procedure is associated with the electron migrating range in the region 1 and loss in region 3,both of which are decided by the magnetic field. Therefore,as the power is restricted,the trade of plasma generation and electron loss should be taken for consideration to find a best thrust performance at reasonable magnetic field structure and power level. The second is that the microwave electric field intensity, represented by the calculated parameter,is found to be tightly related with the thrust and extracted beam performance. Experiment diagnosing data provides the microwave electric field intensity calculation with more actual information, which makes the relation of plasma and microwave electromagnetic field, and ion source evaluation actually.
4. Conclusion
In the ECR ion source, the interrelationship between plasma,magnetic field and microwave electric field is studied through the diagnosing and calculation. The results show the plasma distribution is decided by plasma generation and loss procedures,both of which are related with magnetic field. The variations of plasma density and the microwave electric field intensity are contrary as microwave transmitting in plasma,from which the condition for best performance of ECR ion source can be obtained. The conclusions are as following.
(1) The diagnosed plasma density by bended probe reviews the relationship between plasma and magnetic fields. In the ion source, electrons absorb microwave energy to ionize gas according to ECR heating procedure. At different microwave power level, the action of electron heating and loss procedures on plasma generation are different. At low power,few electrons heated by ECR wave causes its loss to control the plasma density distribution. At high power condition,the action of electron heating is stronger than its loss and controls the plasma density distribution. The plasma density distribution forms bow shape,the density in the center of the shape is higher than that in the boundary region. If the plasma density upwind the grid screen is higher,the performance of ion beam extracting and thrust will be better.
(2)Based on the cold plasma hypothesis and the plasma diagnosing result,the microwave electric field intensity calculation shows that the plasma density significantly changes the wave field distribution to form bow shape. As the calculated parameter distribution inside of the bow shape varies from higher to lower,the plasma density will relatively be changed from lower to higher. If the bow and its inside lower electric field intensity region are close to the screen grid, the performance of ion beam extracting and thrust will be better.
(3) When creating an ECR ion source, the balance between gas ionization and electron loss must be considered.The two procedures are related with plasma generation region,ECR layer,power level,and electron loss decided by magnetic field. As the power is restricted, the trade of plasma generation and electron loss should be taken for consideration to find a best thrust performance. The microwave electric field intensity in plasma is found to be tightly related with the thrust and extracted ion beam performance. Experiment diagnosing data could provide microwave electric field intensity calculation with more actual information.
Data availability
The data that support the findings of this study are available from the corresponding author upon reasonable request.
Acknowledgement
Project supported by the National Natural Science Foundation of China(Grant No.11875222).

- Chinese Physics B的其它文章
- Real non-Hermitian energy spectra without any symmetry
- Propagation and modulational instability of Rossby waves in stratified fluids
- Effect of observation time on source identification of diffusion in complex networks
- Topological phase transition in cavity optomechanical system with periodical modulation
- Practical security analysis of continuous-variable quantum key distribution with an unbalanced heterodyne detector
- Photon blockade in a cavity–atom optomechanical system