
Probing the improved stability for high nickel cathode via dual-element modification in lithium-ion
2022-08-01 05:59FenglingChen陈峰岭ChaozhiZeng曾朝智ChunHuang黄淳JiannanLin林建楠YifanChen陈一帆BinbinDong董彬彬ChujunYin尹楚君SiyingTian田飔莹DapengSun孙大鹏ZhenyuZhang张振宇HongLi李泓andChaoboLi李超波
Chinese Physics B 2022年7期
关键词:大鹏
Fengling Chen(陈峰岭), Chaozhi Zeng(曾朝智), Chun Huang(黄淳),†, Jiannan Lin(林建楠),Yifan Chen(陈一帆), Binbin Dong(董彬彬), Chujun Yin(尹楚君), Siying Tian(田飔莹),Dapeng Sun(孙大鹏), Zhenyu Zhang(张振宇),‡, Hong Li(李泓), and Chaobo Li(李超波),¶
1Institute of Microelectronics,Chinese Academy of Sciences,Beijing 100029,China
2University of Chinese Academy of Sciences,Beijing 100049,China
3Shanghai Advanced Research Institute,Chinese Academy of Sciences,Shanghai 201210,China
4Beijing Welion New Energy Technology Co.,Ltd,Beijing 102402,China
5Institute of Physics,Chinese Academy of Sciences,Beijing 100190,China
Keywords: LiNi0.88Mn0.03Co0.09O2,lithium-ion battery,cathode material,modification
1. Introduction
The awareness of global warming resulting from carbon emission promoted the development of clean energy usage(wind, water, solar, and tide). Meanwhile, the storage of collected energy is enabled by lithium-ion batteries attracted by their higher energy density, longer cycle life, and lower self-discharge rate.[1–3]And, the ever-increasing application from consumer electronics, electric vehicles and smart grid raises more vigorous demand toward lithium-ion batteries.[4–7]Among the various components involved in lithium-ion cells,the cathodes currently limit the energy density and dominate the cost ratio.[8]Therefore,it is necessary to develop cathode materials with favorable requirements.
The high nickel cathode materials,derivated from LiNiO2via doping foreign elements, are a promising candidate due to the higher reversible capacity (>200 mAh/g) and higher average voltage (>3.8 V).[9]However, the discharge capacity and significant voltage decay during cycling would enormously worsen the energy density. Thus, alleviating the decrease of the discharge capacity and mitigating voltage decay is important for their practical application, especially in harsh conditions. It has been established that the undesirable voltage decay and capacity fading are linked to the irreversible structural rearrangement involving oxygen loss and cation mixing.[10–12]It was recognized that the irreversible H2–H3 phase transition at the high cut-off voltage cause microcracks and pulverization.[13]
For improving structural stability, especially at a highly delithiated state,enhancing bond strength with oxygen via elemental doping seems to be an effective strategy. According to the table of bond dissociation energies, we found that the tantalum and boron form more robust bonds with oxygen, with 839 kJ/mol and 809 kJ/mol respectively, which is greatly stable than Ni–O(366 kJ/mol).[14]According to previous work,boron is a competitive dopant for enhancing the stability of nickel-rich and lithium-rich layered cathodes.[15,16]It was revealed that the boron-doped high nickel cathode increased 15%capacity retention.[17]Additionally,the tantalum seems to be advantageous based on previous reports. For example, Sun’s group proposed the ordered occupation of transition metal ions in lithium sites stabilized lithium layer via Ta dopants.[18]Shinet al.also screened the Ta as one of the optimal dopants for inhibiting first cycle oxygen release in lithium excess cathode via Density Functional Theory.[19]In this work, the effect of tantalum and boron on the structural stability of a nickel-rich cathode (LiNi0.88Mn0.03Co0.09O2)was explored using a bare cathode as a reference and featured enhanced stability in high temperatures.
2. Experimental sections
2.1. Materials
For the preparation of TB-NMC, the precursor(Ni0.88Mn0.03Co0.09(OH)2) was coated with tantalum ethoxide(TaC10H25O5)and boric acid(H3BO3)through the ethanol evaporation process. The stoichiometric amounts of the modified precursor and LiOH·H2O were mixed with a molar ratio of 1:1 and annealed at 760°C for 12 h in oxygen blowing condition. The mass fraction of tantalum and boron elements in TB-NCM is 0.2 wt% and 0.05 wt% respectively. The BNMC and Ta-NMC are produced in the ethanol evaporation process followed by high-temperature annealing as well. The bare-NMC was synthesized by the same process without the ethanol evaporation process. All the above powder was stored in a vacuum.
2.2. Coin cell assembling and electrochemical test
To prepare the positive electrode,firstly,the cathode materials(bare-NMC,B-NMC,Ta-NMC,and TB-NMC),carbon black (super P, Timcal) and polyvinylidenefluoride (PVDF,Sovlay Group) with a weight ratio of 90:5:5 were dispersed in N-methyl pyrrolidone(NMP,MYJ Chemical Co.,Ltd.) solvent,and then the resulting slurry was coated on aluminum foil followed by drying at 120°C for~12 hours in a vacuum oven.Afterward,the cathode film was calendered using a rolling calendar with a constant speed of 3 mm/s to obtain homogenous film thickness and improve particle–particle contact. The test cells were assembled into CR2032 coin-type cells in an argonfilled glove box,with Li foil as the anode and Celgard 3501 as the separator.The electrode diameter was 12 mm and the cathode material load was around 12.0 mg/cm2. The amount of electrolyte (1-M LiPF6dissolved in EC/DEC/EMC with volume ratio=1:1:1) used in each coin cell was 90 μL. All the cells were placed for 6 hours before the test to ensure sufficient infiltration of the electrolyte. All the cells were activated at 0.1 C (1 C=220 mAh/g) for two cycles before the subsequent cycle (1 C/1 C), and those electrochemical tests were carried out using the galvanostatic charge/discharge method(LANHE, CT2001A) between 3.0 V–4.4 V, 3.0 V–3.5 V, and 3.0 V–3.6 V(versusLi/Li+)at room temperature(RT),45°C and 60°C.Cyclic voltammetry(CV)tests were performed on an RST 5200F electrochemical workstation at a scan rate of 0.1 mV/s and a voltage range of 3.0 V–4.4 V.
2.3. Characterization
The cathode materials were measured by Powder xray diffraction (XRD, Brucker D8 Advanced) to identify the sample phase. The sample morphology and microstructure were acquired on scanning electron microscopy (SEM, Hitach SU8200) and transmission electron spectroscopy (TEM,FEI Talos F200X). Electrodes were punched to 3-mm disc and ion polished (Gatan PIPS II MODEL 695) to observe the cross-sectional image at 4 kV for 90 min. Besides, energy dispersive x-ray spectroscopy (EDS) mapping was implemented by using EDS equipment connected to SEM. Xray photoelectron spectroscopy(XPS,Thermo escalab 250Xi)analysis was conducted to investigate the valance state of the main element composition on the surface of materials. The cross-section of cycled electrodes was fabricated by an ion milling machine (Gatan 691). For TOF-SIMS (time-of-flight secondary ion mass spectroscopy) analysis, the cross-section of TB-NMC cathode was prepared via Ar+milling to expose the inner part of particles. TOF-SIMS depth profiles and mass spectra were obtained with a TOF-SIMS(ION-TOF Gmbh)in positive polarity and ultrahigh vacuum(~10-9Torr,1 Torr=1.33322×10²Pa). For depth profiling, a Cs+beam(~1 nA, 30 kV) was applied to sputter 10 μm×10 μm. The secondary ions are generated from a specimen and analyzed through TOF-SIMS analyzer,producing mass spectra.
3. Results and discussion
3.1. Electrochemical test
It is reported that the tantalum and boron elements both have an excellent effect on the improved electrochemical performance of high nickel cathodes.[18,20–23]While it is meaningful to compare its profound effects within a wide range of temperature and cutoff voltage. So,here,we select the borondoped NMC (B-NMC), tantalum coated NMC (Ta-NMC),boron and tantalum co-modified NMC(TB-NMC),and bare-NMC as research targets to pursue deep insight on different conditions. The fundamental performance of NMC cathodes was assessed in half cells. Testing was conducted at 0.1 C for the first two cycles to evaluate the intrinsic cathode capacities,and 1 C for the following 100 cycles to estimate the stability of the cathode. As shown in Fig. 1, we examined those samples at room temperature (RT), 45°C and 60°C within the voltage range of 3.0 V–4.4 V, 3.0 V–4.5 V, and 3.0 V–4.6 V respectively. To gain insight into the delithiation and lithiation processes, the charge/discharge curves are plotted.Those curves featured typical nickel-rich cathode characteristics,with a large voltage plateau ranging from 3.6 V to 4.1 V accompanied by a small plateau at around 4.25 V.[21]The charge reaction below 4.1 V may be attributed to the oxidation of Ni, and that of the plateau region beyond 4.2 V is related to the phase transition of hexagonal to hexagonal (H2 to H3)for Ni-rich layered compounds.[24]All three modified cathodes deliver nearly identical initial discharge/charge capacity at the same testing condition as shown in Supplementary Table S1. The discharge capacity ranged from 223 mAh/g–239 mAh/g at room temperature, 234 mAh/g–243 mAh/g at 45°C and 233 mAh/g–248.6 mAh/g at 60°C. The tantalum involved cathodes deliver a slightly larger capacity, probably owing to the enhanced interlayer spacing at the surface and increased diffusion capacity of Li+. For example,the initial discharge capacity of TB-NMC is 248.6 mAh/g at 60°C within the voltage range of 3.0 V–4.6 V,which corresponds to 0.9 mol of Li/mol in LiNi0.88Co0.09Mn0.03O2with a theoretical capacity of 274.82 mAh/g. The initial discharge capacity increase with the enhanced temperature and cut-off voltage, in which the higher temperature accelerates charge transfer kinetics and higher voltage drive more ions/electrons to the anode side. To explore the enhanced capacity at high temperature and voltage,the charge–discharge curves and differential capacity are plotted for the NMC cathode in Supplementary materials Fig.S1.At higher voltage, the tails of the voltage profiles lengthed to give even higher charge/discharge capacities as seen in Supplementary materials Fig. S1(a). In discharging process, the peak shoulder around 3.6 V was arisen to provide additional capacity as shown in Fig. S1(b). However, the kinetic hindrance and H1–M phase transition peak shifted to lower voltage in the charging process and broadens the peak area to provide additional capacity at high temperature (Supplementary materials Fig. S1(c)).[25]In discharging process, the voltage plateau is prolonged below 3.6 V,which is behaved as an additional peak in Supplementary material Fig.S1(d).
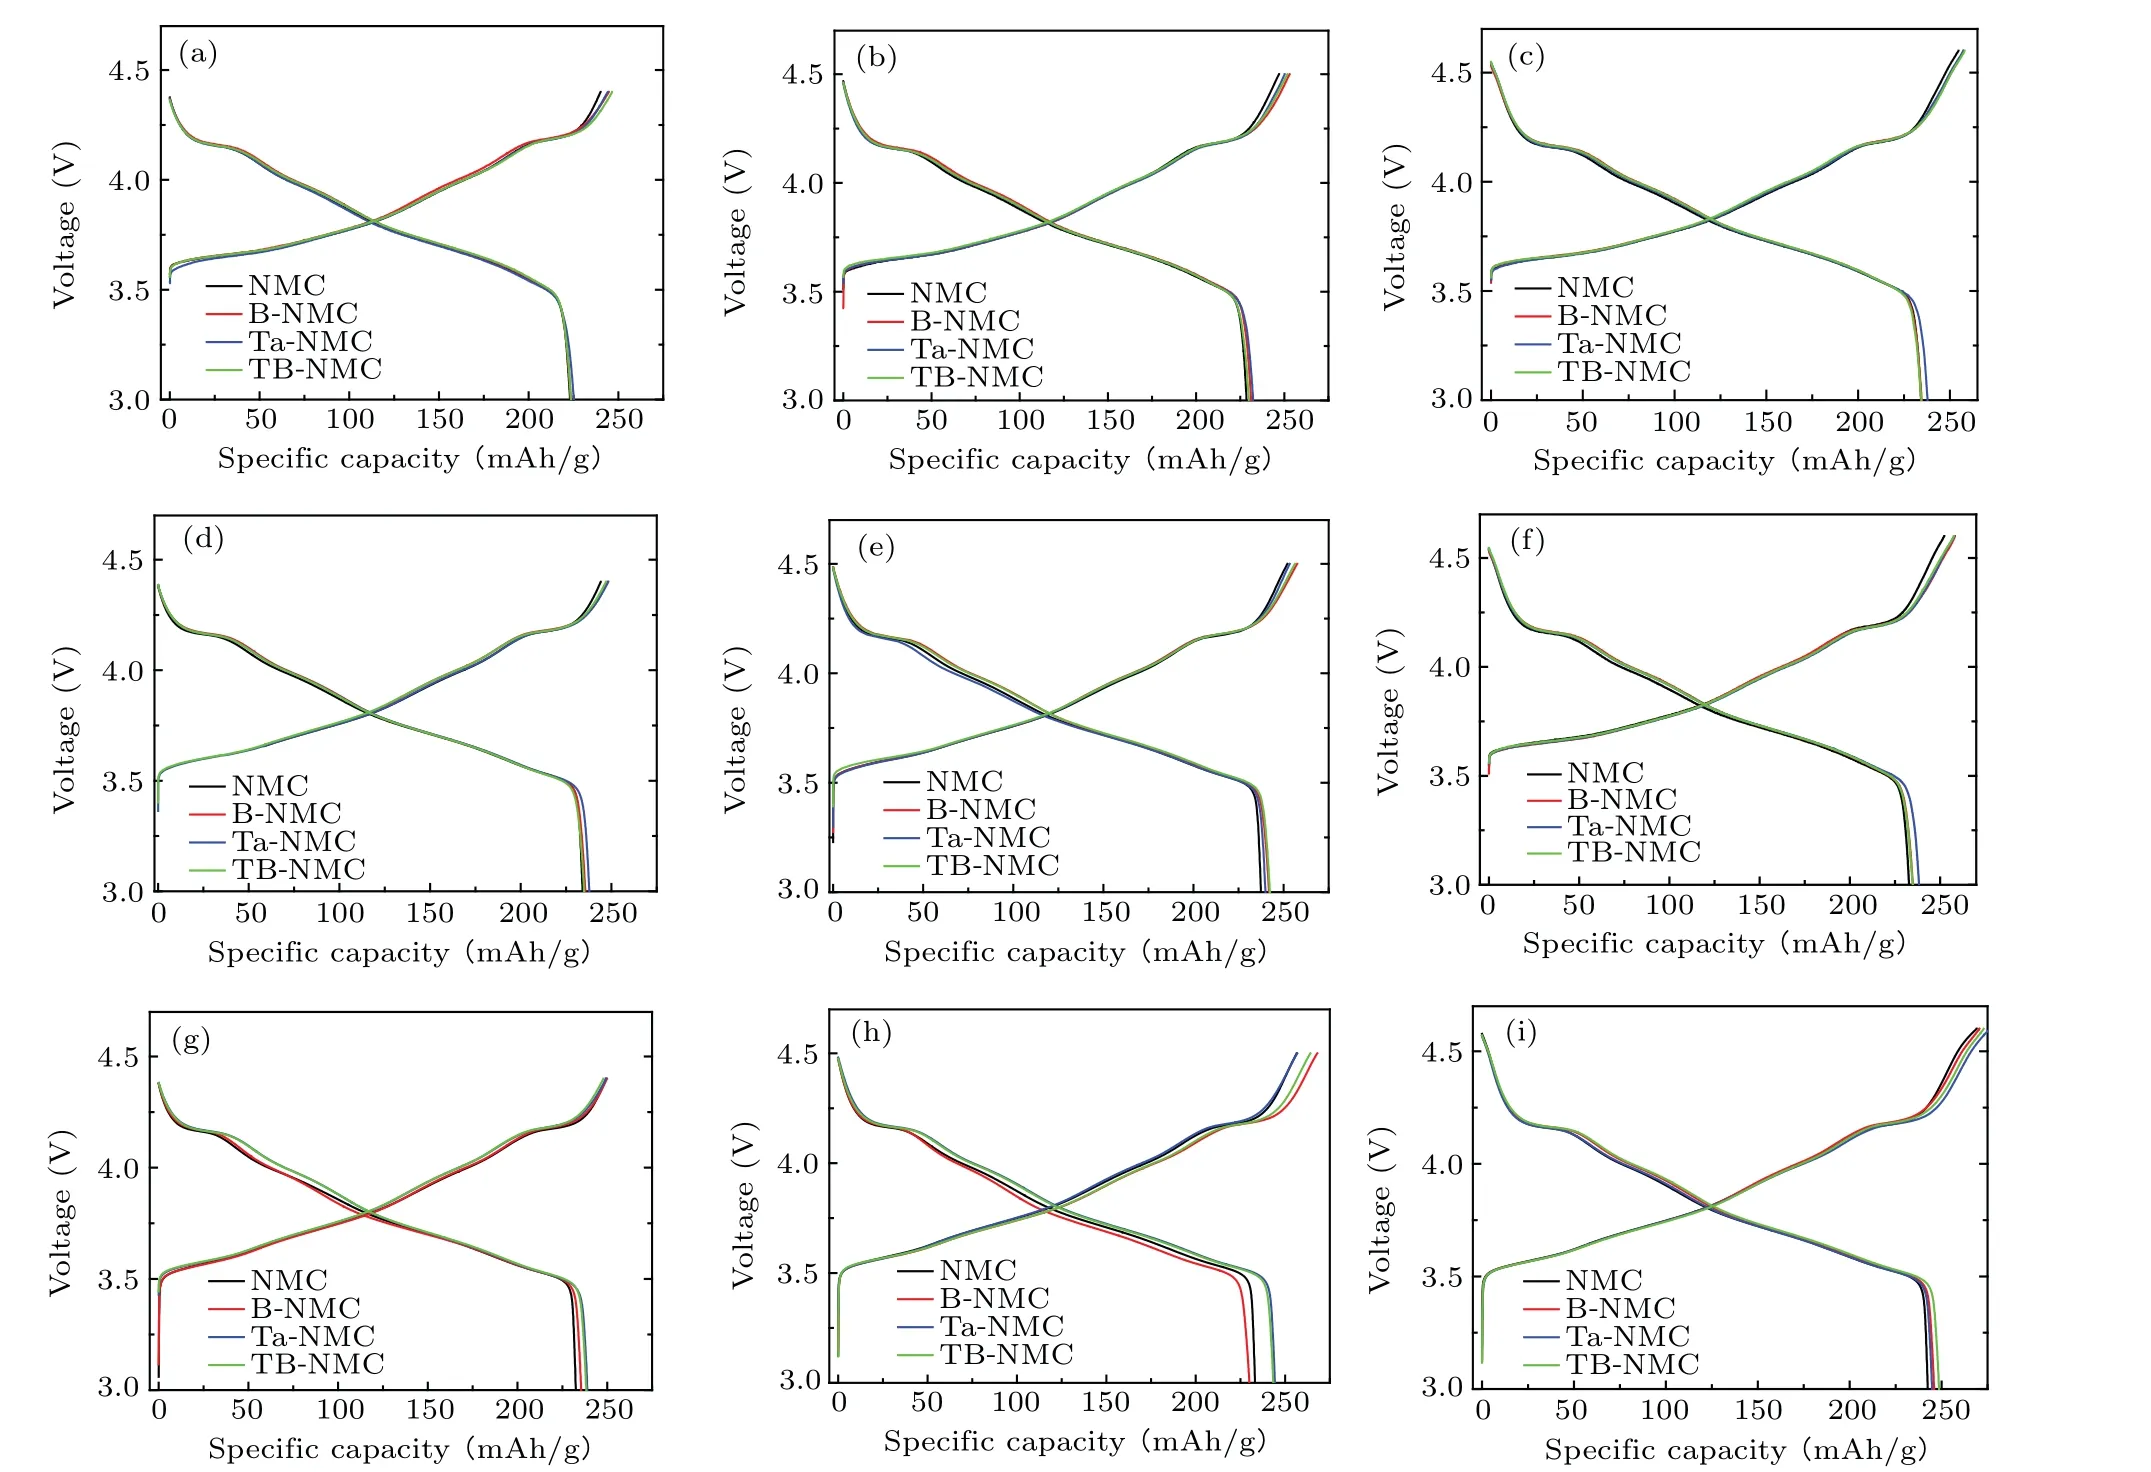
Fig. 1. Initial charge/discharge profile of NMC (black), B-NMC (red), Ta-NMC (blue), and TB-NMC (green) at different temperatures and voltage ranges: (a) 3.0 V–4.4 V, RT; (b) 3.0 V–4.5 V, RT; (c) 3.0 V–4.6 V, RT; (d) 3.0 V–4.4 V, 45 °C; (e) 3.0 V–4.5 V, 45 °C; (f) 3.0 V–4.6 V, 45 °C; (g)3.0 V–4.4 V,60 °C;(h)3.0–4.5 V,60 °C;and(i)3.0 V–4.6 V,60 °C.
Whereas the capacity deteriorates with prolonged cycling as shown in Fig. 2, and the harsh condition would accelerate the degradation process. At room temperature, the Ta-NMC exhibits a larger discharge specific capacity at the first 50 cycles and TB-NMC shows a much slower capacity decrease with larger capacity retention in the whole process(Figs.2(a)–2(c). Specifically, they both delivered about 190 mAh/g of discharge capacity after 100 cycles at 4.6 V for Ta-NMC and TB-NMC with capacity retention of 88.5%and 89.8%respectively. As increasing the working temperature to 45°C, the Ta-NMC still delivers a larger discharge specific capacity compared to others within the voltage range of 3.0 V–4.4 V after 100 cycles as shown in Fig.2(d)with a discharge capacity of 186.7 mAh/g, 191.5 mAh/g, 194.7 mAh/g, and 194.1 mAh/g for NMC,B-NMC,Ta-NMC and TB-NMC.When further increasing cutoff voltage,the Ta-NMC decreases faster than TBNMC (Figs. 2(e) and 2(f)). It is intimately related to the structural stability of TB-NMC cathode. Notably,the B-NMC showed slightly larger capacity retention at this temperature.At 60°C, the tantalum involved cathode remains higher capacity retention as well as larger discharge specific capacity as shown in Figs.2(g)–2(i). Additionally,the capacity is suddenly decreased at harsh conditions especially for bare NMC cathode,which may result from a side reaction between electrolytes. It is worth mentioning that the synergetic effect of tantalum and boron is significant in terms of enhanced discharge capacity and cycling performance. Thereby,the introduction of boron and tantalum had an unignorable effect on thermal stability during the removal and uptake of lithium-ion from the layered host structure.
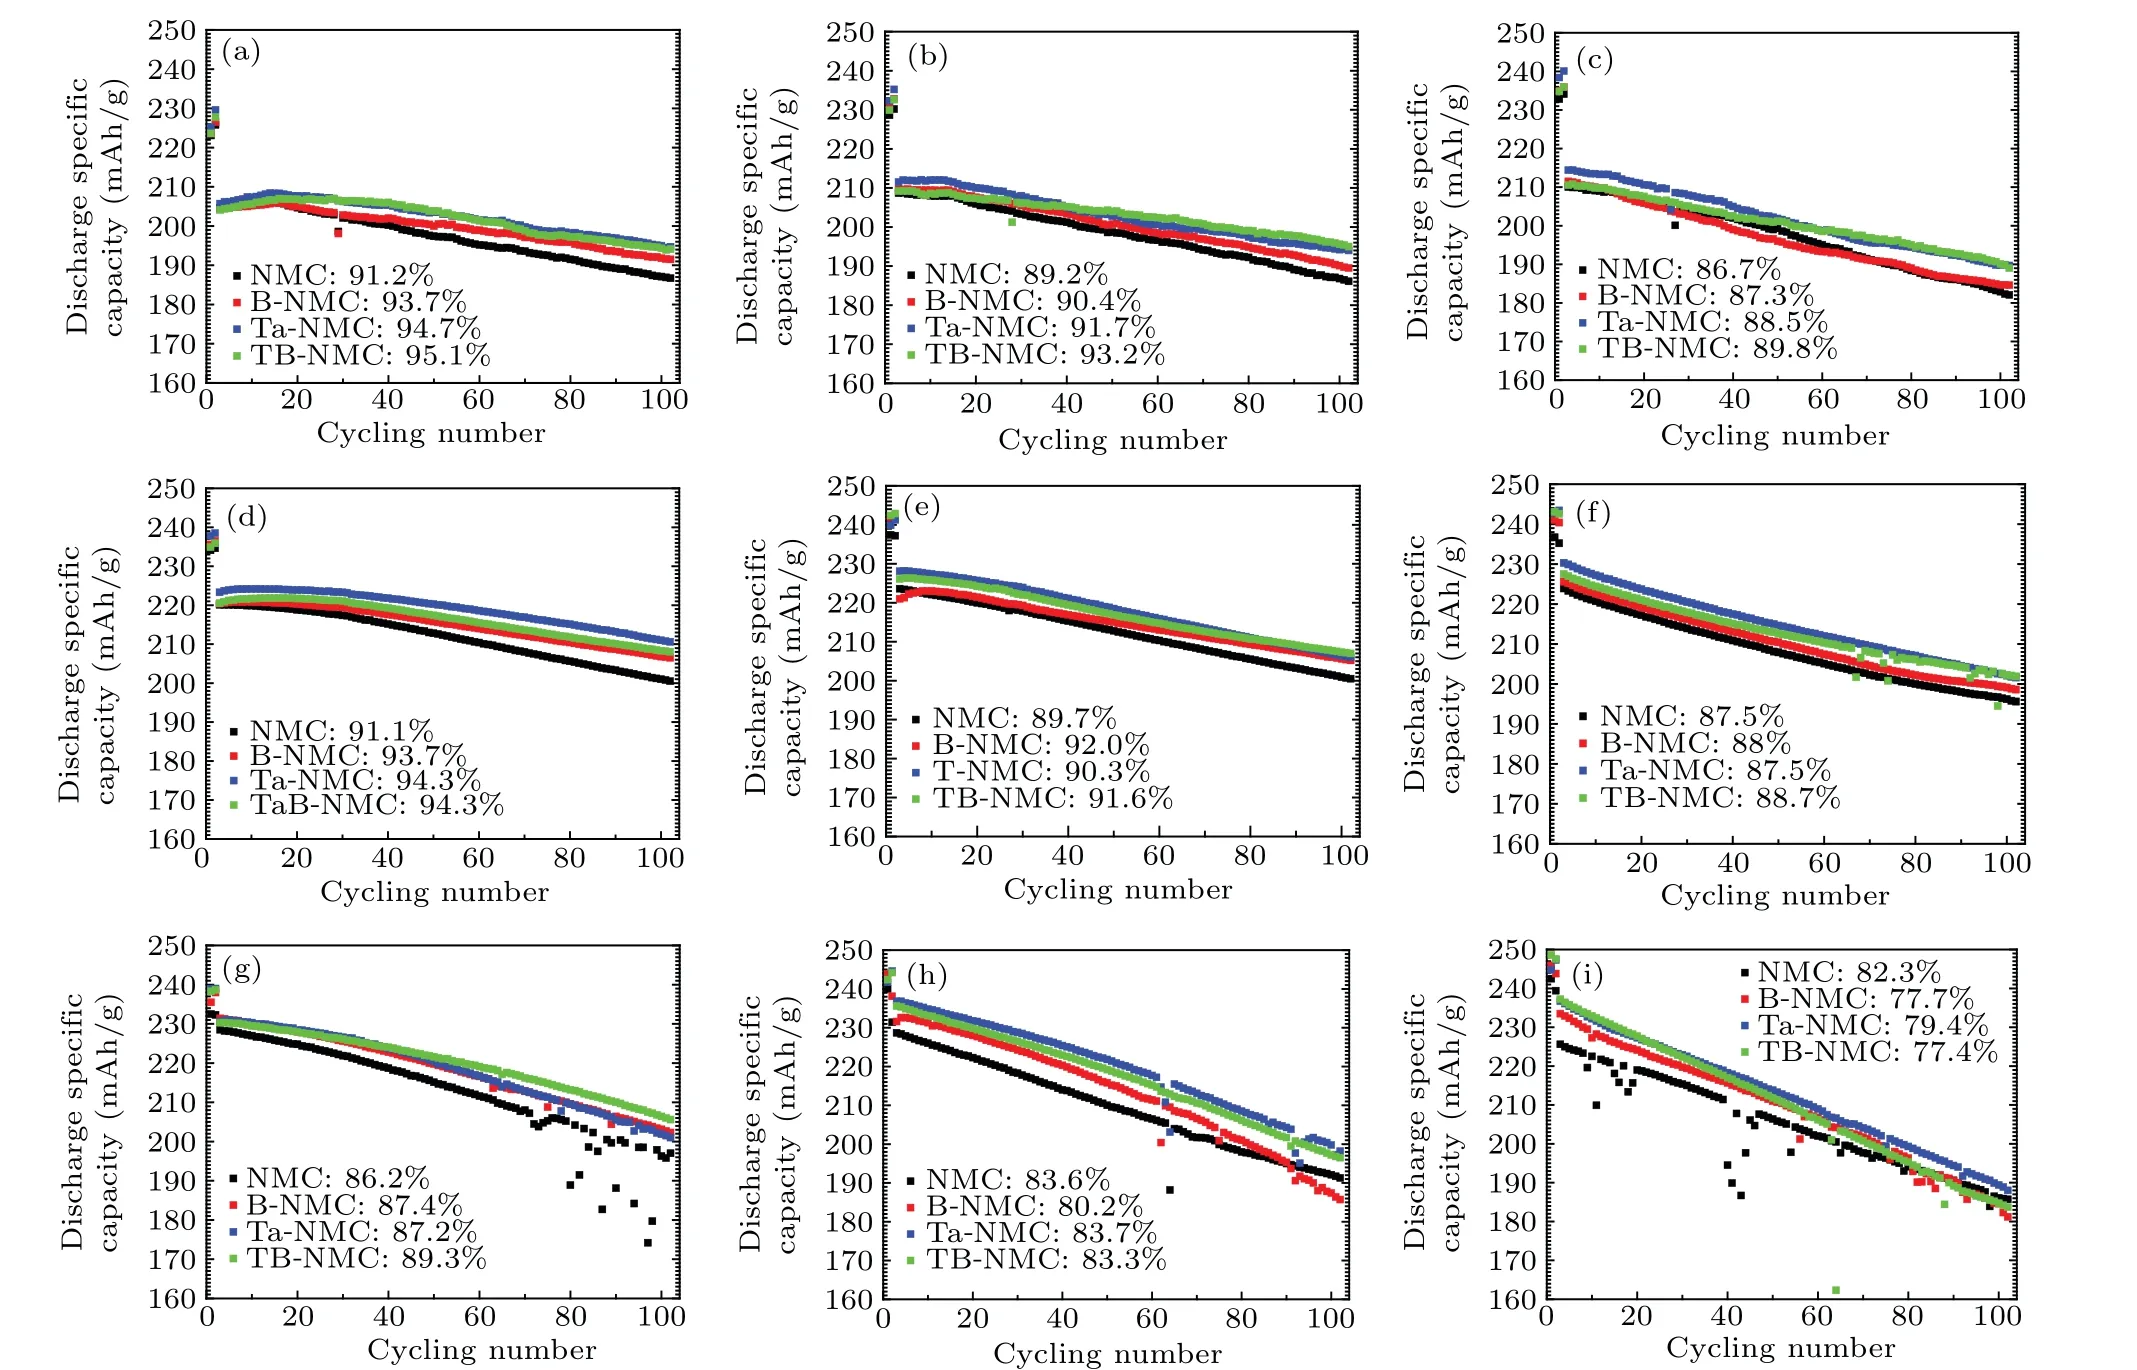
Fig. 2. Cycling performance of NMC, B-NMC, Ta-NMC, and TB-NMC at 1 C for 100 cycles with different conditions: (a) 3.0 V–4.4 V, RT; (b)3.0 V–4.5 V,RT;(c)3.0 V–4.6 V,RT;(d)3.0 V–4.4 V,45 °C;(e)3.0 V–4.5 V,45 °C;(f)3.0 V–4.6 V,45 °C;(g)3.0 V–4.4 V,60 °C;(h)3.0 V–4.5 V,60 °C;and(i)3.0 V–4.6 V,60 °C.
Moreover, to explore the voltage polarization with cycling, the charge–discharge curves are plotted in steps of 50 cycles as displayed in Fig. 3. It shows the voltage–capacity profiles of NMC,B-NMC,Ta-NMC,and TB-NMC cycled between 3.0 V–4.5 V. The curves of all the cathodes showed a similar charge–discharge plateau,with all of the charge curve arisen and the discharge curve lowered during extended cycling. The NMC suffers from more severe electrode polarization as indicating the irreversible structural change upon highvoltage cycling. This phenomenon may be attributed to the phase transition and surface reconstruction. These observations are significantly suppressed by B/Ta/TB modifications with enhanced capacity retentions and mitigated electrode polarization.This behavior can be closely related to the excellent surface and bulk structural stability.
To inspect the charge storage capability of samples at high temperature, the open-circuit voltage is measured after being charged to 4.6 V at 0.1 C after two cycles of the activation process as shown in Fig. 4. All the above processes are conducted at elevated temperatures, including charging and storage. Upon the cathode storage at the idling state,the electrolyte decomposed and the produced electrons migrated towards the oxidized electrode.[26]Meanwhile, the lithium-ion re-intercalated into the layered structure for the charge balance.[27]After storage of 12 days, the modified three samples remained low self-discharge compared to bare-NMC in Fig. 4(a) with 4.187 V for B-NMC, 4.184 V for Ta-NMC and 4.188 V for TB-NMC, compared to 4.116 V for bare NMC. It corresponds to 89.48% (NMC), 91.04% (BNMC),90.95%(Ta-NMC),and 91.04%(TB-NMC)of its initial voltage(4.6 V).The difference was enlarged after 20 days(Fig.4(b)),and the TB-NMC shows a larger open-circuit voltage with 89.67% voltage retention, in contrast to 86.63% for bare NMC. This is attributed to the introduction of the outer tantalum oxide layer and internal boron atoms, which withstand the electrolyte decomposition as well as the voltage drop at high temperatures. Smaller voltage drops mean that the batteries offer a better shelf-life. Based on the above analysis,we choose TB-NMC for further investigation.

Fig.3. Charging/discharging voltage curve for NMC,B-NMC,Ta-NMC,and TB-NMC in the voltage range of 3.0 V–4.5 V at different temperatures in steps of 50 cycles: (a)–(d)room temperature,(e)–(h)45 °C,and(i)–(l)60 °C.

Fig.4. Open circuit voltage after(a)12 days and(b)20 days for NMC,B-NMC,Ta-NMC,and TB-NMC.The coin cell was charged to 4.6 V at 45 °C and stored at 45 °C.
Figure 5 shows the SEM image of prepared cathodes.Both cathodes consist of nearly spherical particles with an average diameter of 10 μm. Interestingly, the shape of the primary particle is approximately equiaxed for bare NMC in Fig. 5(a) and they tend to elongate after the introduction of Ta and B elements during the lithiation process as seen from Fig. 5(b). The high aspect ratio (length/width of the particle)of the primary particles probably owing to the dominance of the (003) facet.[17,28]It is noted that the larger grain size for bare NMC will elongate the lithium diffusion pathway and deteriorate rate performance.[29]The EDS image of the TB-NMC illustrates the uniform distribution of tantalum elements at the surface of the NMC in Fig. 5(c). However, as a light element, boron is difficult to be detected using EDS measurements due to its low photon energy.[30]The crosssectional image illustrates the small difference in primary particle morphology.After comparison of the primary particles in Figs. 5(d) and 5(e), we can find the TB-NMC have a smaller size in TB-NMC.From a morphological point,the addition of boron or tantalum during the lithiation process are reported to facilitate the growth of radially aligned primary particle.[20,28]It was also confirmed that the rod-like primary particle is more strain tolerant and enormously slow down the formation of microcracks in secondary particles.[31]While, the few amounts of boron may not bring obvious change in morphology,since the large part of tantalum is dispersed at the surface and subsurface region with concentration gradient manner, which is rich in surface and rarely dispersed in core (Supplementary materials Fig.S2).
Meanwhile, the boron is absent at the surface and detected after etching 10 nm in the TB-NMC sample as shown in Fig.5(f),confirming that the boron exists at the inner part.[32]Whereas the tantalum is mainly dispersed at the surface of the particles and only a small part of tantalum is present within the bulk (Supplementary materials Fig. S2). In Fig. S2, the TOF-SIMS spectra of secondary-ion fragments are collected for ion-milled TB-NMC electrodes.A strong lithium peak and the presence of nickel,cobalt and manganese are observed in Fig. S2(c). Boron is detected with small intensity owing to its minor content. In Fig.S2(d), the depth profile of boron is plotted,which demonstrates the dispersion of boron is rich in bulk and scare in the surface as the sample is tested after ion milling.The structure of obtained powder was examined by xray diffraction(XRD)equipment in Supplementary materials Figs.S2(e)and S2(f)and the resultant refinement data shown in Table S2. Both of the bare-NMC and TB-NMC samples reveal layered hexagonalR-3mstructure in theα-NaFeO2space group.[33]Usually,the explicit splitting of the(006)/(102)and(108)/(110)peaks is an indicator of the well-layered structure in the inset of Figs.S2(e)and S2(f).[18]Meanwhile,the peaks of(003)and(104)did not show a significant shift after modification. However,the modification lead to lower cation mixing certificated by lower Ni2+/Ni3+for TB-NMC (0.39) in contrast to 0.68 for bare-NMC in XPS measurement(Supplementary materials Fig.S3).[31]The higher amount of Ni3+ion ensured a well-aligned structure and minimized microcracking during cycling.[34]

Fig.5. SEM of(a)bare-NMC,(b)TB-NMC,and(c)EDS of TB-NMC.Cross-sectional SEM image of(d)bare-NMC and(e)TB-NMC electrode after ion polishing. (f)XPS spectra of B 1s in TB-NMC sample.
3.2. Morphology and surface analyzing
Structure features of bare-NMC and TB-NMC after 100 cycles are examined by TEM and FFT (fast Fourier transformation). About 18-nm film was observed at the surface of the bare-NMC as shown in Fig. 6(a). The cycled bare-NMC cathode presents a remarkable difference from surface to bulk. As evidenced by the FFT images, the surface of the particle exhibit the well-defined lattice fringe with lattice distance of 0.1965 nm and 0.1475 nm, which are assigned to the (200) and (220) crystal planes of the NiO rock salt phase(PDF#97-002-4014).[35]At the transition layer,the mixture of spinel and rock salt phase is observed.[36]At the bulk site, the FFT image demonstrates the dominance ofFd-3mphase with lattice fringe of 0.2515 nm, 0.2099 nm, and 0.4660 nm,corresponding to the(311),(400),and(111)planes(PDF#97-004-0485).[37–39]The bare-NMC undergoes serious phase transition under extended cycling. Such a phase transformation of bare-NMC is probably attributed to the Li/O loss followed by rearrangements of transition metal cations during cycling.[40–42]By contrast, it is noticeable as shown in Fig.6(b)that the TB-NMC shows well preservedR-3mphase covered by the thinner amorphous film(10 nm)which protects the layered phase under repeated cycling. The selected region in the inset also demonstrates the perfect structural integrity of both transitional and bulk layers. Ordered lattice fringe can be indexed to(101)planes in theR-3mspace group(PDF#97-004-4263).[43,44]Additionally, the preferential orientation of the(101)plane may be favorable for lithium-ion diffusion and electrochemical performance.[45]To observe the internal state of the particles after cycling, the cycled electrode was disassembled and wash with DMC several times. The ion milled electrodes present many cracks, especially for two contacted particles,which may result from the rolling process.However,bare-NMC exhibits more cracks even at separated particle regions as shown in Fig.6(c). Comparatively,the TB-NMC retains morphological integrity after 100 cycles(Fig.6(d)). The instability of the bare sample may be related to the cation mixing behavior as confirmed by the XRD refinement result as shown in Supplementary materials Fig.S4 and Table S3,with 20%and 15%cation disordering in bare-NMC and TB-NMC,respectively. Compared to the XRD refinement result from pristine samples in Table S2, there is no clear change in theaaxis andcaxis,indicating the good reversibility of the host structure. The cell volume expands slightly with 0.18% for bare-NMC and 0.30%for TB-NMC,confirming the quite stable crystal structure during the redox process.
Meanwhile, cyclic voltammograms of the pristine and decorated NMC electrodes are conducted to investigate the modifying effect on the formation process and electrochemical reversibility. The CV curves at various cycles are shown in Supplementary materials Fig. S5. With the potential scanning to the higher values in the anodic branch,a phase transition occurs from first hexagonal to monoclinic(H1–M),monoclinic to second hexagonal(M–H2),second hexagonal to third hexagonal (H2–H3). The reversal of these phase transitions happens in the cathodic branch. The anodic/cathodic peaks around 3.7 V and 4.0 V corresponds to the oxidation/reduction of Ni2+/Ni4+and Co3+/Co4+. The cathodic peak around 3.51 V–3.35 V refers to the Mn4+/Mn3+change.[46]The first anodic peaks difference between first and second/third cycles are summarized in Supplementary Table S4. The first cycle forms a large anodic peak due to the formation of the cathode-electrolyte interphase layer or activation process in the electrode.[31]The bare NMC gives a potential difference of 0.1028 V and 0.0717 V at the second and third cycles. However, these values increased for TB-NMC with 0.1078 V and 0.0898 V respectively, which implies the larger polarization carried from tantalum and boron. At second cycles, the main anodic peak of TB-NMC(3.66 V)occurred at a higher potential than bare-NMC (3.63 V). It seems that the modification causes the formation process to occur at higher potentials by preventing the direct contact of the electrolyte with the cathode material,and lithium-ion diffusion is slowed down.[47]Meanwhile, the EIS (electrochemical impedance spectroscopy) results in Supplementary materials Fig.S6 show the similar surface film and charge transfer impedance of two samples after the 1st,50th,and 100th cycles. It means the slightly increased impedance may not the prominent factor of structural failure and cycling degradation.

Fig. 6. TEM (transmission electron microscopy) images for (a) bare-NMC and(b)TB-NMC.Cross-sectional SEM image of(c)bare-NMC and(d)TBNMC.Those electrodes are cycled 100 times at 45 °C in a voltage range of 3.0 V–4.4 V.Inset shows FFT(fast Fourier transformed)image in the marked region.
To understand the modification effect on the compositional difference of CEI (cathode electrolyte interphase)formed at the surface of bare-NMC and TB-NMC,the cathode was disassembled and washed for XPS analysis after cycling at 45°C for 100 cycles. The C 1s,F 1s,and O 1s spectra are presented in Figs.7(a)–7(c). The C–C(284.8 eV)is attributed to carbon black, while the peaks of C–O (286.3 eV), and C=O (289.2 eV) are assigned to electrolyte decomposition and C–F(290.5 eV)results from PVDF binder in Fig.7(a).[48]In F 1s spectra (Fig. 7(b)), the Li–F (685 eV) and C–F(688 eV) predominantly originate from CF2CH2/LiPF6in an electrolyte.[49,50]Figure 7(c) shows the C=O(531.6 eV)and C–O (533.2 eV) in O 1s, generated from the decomposition of the carbonate solvent.[51]Given the fact that the sensitivity of sample making and testing environment for XPS measurement, the collected data were normalized and presented as a pie chart in Fig. 7(d). We can directly find that the ratio of the C–C and C–O/C=O are similar for the two samples, ascribing to the decomposition of the electrolyte. The main difference is laid in the percentage of fluoride components. TB-NMC shows a stronger Li–F (685 eV) peak than bare-NMC. It means the modified electrodes facilitate electrolyte decomposition and allow thein-situformation of LiF film. With more LiF content in TB-NMC, the surface of the cycled particle remains ordered as confirmed by the TEM image (Fig. 6(d)). Incorporating the TEM image, we can conclude that the LiF exerts a favorable impact on surface protection. Since many reports claimed the positive effect of LiF coating as HF scavenger.[52,53]

Fig.7. XPS spectra of(a)C 1s,(b)F 1s,and(c)O 1s. (d)The substance concentration for bare-NMC and TB-NMC after 100 cycles at 45 °C between 3.0 V–4.4 V at 1 C.
4. Conclusion and perspectives
In concolusion, we investigated the unique effect of tantalum and boron on electrochemical performance at different working conditions. The co-modified cathode shows desirable electrochemical performance at high temperatures and high cut-off voltage. The TB-NMC cathode still delivered 196.5 mAh/g with 4.5-V cutoff voltage at 60°C after 100 cycles, compared to 191.3 mAh/g for bare NMC. Furthermore,the co-modifying strategy mitigates the self-discharge at high temperature, with 91.04% voltage retention for TB-NMC after 12 days storage in contrast to 89.48%for bare-NMC.And also, it mitigates the formation of microcracks at the internal part of the particles and alleviates the phase transition at the surface,thereby,reducing the electrolyte attack and enhancing the interface stability. Besides, the cycling performance has been significantly improved, even at high temperatures and voltage. Therefore, this research provides an effective strategy for improving the structural stability and electrochemical property of high nickel cathode material for industry.
Acknowledgements
Project supported by the Key Laboratory Fund (Grant No.6142804200303)from Science and Technology on Microsystem Laboratory,the Key Research Program of Frontier Sciences of the Chinese Academy of Sciences: Original Innovation Projects from 0 to 1 (Grant No. ZDBS-LY-JSC010),Beijing Municipal Science&Technology Commission(Grant No.Z191100004719001).
Zhenyu Zhang, Hong Li and Chaobo Li conceived and directed the project. Fengling Chen performed synthesis,performance testing, and characterization. Chaozhi Zeng, Jiannan Lin,Yifan Chen,and Binbin Dong assisted the synthesis.Siying Tian,Dapeng Sun,Jing Xie,and Chujun Yin collected and analyzed the XRD, SEM, and TEM data. Chun Huang revised the manuscript. Fengling Chen wrote the manuscript with assistance from all the authors.
猜你喜欢
华人时刊(2022年7期)2022-06-05
Chinese Physics B(2022年4期)2022-04-12
伙伴(2020年4期)2020-05-11
当代工人(2019年20期)2019-12-13
福建中学数学(2018年1期)2018-11-29
北京广播电视报(2017年39期)2018-02-28
中国公路(2017年14期)2017-09-26
南都娱乐周刊(2017年16期)2017-08-30
艺术评论(2017年3期)2017-05-04
校园英语·下旬(2014年12期)2014-10-21
- Chinese Physics B的其它文章
- Real non-Hermitian energy spectra without any symmetry
- Propagation and modulational instability of Rossby waves in stratified fluids
- Effect of observation time on source identification of diffusion in complex networks
- Topological phase transition in cavity optomechanical system with periodical modulation
- Practical security analysis of continuous-variable quantum key distribution with an unbalanced heterodyne detector
- Photon blockade in a cavity–atom optomechanical system