
Differences in action potential propagation speed and axon initial segment plasticity between neurons from Sprague-Dawley rats and C57BL/6 mice
2022-08-05 10:42ZhiYaChenLuxinPengMengdiZhaoYuLiMochizukiTakahikoLouisTaoPengZouYanZhang
Zoological Research 2022年4期
Zhi-Ya Chen ,Luxin Peng ,Mengdi Zhao ,Yu Li ,Mochizuki Takahiko ,Louis Tao ,Peng Zou,5,6,8,*,Yan Zhang,*
1 State Key Laboratory of Membrane Biology, College of Life Sciences, Peking University, Beijing 100871, China
2 College of Chemistry and Molecular Engineering, Synthetic and Functional Biomolecules Center, Beijing National Laboratory for Molecular Sciences, Key Laboratory of Bioorganic Chemistry and Molecular Engineering of Ministry of Education, Peking University,Beijing 100871, China
3 Center for Quantitative Biology, Academy for Advanced Interdisciplinary Studies, Peking University, Beijing 100871, China
4 Center for Bioinformatics, National Laboratory of Protein Engineering and Plant Genetic Engineering, School of Life Sciences, Peking University, Beijing 100871, China
5 Peking-Tsinghua Center for Life Sciences, Peking University, Beijing 100871, China
6 PKU-IDG/McGovern Institute for Brain Research, Peking University, Beijing 100871, China
7 Beijing Academy of Artificial Intelligence, Beijing 100084, China
8 Chinese Institute for Brain Research (CIBR), Beijing 102206, China
ABSTRACT Action potentials (APs) in neurons are generated at the axon initial segment (AIS).AP dynamics,including initiation and propagation,are intimately associated with neuronal excitability and neurotransmitter release kinetics.Most learning and memory studies at the single-neuron level have relied on the use of animal models,most notably rodents.Here,we studied AP initiation and propagation in cultured hippocampal neurons from Sprague-Dawley (SD) rats and C57BL/6 (C57) mice with genetically encoded voltage indicator (GEVI)-based voltage imaging.Our data showed that APs traveled bidirectionally in neurons from both species;forward-propagating APs (fpAPs) had a different speed than backpropagating APs (bpAPs).Additionally,we observed distinct AP propagation characteristics in AISs emerging from the somatic envelope compared to those originating from dendrites.Compared with rat neurons,mouse neurons exhibited higher bpAP speed and lower fpAP speed,more distally located ankyrin G (AnkG)in AISs,and longer Nav1.2 lengths in AISs.Moreover,during AIS plasticity,AnkG and Nav1.2 showed distal shifts in location and shorter lengths of labeled AISs in rat neurons;in mouse neurons,however,they showed a longer AnkG-labeled length and more distal Nav1.2 location.Our findings suggest that hippocampal neurons in SD rats and C57 mice may have different AP propagation speeds,different AnkG and Nav1.2 patterns in the AIS,and different AIS plasticity properties,indicating that comparisons between these species must be carefully considered.
Keywords:Sprague-Dawley rats;C57BL/6 mice;Action potential;Axon initial segment;Plasticity
INTRODUCTION
Neurons generate all-or-none action potentials (APs) at the axon initial segment (AIS),which is a specialized axonal compartment proximal to the soma (Bender &Trussell,2012;Clark et al.,2009;Kole &Stuart,2012).The AIS is a highly structured region consisting of scaffolding proteins (e.g.,ankyrin G;AnkG),transmembrane cell adhesion molecules(e.g.,neurofascin 186;NF-186),and a dense population of voltage-gated ion channels (Grubb &Burrone,2010b;Rasband,2010).The location and length of the AIS vary by neuronal type (Fried et al.,2009;Kuba et al.,2006),but how these properties affect AP generation and information transmission is not well understood.
APs are initiated at the AIS and propagate in two directions.Forward-propagating APs (fpAPs) travel along the axon toward the synaptic terminal and trigger neurotransmitter release into adjacent target neurons.In contrast,backpropagating APs (bpAPs) travel in the opposite direction toward the soma and dendrites.The interplay between bpAPs and input electrical signals has been implicated in long-term potentiation (Bashir &Collingridge,1992;Kamal et al.,1999;Morris,1989;Voronin,1993).During this process,AP propagation speed critically affects the timing of electrical signals,which is key to triggering transmitter release at the axon terminals,integrating information with other synaptic signals at the soma,and responding to physiological fluctuations (Alle &Geiger,2006;Debanne,2004;Kole et al.,2007;Rama et al.,2018;Schmidt-Hieber et al.,2008;Shu et al.,2006).The AIS itself is not a rigid structure.Its length and location can be altered through short-and long-term changes in molecular components,functions,and neuronal excitability to adapt to the surrounding environment,a process known as AIS plasticity (Evans et al.,2015;Grubb &Burrone,2010a;Grubb et al.,2011;Kuba et al.,2010,2015;Leterrier,2018;Yamada &Kuba,2016).Both experimental manipulations and computational modeling have shown that AIS plasticity can significantly affect the efficiency of neuronal signaling (Kole &Stuart,2012;Kuba et al.,2006;Muir &Kittler,2014;Wang et al.,2011).
In mammals,including humans,the hippocampus is an ensemble of neurons called engrams (also known as memory traces) (DRaDR,1922;Josselyn et al.,2015,2017;Tonegawa et al.,2015) that are formed during learning and reactivated to drive memory recall.The robust functional plasticity of hippocampal neurons is presumed to be the most important factor contributing to the achievement of such memories(Morris et al.,1990).Many studies have been conducted on the anatomy,physiology,and function of CA1 pyramidal neurons in rats (Golding et al.,2005;Harris &Stevens,1989;Jarrard,1993;Megas et al.,2001;Poirazi et al.,2003;Wyass&Van Groen,1992).However,with the recent development of genetic techniques,mice have become common models for studying the potential mechanisms underpinning learning and memory (Chen et al.,2006;Hickman-Davis &Davis,2006;Nolan et al.,2004;Picciotto &Wickman,1998;Rocha-Martins et al.,2015).Although mice are evolutionarily close to rats,significant differences exist between the species,which complicates direct comparisons.Notably,neurons from Sprague-Dawley (SD) rats and C57BL/6 (C57) mice may differ in total dendritic length,surface area,and volume,spatial distribution and branching of dendritic arbor,dendritic spine size and density,resting membrane potential (Vm),input resistance (RN),membrane time constant (τ),and active membrane properties (Routh et al.,2009).However,it remains to be determined whether neurons from these species exhibit similar AP propagation speeds and AIS plasticity mechanisms.
Here,we combined voltage imaging with genetically encoded voltage indicators (GEVIs) and multicompartment electrophysiological modeling to map the dynamics of AP initiation and propagation in cultured hippocampal neurons derived from SD rats and C57 mice.Over the past decade,the development of GEVIs has enabled quantitative description of AP waveforms in small neuronal structures,such as the AIS(Antic,2003;Foust et al.,2010;Hochbaum et al.,2014;Popovic et al.,2011).In the present study,we showed that APs were initiated near the distal end of the AIS and traveled bidirectionally at the AIS,with fpAPs and bpAPs exhibiting different speeds.Notably,bpAPs propagated more slowly in AISs originating from dendrites (“axon-carrying dendrites”)(Thome et al.,2014) than in AISs originating from the soma.Moreover,we observed differences in AP speed and AISs between rat and mouse neurons.Specifically,neurons from mice had a higher bpAP speed and a lower fpAP speed than neurons from rats.Compared with rat neurons,AnkG was located more distally and Nav1.2 staining was longer in the AISs of mouse neurons.Furthermore,during AIS plasticity,the rat neurons showed a distal location and shorter length of staining for both AnkG and Nav1.2;however,the mouse neurons showed a longer AnkG-labeled length and more distally located Nav1.2.Taken together,our data revealed the diversity of AP speed and AnkG/Nav1.2 patterns in the AISs of neurons in rats and mice and showed considerable differences in AIS plasticity between the two species,indicating that comparisons between SD rat and C57 mouse neurons must be carefully considered.
MATERIALS AND METHODS
Reagents,plasmids,and antibodies
Poly-D-lysine (PDL),Tween-20,Triton-100,Hanks’ balanced salt solution (HBSS),bovine serum albumin (BSA),fetal bovine serum,and fetal calf serum were obtained from Sigma(USA).Dulbecco’s Modified Eagle Medium (DMEM),neurobasal medium,GlutaMAX,B27 supplement,penicillin/streptomycin,and trypsin were obtained from Gibco (USA).Tyrode’s salt solution was purchased from MACGENE(China).The FCK-QuasAr2-mOrange2 plasmid was a generous gift from Dr.Adam E.Cohen (Harvard University,USA).The anti-neurofascin antibody (extNF;A12/18,75-172)and anti-Nav1.2 antibody (K69/3) were obtained from NeuroMab (USA).The anti-ankyrin G antibody (33-8800) was purchased from Invitrogen (USA).The anti-MAP2 antibody(ab5392) was obtained from Abcam (UK).Alexa Fluor®405 goat anti-mouse,Alexa Fluor®488 donkey anti-mouse,and Alexa Fluor®568 donkey anti-chicken were purchased from Invitrogen (USA).
Animals
We obtained 24 postnatal day 0 SD rat pups and 18 postnatal day 0 C57BL/6J mouse pups from Beijing Vital River Laboratory Animal Technology Co.,Ltd.(China).All animal handling,care,and experiments followed the rules and regulations of the Peking University Animal Care and Use Committee,as described previously (Cui et al.,2011;Sun et al.,2014).
Dissociation of hippocampal cultures
According to standard protocols,we prepared dissociated mixed neuronal and glial cultures from the hippocampus of postnatal day 0 rat/mouse pups.Briefly,hippocampi were dissected in DMEM,digested in 0.25% trypsin (15 min,37 °C),triturated through Pasteur pipettes of increasingly narrow diameter,and plated at 60 000 cells/mL onto PDL (50 μg/mL)-coated glass-bottom dishes (Cellvis,China).Cultures were incubated (37 °C,5% CO2) in neurobasal medium containing B27 supplement,2 mmol/L GlutaMAX,and penicillin/streptomycin.The medium was half-replaced after 48 h.
Transfection
Calcium phosphate transfection was used to introduce the QuasAr2-mOrange2 plasmid directly into the cell at day 8in vitro(DIV7).Generally,for every dish,2 μg of QuasAr2 plasmid in a 12.4 μL CaCl2/water solution was mixed with 2×HEPES (Gibco,USA) balanced solution (pH 7.12),followed by gentle vortexing.A plasmid/calcium phosphate complex was formed after 10 min of incubation at room temperature and then dropwise added to DIV6 neurons prewashed with neurobasal medium on glass-bottom dishes.Cultures were incubated in a humidified 5% CO2chamber at 37 °C for 30 min,with precipitation observed around the cells.The precipitate was dissolved by adjusting the medium pH to 6.8,followed by incubation at 37 °C for 5 min.Finally,cells were fed with the original growth medium and maintained until DIV12 for live imaging,immunofluorescence,or other treatments,as described below.
AIS live-cell labeling
The mouse anti-pan-neurofascin antibody (extNF;A12/18,NeuroMab,USA) was generated against the rat-specific extracellular domain common to NF155 and NF-186 (amino acids 25–1 110).Cultured neurons at DIV12 were washed three times in HBSS and incubated with primary antibody solution (1:200) at 37 °C for 30 min.Next,cells were washed three times in HBSS and incubated with secondary antibody(anti-mouse 405,1:500) at 37 °C for another 30 min.Finally,cells were washed and added with Tyrode’s buffer for imaging.
Immunocytochemistry
The following primary antibodies were used:mouse anti-AnkG(1:500;33-8800,Invitrogen,USA),chicken anti-MAP2(1:10 000;ab5392,Abcam,UK),and mouse anti-Nav1.2(1:200;K69/3,NeuroMab,USA).For AnkG and MAP2 labelling,cultures were fixed with 4% paraformaldehyde (20 min at room temperature) and incubated with primary antibody for 1 h at room temperature.For staining with the anti-Nav1.2 antibody,we used 2% paraformaldehyde for fixation (20 min at room temperature).Otherwise,all labelling steps were identical.After washing with Tyrode’s buffer,permeabilizing in 0.2% Triton X-100 (5 min at room temperature),and blocking with 5% BSA (30 min at room temperature),the cells were incubated with primary antibody solution (in 5% BSA) for 1 h.The sample was then washed three times and stained with dye-conjugated secondary antibodies for 1 h at room temperature.Finally,the cultures were washed three times and transferred into Tyrode’s buffer for imaging.
Imaging apparatus
Fluorescence imaging was performed on an inverted fluorescence microscope (Nikon-TiE,Japan) equipped with a 40×1.3 NA oil immersion objective lens,six laser lines(Coherent,USA) OBIS 405,488,532,561,and 637 nm for confocal imaging,and high-intensity 637 nm for voltage imaging),spinning disk confocal unit (Yokogawa CSU-X1,Japan),and two scientific CMOS cameras (Hamamatsu ORCA-Flash 4.0 v2,Japan).The microscope,lasers,and camera were controlled with customized software written in LabVIEW (National Instruments,v15.0,USA) and could switch between confocal and widefield imaging modes.Imaging of staining and fluorescent proteins was performed at illumination intensities of 1–6 W/cm2,while imaging of QuasAr2 was performed at 900 W/cm2.Supplementary Table S1 summarizes the laser lines,dichroic mirrors,and emission filters used for fluorescence imaging.
Confocal imaging of neurons
After labeling,cultures were transferred to Tyrode’s buffer.Images were acquired using 1×1 camera binning with an exposure time of 100–1 000 ms in Z-stack mode with a 0.3–0.5 μm step length.Each image stack was performed with Z-axis max intensity projection,and the new projected images in several channels were adjusted and merged with ImageJ/Fiji (NIH,USA)
Simultaneous patch-clamp recordings and fluorescence imaging
Hippocampal neurons from rats/mice were cultured,transfected,and labeled as described above.All imaging and electrophysiological analyses were performed in customized high-glucose Tyrode’s buffer containing 125 mmol/L NaCl,2.5 mmol/L KCl,3 mmol/L CaCl2,1 mmol/L MgCl2,10 mmol/L HEPES,and 30 mmol/L glucose (pH 7.3),adjusted to 305–310 mOsm/kg with sucrose.The synaptic blockers DAPV (25 μmol/L),NBQX (10 μmol/L),and gabazine(20 μmol/L) (all from Abcam,UK) were added to the imaging medium for single-cell measurement.
Electrophysiological experiments were performed at room temperature.Borosilicate glass electrodes (Sutter,USA) were pulled to a tip resistance of 2.5–5.0 MΩ.The glass electrode was filled with internal solution containing 125 mmol/L potassium gluconate,8 mmol/L NaCl,0.6 mmol/L MgCl2,0.1 mmol/L CaCl2,1 mmol/L EGTA,10 mmol/L HEPES (from Sigma,USA),4 mmol/L Mg-ATP,and 0.4 mmol/L Na2-GTP(from Shanghai Yuanye Bio-Technology Co.,Ltd.,China) (pH 7.3),adjusted to 295 mOsm/kg with 1 mol/L sucrose (Sigma,USA).A Sutter MP285 micromanipulator (USA) was used to adjust the position of the glass electrode.The cells were clamped using an Axopatch 200B amplifier (Axon Instruments,USA).The membrane voltage signal recorded from the patch amplifier was filtered with an internal 5 kHz Bessel filter and digitized at 21 159.48 Hz (for Figure 1) or 9 681.48 Hz (for other figures) with a National Instruments PCIe-6353 data acquisition (DAQ) board (USA,approximately twice the bandwidth of the Bessel filter).Recordings with >10% change in membrane resistance during measurement were considered as failed patch clamp attempts and were discarded from further analysis.
To collect spike-triggered average movies from neurons expressing QuasAr2-mOrange2,we clamped cultured neurons in the whole-cell current-clamp mode (Axopatch 200B,Axon Instruments,USA).We stimulated neurons 80 or 125 times with a 10 ms 100 pA–500 pA current injection(stimulation frequency of 6 Hz or 4 Hz,respectively) and simultaneously recorded QuasAr2 fluorescence movies of the clamped neuron.The movies were acquired at a 484 Hz(2.0658 ms exposure time for each frame) or 1 058 Hz frame rate (0.9452 ms exposure time for each frame) in rollingshutter mode with 2-by-2 binning,and the movies were averaged over all simulated APs (by peak finding and alignment) to boost the signal-to-noise (SNR) ratio for subsequent data interpolation and analysis.Camera bias(intensity of 400 in 2×2 binning mode) was subtracted from these average intensities to give final values.QuasAr2 and mOrange2 were imaged with a 637 nm laser line at an intensity of 900 W/cm2and 532 nm laser line at 1.0 W/cm2,respectively.The SNR was defined as the ratio of maximum fluorescence change over the standard deviation of baseline fluorescence fluctuations.For all experiments,the fluorescence signal was corrected for the photobleaching effect.The photobleaching baseline was constructed from the whole field intensity by a sliding minimum filter,followed by a smooth processing algorithm.Each frame of the raw movie(after camera bias subtraction) was then divided by the photobleaching baseline.
Data analysis
To increase the SNR,neurons were stimulated 80–125 times.Data processing was performed to calculate the speed of axons during this periodic signal.Video data were processed using a self-developed method with MATLAB (Mathworks,vR2017a,USA).
The method flow chart is shown in Supplementary Figure S1A.Firstly,raw data were filtered using a Gaussian low-pass filter (size:3×3,sigma:1) to remove spatial noise.As shown in Supplementary Figure S1B,S1C,spatial filtering increased the contrast of the standard deviation image.Pixels with low standard deviations were defined as background pixels,while pixels with large standard deviations were defined as region of interest (ROI) pixels.Spatial filtering reduced the signals of background pixels and background noise.Next,as shown in Supplementary Figure S1D,the centerline of the axon was drawn (red line).We set a 5×5 region (white square) centered by each pixel on the centerline as the whole ROI (region circled by white line).We twice smoothed the intensity of the whole ROI to obtain the photobleaching baseline(Supplementary Figure S1E).The first smoothing was a minimum filtering (window size:4×80),i.e.,red line,and the second smoothing was mean filtering (window size:2×80),i.e.,yellow photobleaching baseline.The final normalized signal value was the intensity divided by the photobleaching baseline (Supplementary Figure S1E,lower).We then found the peaks (local maximum) of the periodic APs(Supplementary Figure S1F,upper) and averaged them to obtain mean AP (blue AP in Supplementary Figure S1F,lower).To increase time resolution,we interpolated the kernel with a cubic spline to obtain the green AP,which was used as a kernel to revise the APs on each segment.Based on cubic spline interpolation,time resolution of the data increased from 2 ms to 0.002 ms.
We calculated the arrival time of AP peaks on each segment.Each segment was defined by 21 pixels on the centerline.As shown in Supplementary Figure S1G,we averaged the pixel signals in the green region segment to the signal on the red point (green region center).The green region was a small window sliding on the centerline.We first interpolated the signal of the red point (blue signal),using cubic spline as the interpolation on the kernel.We then convolved the splined signal on the red point (red signal) with the kernel (green signal in Supplementary Figure S1F) to calculate the correlation coefficient (yellow line in Supplementary Figure S1G).We replaced the splined signal with the kernel according to the correlation coefficient and obtained the corrected signal (purple signal).We then used the corrected high-precision signal to find the AP peak arrival time of the red point.After the green window slides over all pixels on the centerline,we obtained the corrected APs and their peak arrival times at all locations of the axon.
Finally,we calculated the mean and instantaneous speeds.We linearly fit the points in Supplementary Figure S1H (lower right),with the slope of the line representing mean speed(Supplementary Figure S1I).AP propagation was always unidirectional.However,some raw data points were not monatomic due to imaging noise (Supplementary Figure S1J).Therefore,when calculating instantaneous speed,we fit the raw data using least-squares curve fitting with linear constraints,whereCis the identity matrix,xis the unknown monotonic time,dis the raw data point (peak arrival time),and xi+1−xi≤0.001is the constraint.

Figure 1 Well-resolved AP initiation and propagation at AISs via voltage imaging

Generally,the maximum speed at the AIS was 300 μm/ms and minimum distance between two data points was 0.325 μm(pixel size in raw imaging data).The constraint was set to 0.001,and we calculated the monotonic propagation line.The slope of the line at each location was the instantaneous speed.The speed change per unit distance was equivalent to acceleration.
The spatial and temporal resolutions of speed were 0.325 μm (along propagation direction at axon) and 0.002 ms,respectively.We defined propagation speed as peak propagation speed.Due to the limitations of the raw data and analysis methods,speed calculations at the AIS shorter than 20 μm were not precise enough.Therefore,only AISs longer than 20 μm were quantitatively observed.The data processing code is available at GitHub (https://github.com/Jessie 940611/Action-Potential-Propagation-Velocity-is-Influencedby-AIS-Plasticity).
Multi-compartmental modeling
We created a detailed multi-compartment model of a neuron to explore the relationship between neuronal morphology and AP propagation speed.The model included simplified morphology,ion channel distributions and densities,channel kinetics,and passive properties.We stimulated the model neuron with a pulse current injected directly into the soma.Simulation was performed using the Python (v3.6.6) interface in Neuron (v7.6.5).The integration time steps were fixed at 0.001 ms.The length of the segments was 1 μm.The simulation code is available at GitHub (https://github.com/Jessie 940611/Action-Potential-Propagation-Velocity-is-Influencedby-AIS-Plasticity).
Neuronal morphologies included several simple cylinders to mimic dendrite,soma,hillock,AIS,and axon.Passive parameter values were optimized within physiologically relevant ranges from the literature (Mainen &Sejnowski,1998;Saraga et al.,2003).The values of passive parameters were selected to match the experimentally measured input resistance and membrane time constant in the hippocampal neurons.For active properties,the gating kinetics of voltagedependent Nav and Kv channels were Hodgkin-Huxley style(Hu et al.,2009).The densities of ion channels were set according to previously published values (Hu et al.,2009;Saraga et al.,2003).The model parameters are listed in Supplementary Tables S2,S3.
RESULTS
Spatiotemporally resolved voltage imaging of AP propagation at AIS
We selected QuasAr2 as the GEVI due to its superior sensitivity (90% ΔF/F0per 100 mV) and fast response kinetics(Hochbaum et al.,2014).This indicator has been employed to monitor AP initiation in cultured rat hippocampal neurons(Hochbaum et al.,2014) and to investigate the neuronal excitability of patient-derived motor neurons (Kiskinis et al.,2018).Compared to previous AIS imaging studies (Antic,2003;Foust et al.,2010;Popovic et al.,2011),QuasAr2 provides a superior SNR due to its lower background signal and higher voltage sensitivity (Bando et al.,2019;Xu et al.,2017).As shown in Figure 1A,cultured rat hippocampal neurons were transfected with the QuasAr2-mOrange2 plasmid.The AIS was visualized with immunofluorescence staining for the neurofascin-186 (NF-186) marker protein.Neurons were then stimulated using the whole-cell current clamp technique,in which periodic current injections into the soma triggered AP firing.Concurrently,a QuasAr2 fluorescence image series was acquired at a 1 000 Hz frame rate (Figure 1B).The resulting voltage imaging movie robustly detected AP spikes at the AIS and neighboring regions.In the AIS,AP spikes were detected with a remarkable SNR ranging from 11 to 36 (Figure 1C,outlined AIS region;mean±standard deviation:17.2±4.3).The SNR was increased to 111 by averaging the AP spikes (Figure 1C,right column,AIS trace).We adapted a digital upsampling algorithm (Hochbaum et al.,2014;Popovic et al.,2011) to analyze AP timing with submillisecond-level temporal resolution and pixel-level spatial resolution (Figure 1D,E;Supplementary Figure S1).
Voltage imaging of AP propagation speed at AIS
In this study,AISlengthwas defined as the distance between the proximal and distal ends of each AIS,andAISlocationwas defined as the distance from the soma to the proximal end of the AIS (Grubb &Burrone,2010a) (Figure 2A).Following onset at the AIS,APs propagated bidirectionally,with fpAPs traveling along the axon and bpAPs traveling back toward the soma and dendrites (Figure 2A,B).The AIS region was identified with the fluorescently labeled NF-186 marker protein (Figure 2B,left panel).Fluorescence intensity of each image was smoothed and normalized.The AIS boundary at both the proximal and distal ends was defined as the location where NF-186 fluorescence intensity decreased to 10% of the maximum at the AIS (Grubb &Burrone,2010a).
First,we determined the AP initiation site at the AIS(Figure 2B).The initiation sites of individual APs were identified from the voltage imaging data.We normalized the AIS lengths and found that AP initiation sites occurred with the highest frequency at 50%–70% along the AIS,slightly biased to the distal end (Figure 2C).This bias in location is consistent with the spatial distribution of the voltage-gated sodium channel Nav1.6 in the AIS (Hu et al.,2009)
After initiation,both bpAPs and fpAPs were generated and traveled at different speeds.The speed of the fpAPs was 1.87±0.39 times higher at the AIS than at the more distal axon(119.5±18.7 μm/ms versus 73.45±7.76 μm/ms,respectively,*:P<0.05) (Figure 2D,left panel,and Figure 2E).On average,the fpAPs traveled 1.51±0.18 times faster than the bpAPs(112.6±14.2 μm/ms versus 84.99±7.59 μm/ms,ns:P>0.05)(Figure 2D,right panel,Figure 2F).Thus,voltage imaging enabled us to distinguish AP propagation speed in different subcellular regions.Furthermore,neither AIS location(Figure 2G) nor AIS length (Figure 2H) affected bpAP speed(n=30).In contrast,fpAP speed (n=19) was significantly lower at distal and shorter AISs (Figure 2I,J).
Influence of AIS length and location on fpAP propagation speed
Results revealed that fpAP speed was significantly correlated with AIS location and length (Figure 2I,J).We pharmacologically perturbed the AIS in neurons to verify the relationship between fpAP speed and AIS location.Previous research has shown that treating mature AISs (after DIV7)with KCl (15 mmol/L for 48 h) can significantly shift the AIS distally without affecting AIS length (Grubb &Burrone,2010a).We applied this method to induce a shift in the AIS location.After treatment with 15 mmol/L KCl from DIV10 to DIV12,neuronal resting potential was unchanged (Figure 3A),while rheobase increased significantly when neurons were allowed to recover in 2.5 mmol/L K+extracellular medium (Figure 3B).

Figure 2 AP speed varied during propagation
As predicted,AIS location in these neurons shifted markedly from the soma (Figure 3C,D),but AIS length remained unchanged (Figure 3C,E).Consistent with the above observations (Figure 2G–J),bpAP speed showed little change in these neurons compared to the untreated neurons(99.46±14.94 μm/ms and 83.74±13.89 μm/ms,respectively,ns:P>0.05) (Figure 3F),while fpAP speed was much lower in these neurons compared to the untreated neurons(147.4±26.33 μm/ms and 65.33±9.30 μm/ms,respectively,*:P<0.05) (Figure 3G).In the KCl-treated group (n=15),AIS location and length did not significantly alter bpAP speed(Figure 3H,I).In contrast,fpAP speed (n=10) was negatively correlated with AIS location and positively correlated with AIS length (Figure 3J,K) in the KCl-treated neurons(Figure 3G–J).Thus,shifting the AIS distally did not significantly alter bpAP speed but significantly affected fpAP speed.Based on these results,AIS location and length influenced fpAP speed.
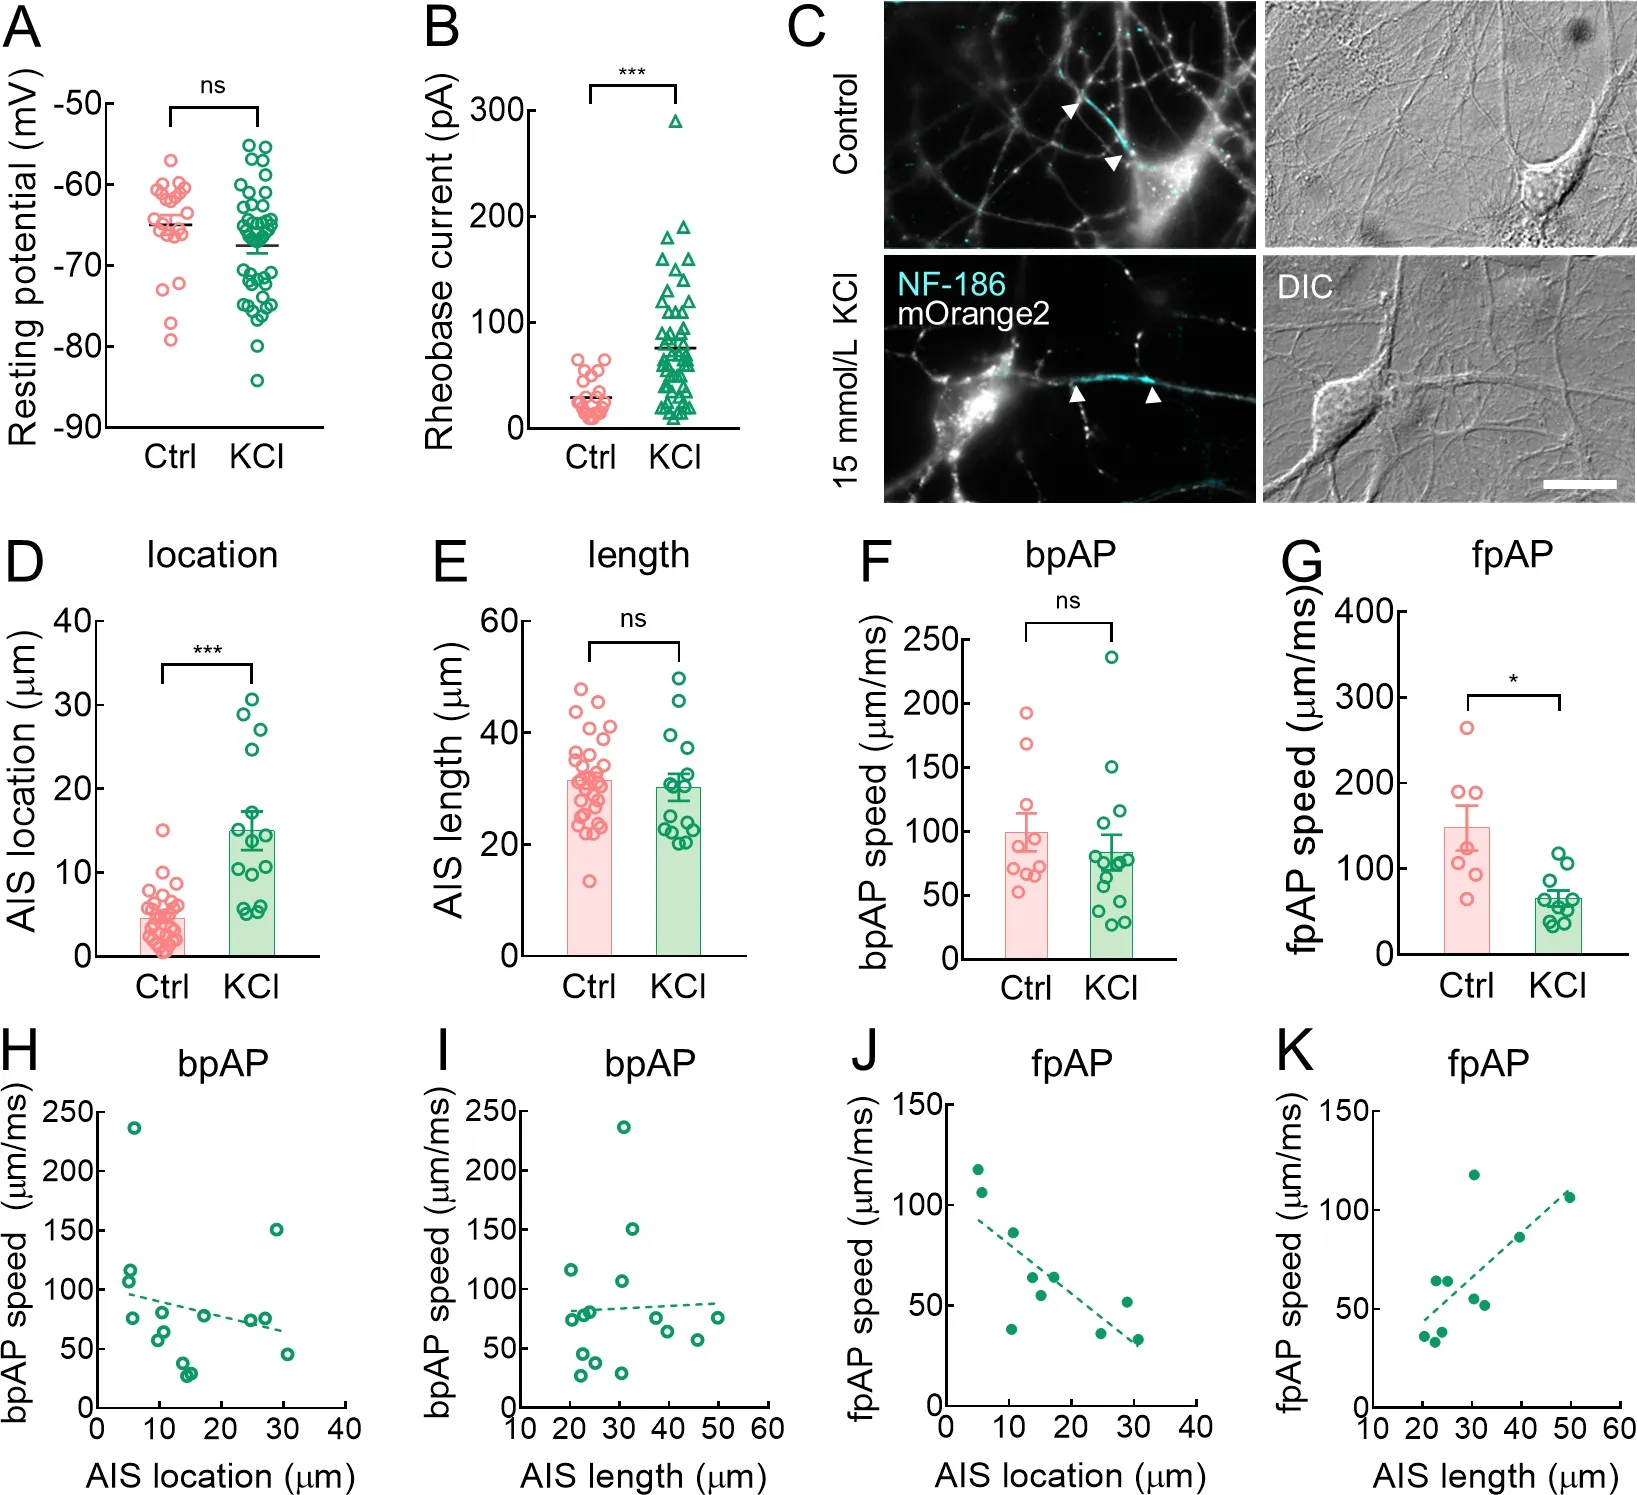
Figure 3 fpAP speed was negatively correlated with AIS location and positively correlated with AIS length
bpAP speed was higher at dendrites than at AISs
In the cultured neurons,approximately 20% of neuronal AISs had a dendritic origin,consistent with previous observations of pyramidal cells in rats (Lorincz &Nusser,2010;Thome et al.,2014;Triarhou,2014).According to recent study,axons emanate from the basal dendritic arbor in more than half of all CA1 pyramidal neurons and 30% of those in rat pups (Thome et al.,2014).In the current study,“dendritic AISs” refer to AISs with a dendritic origin,whereas “somatic AISs” refer to AISs with a somatic origin (Figure 4A).In neurons with dendritic AISs,bpAP speed at the dendrite was 2.55±0.61 times higher than that at the AIS (116.5±26.0 μm/ms and 45.56±3.85 μm/ms,respectively,**:P<0.01) (Figure 4B,C).
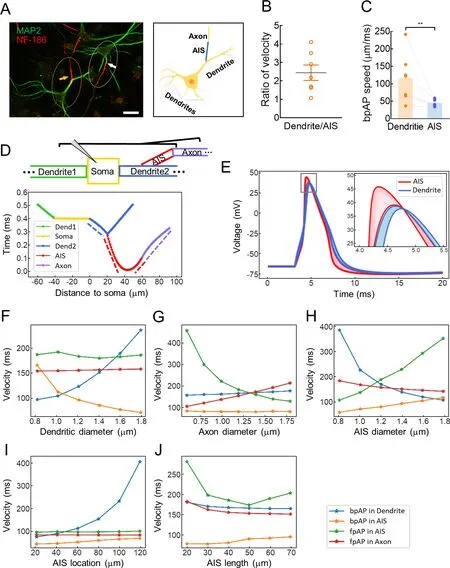
Figure 4 In dendritic AIS neurons,bpAP speed was lower at AISs than at corresponding dendrites
As shown in Figure 4D,we constructed a multicompartment model to simulate a dendritic AIS neuron.The modeled neuron had two dendrites,one of which had a dendritic AIS with the proximal end located 20 μm from the soma.All compartments contained voltage-gated Na+and K+channels.The channel densities and compartment dimensions are shown in Supplementary Table S2.The arrival times of AP peaks in each segment are shown in Figure 4E,with different sections labeled in different colors.The mean propagation speed in each compartment was calculated by dividing the length of the compartment by the AP propagation time in that compartment (dotted line slope in Figure 4D.In this model,the bpAP speed was 168 μm/ms at the dendrites and 77.7 μm/ms at the AIS;the fpAP speed was 186 μm/ms at the AIS and 155 μm/ms at the axon.Thus,fpAP speed was lower at the axons than at the AIS;fpAP speed was higher than bpAP speed at the AIS;and bpAP speed was higher at the dendrites than at the AIS.These modeling trends were highly consistent with our experimental findings.
We also explored the effects of compartment morphology on speed by changing the dendritic diameter (Figure 4F),axon diameter (Figure 4G),AIS diameter (Figure 4H),AIS location(Figure 4I),and AIS length (Figure 4J) in the model.Dendritic diameter mainly influenced bpAP speed at the dendrites and AIS,axon diameter influenced fpAP speed at the AIS and axon,AIS diameter influenced fpAP and bpAP speeds in all segments,AIS location mainly influenced bpAP speed at the dendrites,and AIS length influenced fpAP speed at the AIS.Overall,speed was highly dependent on neuronal morphology.
bpAP speed was lower at dendritic AISs than somatic AISs
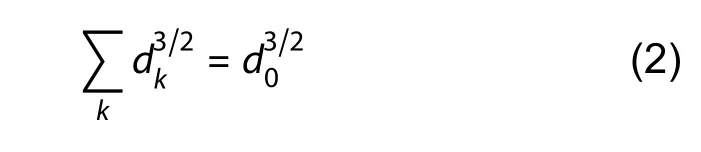
We next explored whether AIS origin affected AP speed.Overall,a much higher bpAP speed was observed at somatic AISs than at dendritic AISs (99.47±11.35 μm/ms and 55.65±7.85 μm/ms,respectively,*:P<0.05) (Figure 5A).However,dendritic and somatic AISs had comparable fpAP speeds (137.5±52.43 μm/ms and 91.13±19.42 μm/ms,respectively,ns:P>0.05) (Figure 5B).The lengths of the somatic and dendritic AISs were also similar (30.54±1.14 μm and 32.21±1.51 μm,respectively,ns:P>0.05) (Figure 5C,D).We constructed two simplified models to clarify why bpAP speeds were faster at somatic AISs than at dendritic AISs.According to the Rall model,two cylinders (dkrepresenting diameter of kthcylinder) were equivalent to one cylinder(diameter d0) if
In Figure 5E,the gray models represent the original models,and the pink and orange models represent the simplified equivalent models (Supplementary Figure S2B).As the axon hillock was thinner than the equivalent cylinder of two dendrites,the diameter of the middle compartment in the somatic AISs (2 μm) was correspondingly thinner than that of the dendritic AISs (3 μm).We focused on the effect of different AIS origins on AP propagation speed by setting uniform ion channel densities along the AIS.The stimulus (1 nA for 1 ms)was injected into the left end of the model.APs in both models were simultaneously initiated at the right end of the model.The solid and dotted lines represent APs at the somatic and dendritic AISs,respectively (Figure 5F).The AP peak reached the end of the somatic AISs earlier than the end of the dendritic AISs,indicating higher speed at the somatic AISs than at the dendritic AISs.Because APs at the dendritic AISs traveled through thicker cables than those at the somatic AISs,speed was expected to be lower at the dendritic AISs(Goldstein &Rall,1974);this explains why bpAP speed was lower at the dendritic AISs than at the somatic AISs(Figure 5A).
After pharmacologically perturbing the AIS location in neurons by treating mature AISs (after DIV7) with 15 mmol/L KCl for 48 h,both somatic and dendritic AISs shifted distally without changes in length (Figure 3C–E;Supplementary Figure S2A).In addition,bpAP speed at the somatic and dendritic AISs did not differ significantly between the untreated and KCl-treated groups (Figure 3F,5A).As shown above,bpAP speed of the dendritic AISs was notably lower than that of the somatic AISs (Figure 5A).Therefore,bpAP speed was more sensitive to axon origin (i.e.,whether AIS was somatic or dendritic) than AIS location.However,fpAP speed at the somatic AISs was significantly higher in the control group than in the KCl-treated group (Figure 3G),with fpAP speed at the dendritic AISs exhibiting the same trend (Figure 5B).Moreover,fpAP speed did not differ between the somatic and dendritic AISs (Figure 5B).Thus,fpAP speed was more sensitive to AIS location than to axon origin.In terms of fpAPs,previous studies have shown that ion channel distribution(especially that of Nav1.2,Nav1.6,and Kv7.3) at the AIS and proximal areas of the axon may modulate fpAP conduction speed along the axon (Atherton et al.,2008).Our study revealed significant differences in Nav1.2 length/location between the somatic and dendritic AIS neurons (27.98±1.44 μm and 22.65±1.57 μm,respectively,*:P<0.05)(Figure 5G,H).
Hippocampal neurons from C57 mice had higher bpAP speed and lower fpAP speed than neurons from SD rats
We further examined whether hippocampal neurons from C57 mice had similar AP propagation characteristics to hippocampal neurons from SD rats.After voltage imaging,we used a standard immunofluorescence technique to visualize the recorded neurons and their AISs (Figure 6A).The neurons were filled with biocytin (0.5% w/v),and AnkG or NF-186 localization indicated AISs.The AP speeds in both directions were similar in mouse and rat neurons.Specifically,at the dendritic AISs,bpAP speed at the dendrites was generally higher than that at the AIS (115.4±16.97 μm/ms and 74.98±15.87 μm/ms,respectively,*:P<0.05) (Figure 6B).In addition,bpAP speed at the somatic AISs was also much higher than that at the dendritic AISs (135.0±14.61 μm/ms and 64.24±8.10 μm/ms,respectively,**:P<0.01) (Figure 6C),while fpAP speed at the somatic AISs was similar to that at the dendritic AISs (77.16±10.27 μm/ms and 75.18±24.62 μm/ms,respectively,ns:P>0.05) (Figure 6D).

Figure 5 bpAP speed was lower at dendritic AISs than somatic AISs
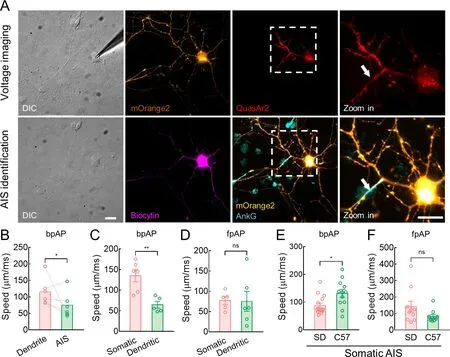
Figure 6 Mice neurons exhibited higher bpAP speed and lower fpAP speed than rat neurons
In the somatic AIS neurons,bpAP speed was much higher in mice than in rats (88.22±8.62 μm/ms and 131.3±14.08 μm/ms,respectively,*:P<0.05),whereas fpAP speed was slightly lower (141.3±33.57 μm/ms and 82.92±11.73 μm/ms,respectively,ns:P>0.05) (Figure 6E,F).Based on AnkG localization,the AIS was significantly more distal in mouse neurons than in rat neurons,although AIS length was similar in both (Figure 7A,B).Consistent with previous study,the distally located AISs corresponded to lower fpAP speeds and similar bpAP speeds at the AIS (Figure 3D–G).Nav1.2 was located distally and was more widely distributed in the AIS of mouse neurons compared to rat neurons (Figure 7C,D).This distal shift in AIS and longer Nav1.2 may contribute to the lower fpAP speed and higher bpAP speed in C57 mouse neurons (Figure 7E).
Furthermore,we compared speed at the dendritic AISs in rat and mouse hippocampal neurons.Both bpAP speed(62.32±10.16 μm/ms and 68.63±16.14 μm/ms,ns:P>0.05)and fpAP speed (90.30±12.23 μm/ms and 87.27±18.37 μm/ms,ns:P>0.05) at the dendritic AISs were similar in rats and mice (Figure 7F,G).Unlike somatic AISs,AnkG length and location were similar in the dendritic AIS neurons of rats and mice (Figure 7H).However,we discovered a similar length but differences in distal location of Nav1.2 at the dendritic AISs between the species (Figure 7I).Therefore,we speculate that the similar AnkG-and Nav1.2-labeled lengths may be related to the comparable bpAP and fpAP speeds at dendritic AISs in both species (Figure 7J).
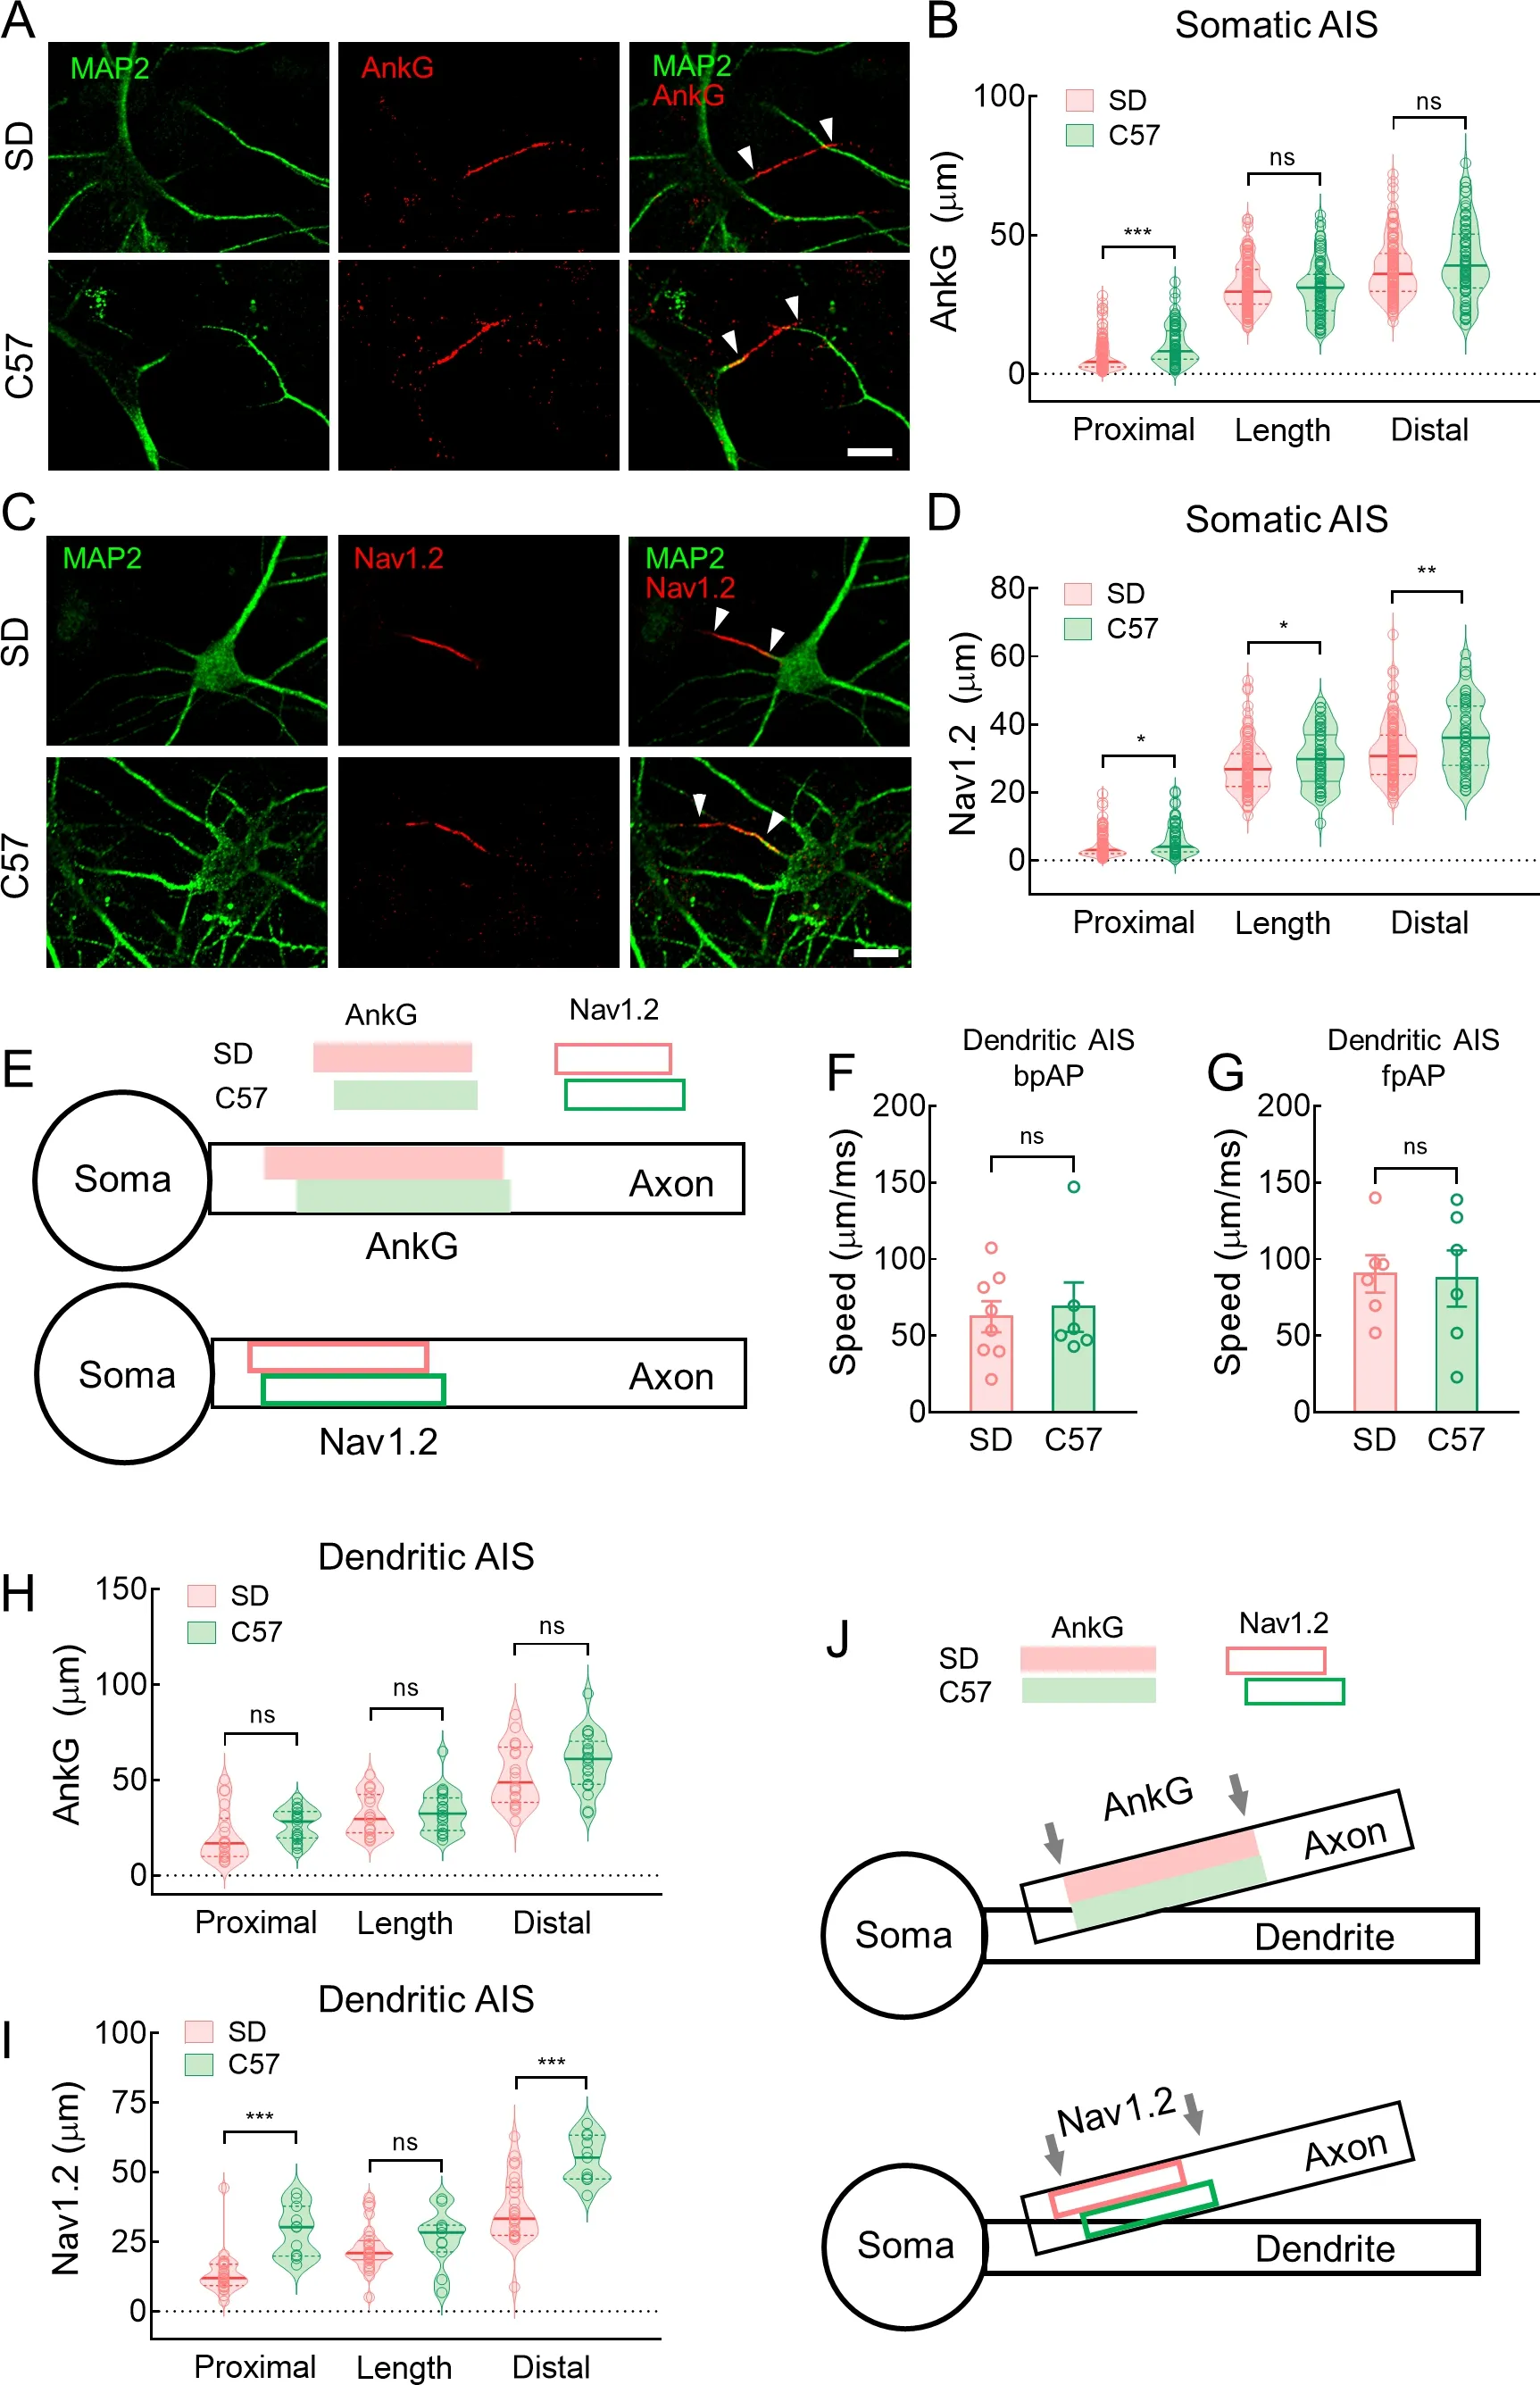
Figure 7 Neurons from rats and mice exhibited very different AnkG and Nav1.2 patterns
AnkG and Nav1.2 responded differently in rat and mouse neurons after AIS plasticity induction
We evaluated changes in AnkG and Nav1.2 staining length and location during AIS plasticity in neurons from SD rats and C57 mice.After 48 h of KCl treatment during long-term AIS plasticity,most AIS proteins (e.g.,AnkG,NF-186,βⅣ spectrin,and Nav channels) move away from the soma (Grubb &Burrone,2010a).In the present study,we focused on differences in neurons from rats and mice during AIS plasticity,especially short-term plasticity.A recent study reported that high glucose levels can alter the AIS position in mice with type 2 diabetes (Yermakov et al.,2018).We observed significant changes in AIS location/length after treating neurons with a high concentration of glucose for 3 h.Therefore,rather than 48 h of KCl treatment,we induced short-term AIS plasticity by exposing rat and mouse hippocampal neurons to high concentrations of glucose (20 mmol/L) for 3 h,then examined changes in AnkG and Nav1.2 staining length and location (Figure 8A,B) at the AIS.Overall,rat neurons treated with 20 mmol/L glucose for 3 h showed a significant distal shift in the AnkG-labeled proximal end(6.47±0.41 μm and 9.85±0.59 μm,respectively,***:P<0.001)and significantly shortened AnkG-labeled length (31.98±0.74 μm and 28.21±0.89 μm,respectively,**:P<0.01).The AnkGlabeled distal end was similar in the glucose-treated and untreated groups (38.45±0.84 μm and 38.05±1.14 μm,respectively,ns:P>0.05) (Figure 8C,E).In addition,changes in Nav1.2-labeled length/location exhibited a comparable pattern to that of AnkG (Figure 8D,E).
However,in mouse neurons,the AnkG pattern shifted in the opposite direction after 3 h of 20 mmol/L glucose treatment.Specifically,compared with the untreated neurons,the glucose-treated neurons exhibited no distal shift in the AnkGlabeled proximal end (10.14±0.34 μm and 9.93±0.69 μm,respectively,ns:P>0.05) but showed a significantly shortened AnkG-labeled length (30.21±1.09 μm and 35.84±1.30 μm,respectively,**:P<0.01) due to a significant proximal shift in the AnkG-labeled distal end (40.34±1.24 μm and 45.77±1.46 μm,respectively,**:P<0.01) (Figure 8F,H).We also observed different changes in the length/location of Nav1.2 staining in the glucose-treated mouse neurons compared to the rat neurons.After 3 h of treatment with 20 mmol/L glucose,the proximal end of Nav1.2 staining exhibited a significant distal shift (6.18±0.48 μm and 9.66±0.83 μm,respectively,***:P<0.001),but the distal end of Nav1.2 staining exhibited little change (length:28.61±1.14 μm and 26.91±1.30 μm,respectively,ns:P>0.05;distal end:34.79±1.24 μm and 36.57±1.52 μm,respectively,ns:P>0.05) (Figure 8G,H).
Consistent with AP propagation speed,neither bpAP nor fpAP speed changed at the dendritic AISs after 48 h of KCl treatment (Figure 5G,H).After inducing AIS plasticity by exposure to 20 mmol/L glucose for 3 h,only a distal shift in Nav1.2 localization was observed (Supplementary Figure S3B);neither the length of Nav1.2 staining nor the location and length of AnkG staining changed in the rat neurons(Supplementary Figure S3A–C).In the mouse neurons,no detectable changes in AnkG or Nav1.2 patterns were observed (Supplementary Figure S3D–F).
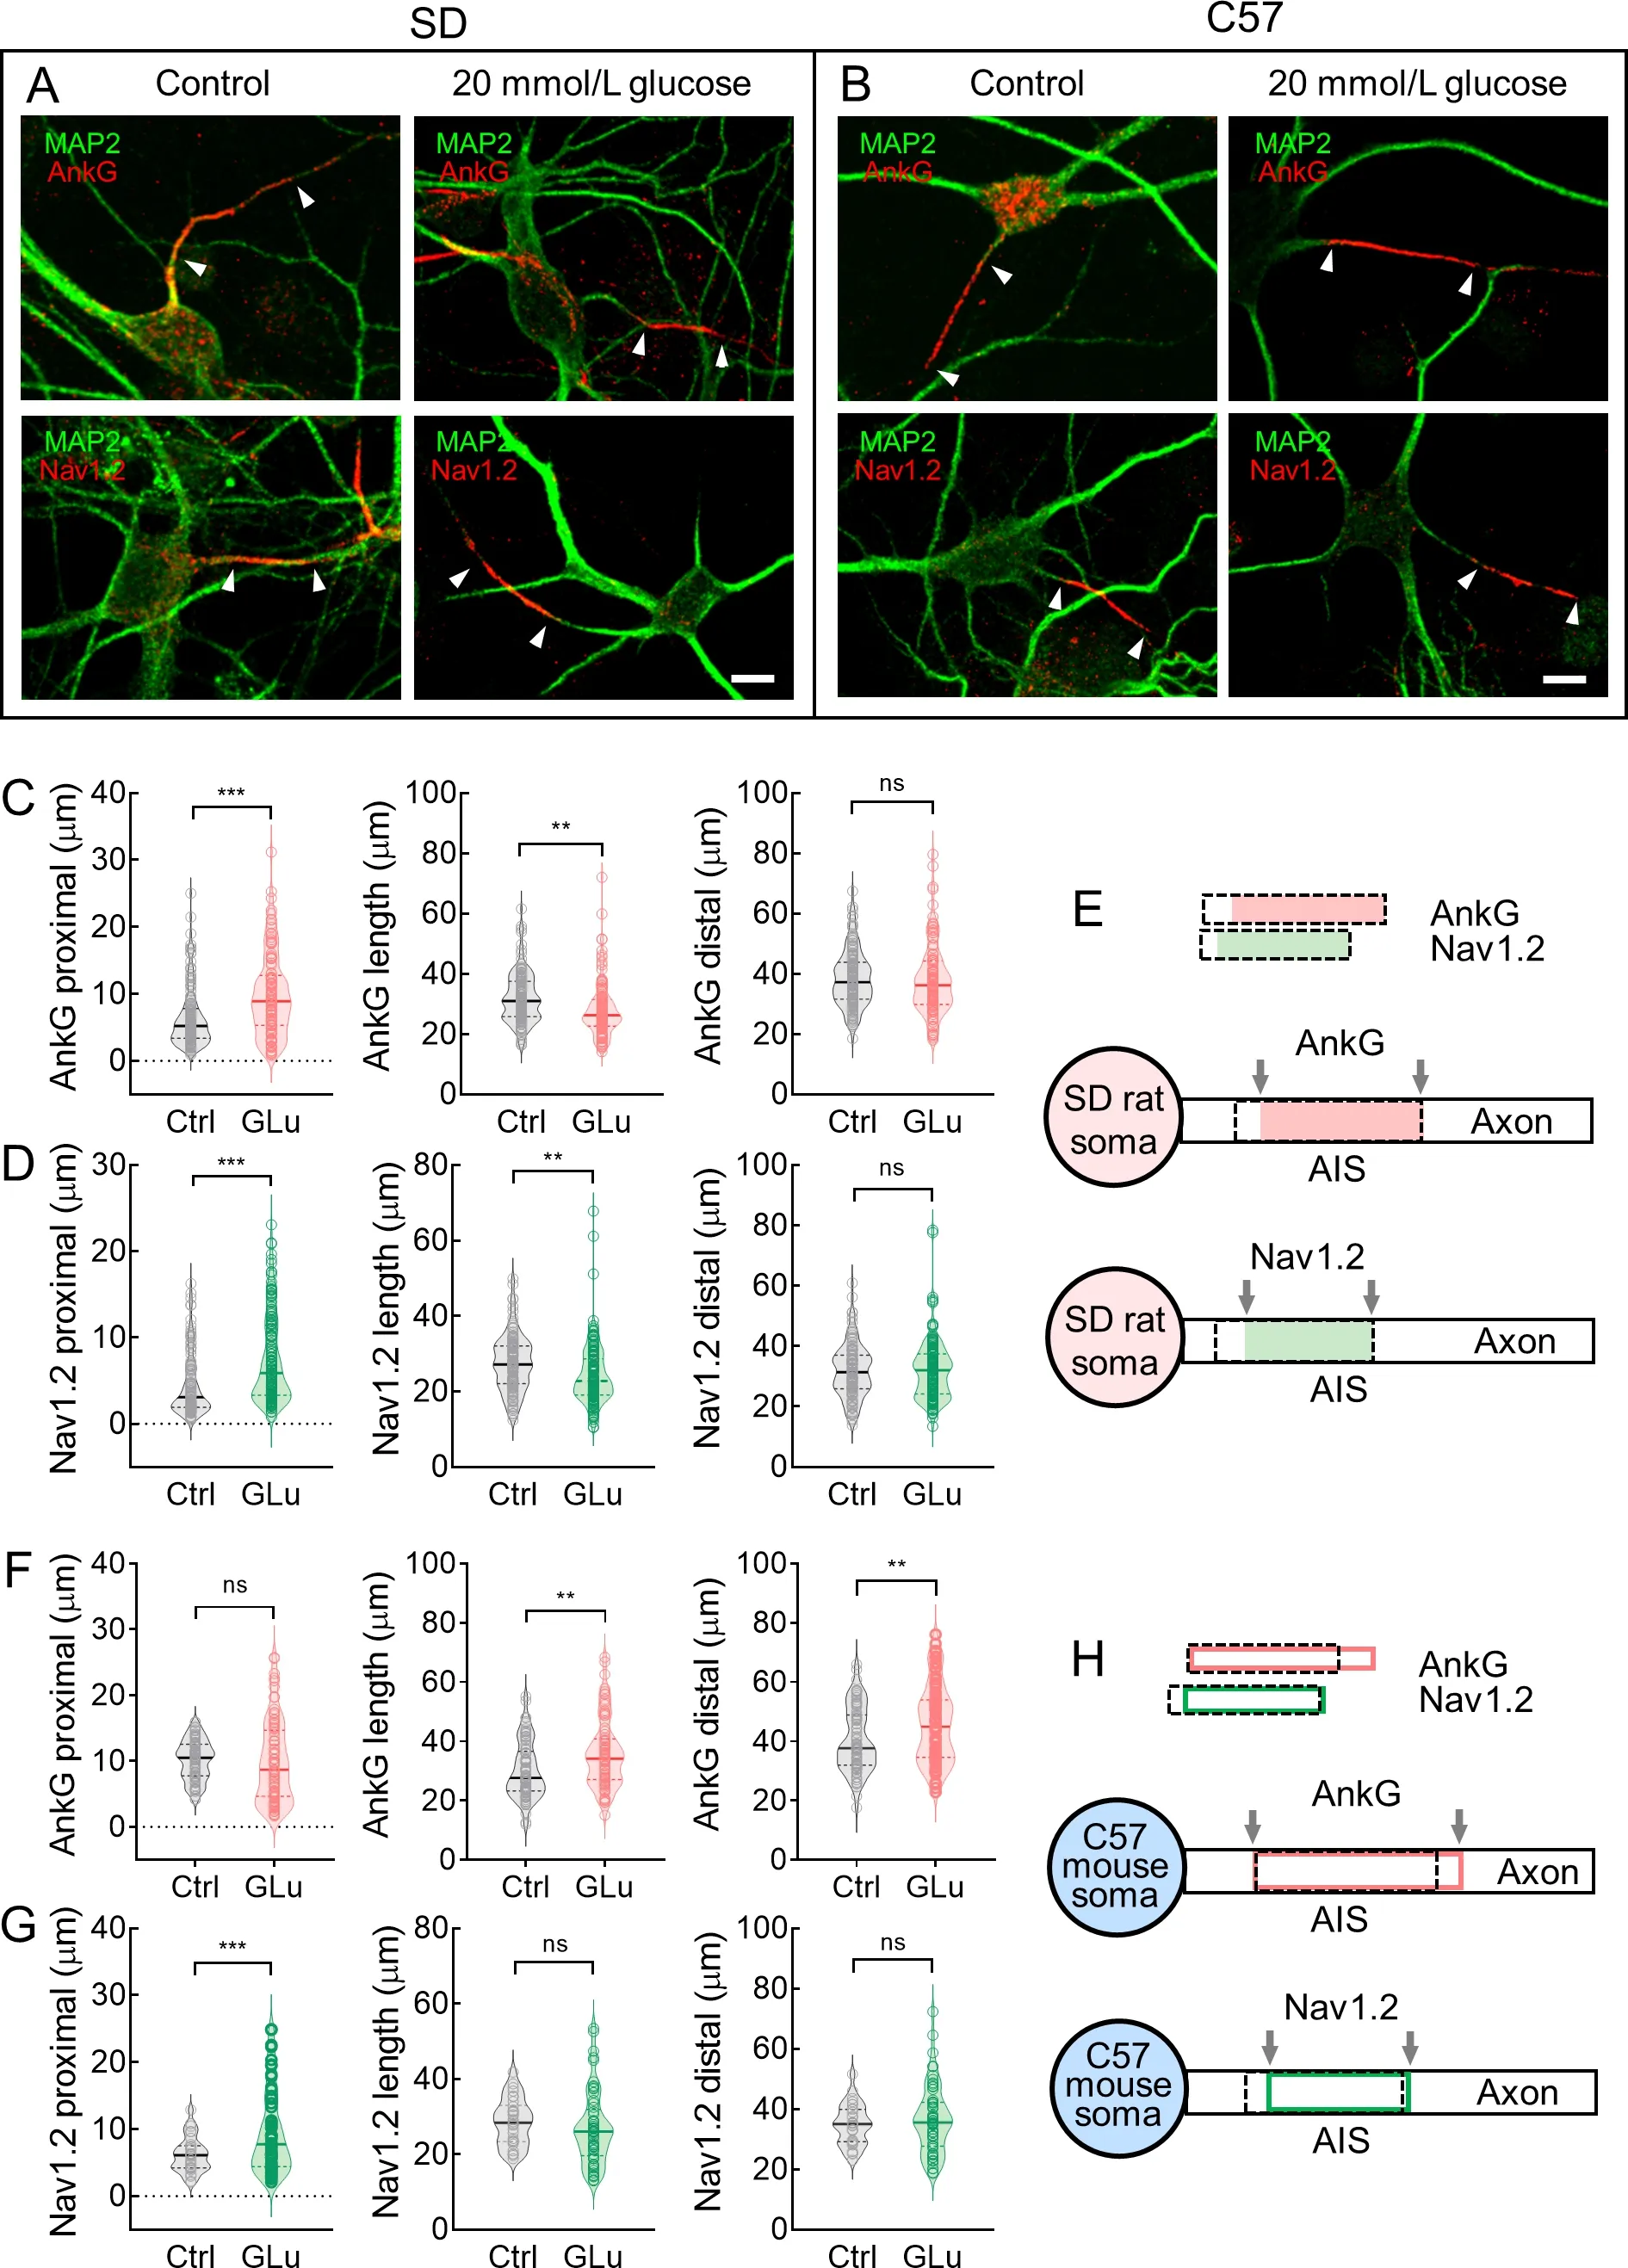
Figure 8 AnkG and Nav1.2 length/location were differentially altered during AIS plasticity in somatic AIS neurons
DISCUSSION
Electrode-based patch-clamp recordings are considered the“gold standard” for elucidating fluctuations in plasma membrane potential.However,the size of the pipette inhibits multi-site recordings at the tiny regions of the AIS and proximal axon.Furthermore,the axon is fragile (Ø=0.1–1.0 μm in axon and 1.0–2.5 μm in AIS),making it difficult to establish whole-cell recordings (Hu &Shu,2012;Shu et al.,2006).Advanced axon-bleb recordings can only provide membrane potential details of a single site in the axon,which is insufficient to resolve the AP initiation site and calculate AP propagation speed at the AIS (Hu &Shu,2012;Shu et al.,2006).High-density microelectrode arrays (HD-MEA) have been employed to resolve AP propagation at specific AISs with higher spatiotemporal resolution (Abbott et al.,2020;Bakkum et al.,2013;Emmenegger et al.,2019).While these electrode-based techniques have advanced our knowledge of AIS electrophysiology,they suffer from high cell invasiveness,poor spatial resolution,and high labor costs.
In contrast to the above-mentioned techniques,optical voltage imaging can simultaneously measure changes in membrane potential from different sites on one neurite to large neural populations with high spatial resolution due to higher sampling density compared to electrode-based techniques(Peng et al.,2017;Xu et al.,2017).In recent years,voltage imaging has emerged as a powerful technique to clarify AP propagation details along the axon,such as the AIS (Foust et al.,2010;Hochbaum et al.,2014;Popovic et al.,2011;Sabater et al.,2021).Due to technical limitations in measuring AP speed at the AIS and proximal axon adjacent to the soma,several questions have remained unanswered,such as whether AIS morphology influences AP propagation and whether fpAP and bpAP speeds are similar at the AIS.Taking advantage of voltage imaging technology,we examined AP generation and propagation in hippocampal neurons of SD rats and C57 mice.We found that AP propagation speed varied along the proximal axon,and generally,bpAP speed was lower than fpAP speed at the AISs (Figure 2F).
We simultaneously recorded electrical and optical signals in the soma.Somatic AP comparison of GEVI recordings with whole-cell patch-clamp recordings showed that APs were accurately and reliably captured (Figure 1C).Moreover,calculation of bpAP propagation at the dendrites produced similar results to previous patch-clamp recordings (Larkum et al.,2001;Nevian et al.,2007) and functional imaging (Antic,2003;Kampa &Stuart,2006) of apical/basal dendrites of rats and mice (Supplementary Figure S4).As mentioned above,in situinterrogation of AP propagation at the AIS via multielectrode intracellular patch-clamp recording has remained a technical challenge (Yang et al.,2019).Thus,we were unable to validate our method directly using electrodebased “gold-standard techniques” at the AIS.In comparison,fluctuations in bpAP amplitude and propagation speed have been well studied using traditional dendritic electrophysiology in rat Purkinje cells and layer 5 pyramidal neurons (Larkum et al.,2001;Nevian et al.,2007;Vetter et al.,2001).Although dendritic morphologies,molecular structures,and intercellular connections differ in cultured hippocampal neurons and neurons in brain slices,we compared dendritic AP propagation using our voltage imaging method to that using multielectrode patch-clamp recording (Emmenegger et al.,2019;Liu &Miller,2020;Xu et al.,2017).Similar results were obtained,implying that our optical method provided decent temporal accuracy after interpolation and may support more informative monitoring of voltage changes via multi-site imaging (Emmenegger et al.,2019;Liu &Miller,2020;Xu et al.,2017).
Our results also showed that,in the somatic AIS neurons,bpAP speed was not influenced by AIS location or length(Figure 2G,H).However,fpAP speed was lower at the distal AISs and shorter AISs (Figure 2I,J).Low-threshold Nav1.6 channels accumulate at the distal AIS and play an important role in AP initiation,whereas high-threshold Nav1.2 channels preferentially accumulate at the proximal AIS and play an important role in bpAP propagation (Hu et al.,2009).Our data showed that the AP initiation site was located far from the soma at longer AISs or distally located AISs (Supplementary Figure S5A,B).Compared with fpAPs,bpAPs pass through longer Nav1.2 channels during backpropagation.Therefore,during propagation to the axon terminal,fpAPs are transmitted by a limited number of Nav1.2 channels and high-density Nav1.6 channels,as well as other ion channels,which may make fpAPs more susceptible to changes in AIS length/location.We speculate that during AIS plasticity,the distribution (length/location/density) of ion channels in the AIS will change with AIS location/length.Thus,somatic AIS neurons are more likely to regulate homeostasis through AIS plasticity after exposure to external stimuli,and AIS plasticity exerts a greater effect on fpAPs.
Our results also indicated that bpAP speed at dendritic AISs was approximately 60% of that at the somatic AISs in the SD rat and C57 mouse neurons (Figure 4C,6B).According to the simulations,AP speed was lower in the dendritic AISs because their diameters were thicker than those of the somatic AISs (Figure 4D,E).Compared to the speed recorded at the somatic AISs,AP speed at the dendritic AISs was less sensitive to external stimulation (Figure 5A,B).On the other hand,when we used 20 mmol/L glucose to induce AIS plasticity,the length/location of AnkG and Nav1.2 staining at the dendritic AISs changed very little.One possible explanation is that the dendritic AIS neurons adapted to external stimuli through a different mechanism than the somatic AIS neurons,and the thick dendrite between the AIS and soma may function as a buffer zone during external stimulation.
After inducing AIS plasticity by administering glucose to rat and mouse neurons,we observed different changes in the distributions of AnkG and Nav1.2 in the somatic AIS neurons.In the rat neurons,during AIS plasticity,the proximal ends of both AnkG and Nav1.2 staining shifted distally,and shorter AnkG/Nav1.2 staining lengths were observed (Figure 8C–E).In the mouse neurons,during AIS plasticity,the proximal end of the AnkG-labeled AISs did not change but an increase in length and a distal shift at the distal end were observed;the proximal end of Nav1.2 staining also exhibited a distal shift,but with no change in length (Figure 8F–H).These results suggest that AISs in rat and mouse hippocampal neurons undergo different changes in AIS plasticity when subjected to external stimuli.This AIS plasticity,combined with synaptic plasticity,may play an important role in learning and memory.For example,previous studies have reported that mice use different strategies for learning spatial information than rats.In the Morris water maze,a spatial memory task in which spatial cues are used to lead rodents through a circular pool to a hidden platform,rats generally perform better than mice (Frick et al.,2000;Whishaw,1995).On the other hand,mice use simpler strategies than rats in the platform location test(Whishaw et al.,2001).
The distinct AIS features reported in this study may also be related to differences in functional and neurological disorders between rats and mice.For instance,fundamental species differences exist between rats and mice in the distribution of the serotonin (5-HT) receptor subtype 5-HT6 (Hirst et al.,2003).High levels of leucine rich repeat kinase 2 (LRRK2),which is linked to Parkinson’s disease,in the dopaminergic cell body region of the substantia nigra pars compacta are reported in mice but not in rats,which may affect studies on neurodegenerative diseases (Klein &Westenberger,2012).In particular,important and fundamental differences in neurogenesis in regions such as the hippocampus have been observed between rats and mice (Lazarov &Hollands,2016).Snyder et al.(2009) found that the rate of hippocampal neurogenesis is much higher in rats than in mice,and that hippocampal cells mature two weeks earlier,are more likely to escape cell death,and are 10 times more likely to be activated during learning in rats than in mice,thus revealing substantial differences in neuronal plasticity between the two species.
In conclusion,our study revealed several differences in neuronal AISs in rats and mice and in the performance of AIS plasticity between the two species,suggesting that mice are not simply “little rats”.Thus,comparing data from different species must carefully consider these and potentially other physiological and anatomical differences.
SUPPLEMENTARY DATA
Supplementary data to this article can be found online.
COMPETING INTERESTS
The authors declare that they have no competing interests.
AUTHORS’ CONTRIBUTIONS
Z.Y.C.,L.P.,M.Z.,Y.L.,and M.T.performed all experiments and analyzed the data.Y.Z.,P.Z.,and L.T.conceptualized the study,performed analyses,and drafted the manuscript with input from all authors.All authors read and approved the final version of the manuscript.
ACKNOWLEDGMENTS
We thank the National Center for Protein Sciences at Peking University,Beijing,China,and the State Key Laboratory of Membrane Biology at Peking University,Beijing,China,for their assistance.

- Zoological Research的其它文章
- Zoological Research call for papers of Cavefish Special Issue
- Fuel source shift or cost reduction:Context-dependent adaptation strategies in closely related Neodon fuscus and Lasiopodomys brandtii against hypoxia
- Ecological study of cave nectar bats reveals low risk of direct transmission of bat viruses to humans
- Population and conservation status of a transboundary group of black snub-nosed monkeys (Rhinopithecus strykeri) between China and Myanmar
- Nucleus accumbens-linked executive control networks mediating reversal learning in tree shrew brain
- Europe vs.China:Pholcus (Araneae,Pholcidae) from Yanshan-Taihang Mountains confirms uneven distribution of spiders in Eurasia