
In vivo microelectrode monitoring of real-time hydrogen concentration in different tissues of rats after inhaling hydrogen gas
2022-11-05 11:05BoYanLiuJunLiXueQianQianGuMinZhaoMengYuZhangMingYueWangYunWangShuCunQin
Medical Gas Research 2022年3期
Bo-Yan Liu, Jun-Li Xue, Qian-Qian Gu, Min Zhao, Meng-Yu Zhang, Ming-Yue Wang, Yun Wang,Shu-Cun Qin,*
1 Taishan Institute for Hydrogen Biomedicine, Shandong First Medical University & Shandong Academy of Medical Sciences, Taian, Shandong Province, China
2 Key Laboratory of Atherosclerosis in Universities of Shandong Province, Shandong First Medical University & Shandong Academy of Medical Sciences, Taian, Shandong Province, China
Abstract Medical effects of hydrogen have been reported in many studies.Due to difficulties in measuring hydrogen concentration in vivo after intake and high explosive risks of hydrogen, studies about dose-response relationships and tissue concentrations of hydrogen are few.Here, for the first time, we monitored real-time hydrogen concentrations in different tissues in rats including brain, liver, spleen, kidney, thigh muscle, inguinal white adipose tissue, and gonadal white adipose tissue after inhaling different concentrations of hydrogen (4%, 42%, and 67%) using an electrochemical sensor.Hydrogen concentrations in the same tissue showed a dose-dependent response.The equilibrium concentration values were highest in the brain and lowest in the thigh muscle.The saturation and desaturation curves changed more slowly in the thigh muscle and white adipose tissues than in other tissues.These results provide fundamental information for the selection of hydrogen dose applications in basic research and clinical trials.The experiments were approved by the Laboratory Animal Ethics Committee of Shandong First Medical University & Shandong Academy of Medical Sciences (No.2020-1028) on March 18, 2020.
Key words:different tissues; dose-response; hydrogen concentration; hydrogen sensor; in vivo; inhalation; rat; real-time monitoring
INTRODUcTION
Hydrogen gas (H2) is colorless and odorless at standard temperature and pressure.Due to its small molecular weight and hydrophobic properties, H2can easily permeate cell membranes and even enter cell organelles.H2has long been regarded as a biochemical inert gas.In 2007, Ohsawa et al.1demonstrated its selective antioxidant effects in a rat cerebral ischemia/reperfusion model.A large number of studies have since shown the therapeutic and preventive effects of H2in various animal disease models.2-5Meanwhile, some clinical investigations have also confirmed its beneficial effects on different diseases.6,7Various ways have been explored to administer H2, mainly including inhaling H2, drinking H2-rich water, injecting H2-rich saline, and direct incorporation of H2by diffusion (such as bath and eye-drops).Due to its bio-safety, countries and regions such as USA,8Japan,9Europe,10and China11have recently allow to use H2as a food additive.At present, the therapeutic effects of H2have attracted increasing attention worldwide.12
Despite rapid advances in understanding the biological effects of H2, the underlying mechanism is yet to be elucidated.In addition to the aforementioned hypothesis regarding selective scavenging of toxic free radicals, H2can exert its biofunctions by reducing inflammation and apoptosis events.13A hypothesis based on the bio-enzyme basis of H2was recently proposed,14and a new study showed that H2-rich water could significantly increase the activity of pepsin and change the protein structure and dynamic properties.15
Until now, the existing molecular mechanism of the biological effect of H2has not been fully explained due to lack of solid pharmacokinetic data.In addition, to the best of our knowledge, only a few studies have explored its concentration and distribution after intake.A previous study16determined H2concentrations in different rat tissues following the administration of H2via various routes.The study revealed variable dynamics of H2in various tissues over time and different H2concentrations in the same tissue with different methods of H2uptake.Anotherin vivostudy17monitored the sequential changes of H2concentrations in tissues over time with continuous inhalation of 3% H2.However, conclusions of both studies were not entirely consistent.Moreover, previous studies were performed only after a single concentration of H2intake.The dose-response curve had not been illustrated.Therefore, more accurate and detailed studies are needed to acquire the exact pharmacokinetics of H2.
This study pioneered a comprehensive and quantitative assessment of H2distributions within various tissuesin vivoafter different concentrations of H2being inhaled, and obtained the dose-response curve by real-time monitoring.
MATERIALs AND METHODs
Gas preparation
Different concentrations of H2(4%, 42%, 67%; v/v) were prepared using a lab-made gas mixing device (Figure 1A).H2and oxygen gas (O2) from cylinders and air from a generator (LCA-3, LICHEN-BX instrument technology Co., Ltd., Shanghai, China) with different flow rates were adjusted by flowmeters and mixed in a sealed box.The targeted concentration of H2was confirmed with a gas detector (XP-3140, New-cosmos Co.Ltd., Tokyo, Japan).Meanwhile, the O2concentration was kept at ~21% and verified with an O2detector (JR2000-02, Jingruibo Technology Co., Ltd., Beijing, China).The mixed gas was administered to a rat through a gas supply hood at a total flow rate of 3 L/min.
Animals and experimental design
Fifty 8-week-old specific-pathogen-free level male Sprague-Dawley rats weighing 180–210 g (Beijing Vital River Laboratory Animal Technology Co., Ltd., Beijing, China; SCXK (Lu) 20190003) were used in this study.All rats were maintained under standard conditions (21 ± 1°C; 12/12 hours light/dark cycle).Water and food were providedad libitum.The experiments were approved by the Laboratory Animal Ethics Committee of Shandong First Medical University & Shandong Academy of Medical Sciences (approval No.2020-1028) on March 18, 2020.
After overnight fasting, rats were sedated by intraperitoneal injection of 20% urethane (7 mL/kg, Shanghai Aladdin Biochemical Technology Co., Ltd., Shanghai, China).After losing consciousness, rats were put on a warming plate maintained at 38°C and then dissected to expose the target tissue with minimum incisions.The exposed tissue was covered with a layer of humid gauze with an opened small hole to maintain moisture in order to mimic the internal environment better, and then the microsensor tip was inserted into the tissue through the hole.
Seven tissues, including the left brain, median lobe of the liver, spleen, left kidney, thigh muscle (left hind gastrocnemius muscle), gonadal (visceral) white adipose tissue (WAT), and inguinal (subcutaneous) WAT (n= 3−6 per tissue), were monitored (Figure 1B).Only one target tissue was exposed at a time per rat.
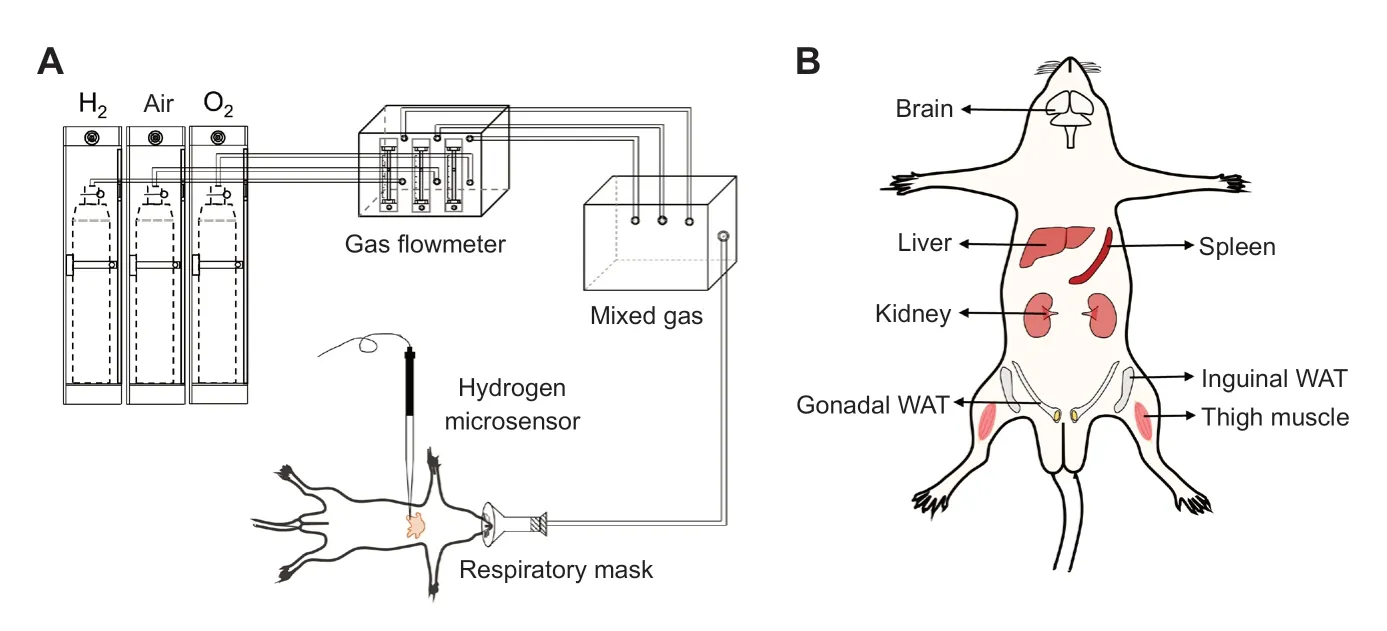
Figure 1:Device for H2 inhalation (A) and the seven representative tissues targeted for H2 concentration measurements (B).
H2 concentration monitoring in vivo
The measuring device included a miniaturized Clark-type hydrogen microsensor with an internal reference electrode and a sensing anode (tip diameter 40–60 μm), a micromanipulator, and a microsensor multimeter (Unisense, Aarhus, Denmark).The signals of Clark-type sensors were controlled by target gas concentrations, sensor dimensions, temperature, and salinity.18A standard curve was established by diluting the H2-saturated phosphate-buffered saline at 38°C.The tip of the microsensor was inserted into the exposed tissue at a depth of ~1 mm below the tissue surface.At first, the air was administered to maintain a stable baseline.Next, a required concentration of H2was provided continuously until the H2concentration in the target tissue reached equilibrium.Then, the gas was replaced by pure air and monitoring was continued until the H2concentration returned to baseline.Predicted by Henry’s law for the solubility of a gas in a liquid,19and the solubility of H2at a certain temperature and salinity,20the theoretical equilibrium concentrations (Ce) of 4%, 42%, and 67% H2in blood are about 28.5, 299.0, and 476.9 μM, respectively.The detection started before hydrogen inhalation.At the beginning, the rats were given air until reaching a stable baseline, then hydrogen was provided.
statistical analysis
Statistical analyses were conducted using Origin v8.5 (Origin Lab Corporation, Northampton, MA, USA) and GraphPad Prism v8.0.1 (GraphPad Prism Software, Inc., La Jolla, CA, USA).An ordinary one-way analysis of variance and Tukey’s multiple comparison test were used to assess the significance of differences in H2concentrations between various tissues.P< 0.05 was considered statistically significant.Data are representative of at least three independent experiments, and expressed as the mean ± standard deviation (SD).
REsULTs
ce of H2 in differe nt tissues
Ceof H2in different tissues after inhaling different concentrations of H2are shown in Figure 2.The figures display highest mean Cein the brain, followed by inguinal WAT and kidney, and lowest in the thigh muscle regarding the three concentrations of H2.Inter-organ comparisons revealed significant differences between the brain/thigh muscle and other tissues (P< 0.001 orP< 0.01) for different concentrations of H2.For 4% H2, Ceshowed a significant difference between inguinal WAT and liver (P< 0.05).For 67% H2, Ceshowed statistically significant differences between inguinal WAT and liver, spleen, gonadal WAT, respectively (P< 0.05).Ceof H2in all tissues exhibited a dose-dependent increase corresponding to the concentration of inhaled H2.Cevalues after inhaling 42% and 67% H2were about 10.5- and 16.8-time greater than 4% H2in various tissues.The theoretical Ceof H2based on a blood flow model and Henry’s law for the solubility of gas are also shown in Figure 2.
H2 saturation dynamics in different tissues
The H2dynamic curves for different tissues after inhaling various concentrations of H2are summarized in Figure 3A–F.In general, H2concentrations in the brain, liver, kidney, and spleen increased faster than in the thigh muscle, inguinal WAT, and gonadal WAT (Figure 3).For 4% H2, the concentrations in the brain, liver, kidney, and spleen rose rapidly in a short time and then gradually leveled in about two minutes for the liver, kidney, spleen and three minutes for the brain (Figure 3A).However, the plots for the thigh muscle, inguinal WAT, and gonadal WAT exhibited a gradual increase after H2was inhaled and they needed much more time to reach the Ce(Figure 3D).The ascending order of different tissues reaching 50% and 90% saturation concentrations was spleen, liver, kidney, brain, gonadal WAT, thigh muscle, and inguinal WAT (Figure 3G and H).For 42% and 67% H2, trends similar to those of 4% H2were observed (Figure 3B, C, E, and F) and the orders were same as 4% H2(Figure 3G and H).In the same tissue, similar time was needed to reach 50% Cefor different H2concentrations applied.Meanwhile, a dose-dependent relationship for the time to reach 90% Cewas observed (Figure 3G and H).

Figure 2:Equilibrium H2 concentrations in the brain, liver, spleen, kidney, thigh muscle, gonadal white adipose tissue (WAT), and inguinal WAT after inhaling different concentrations of H2.
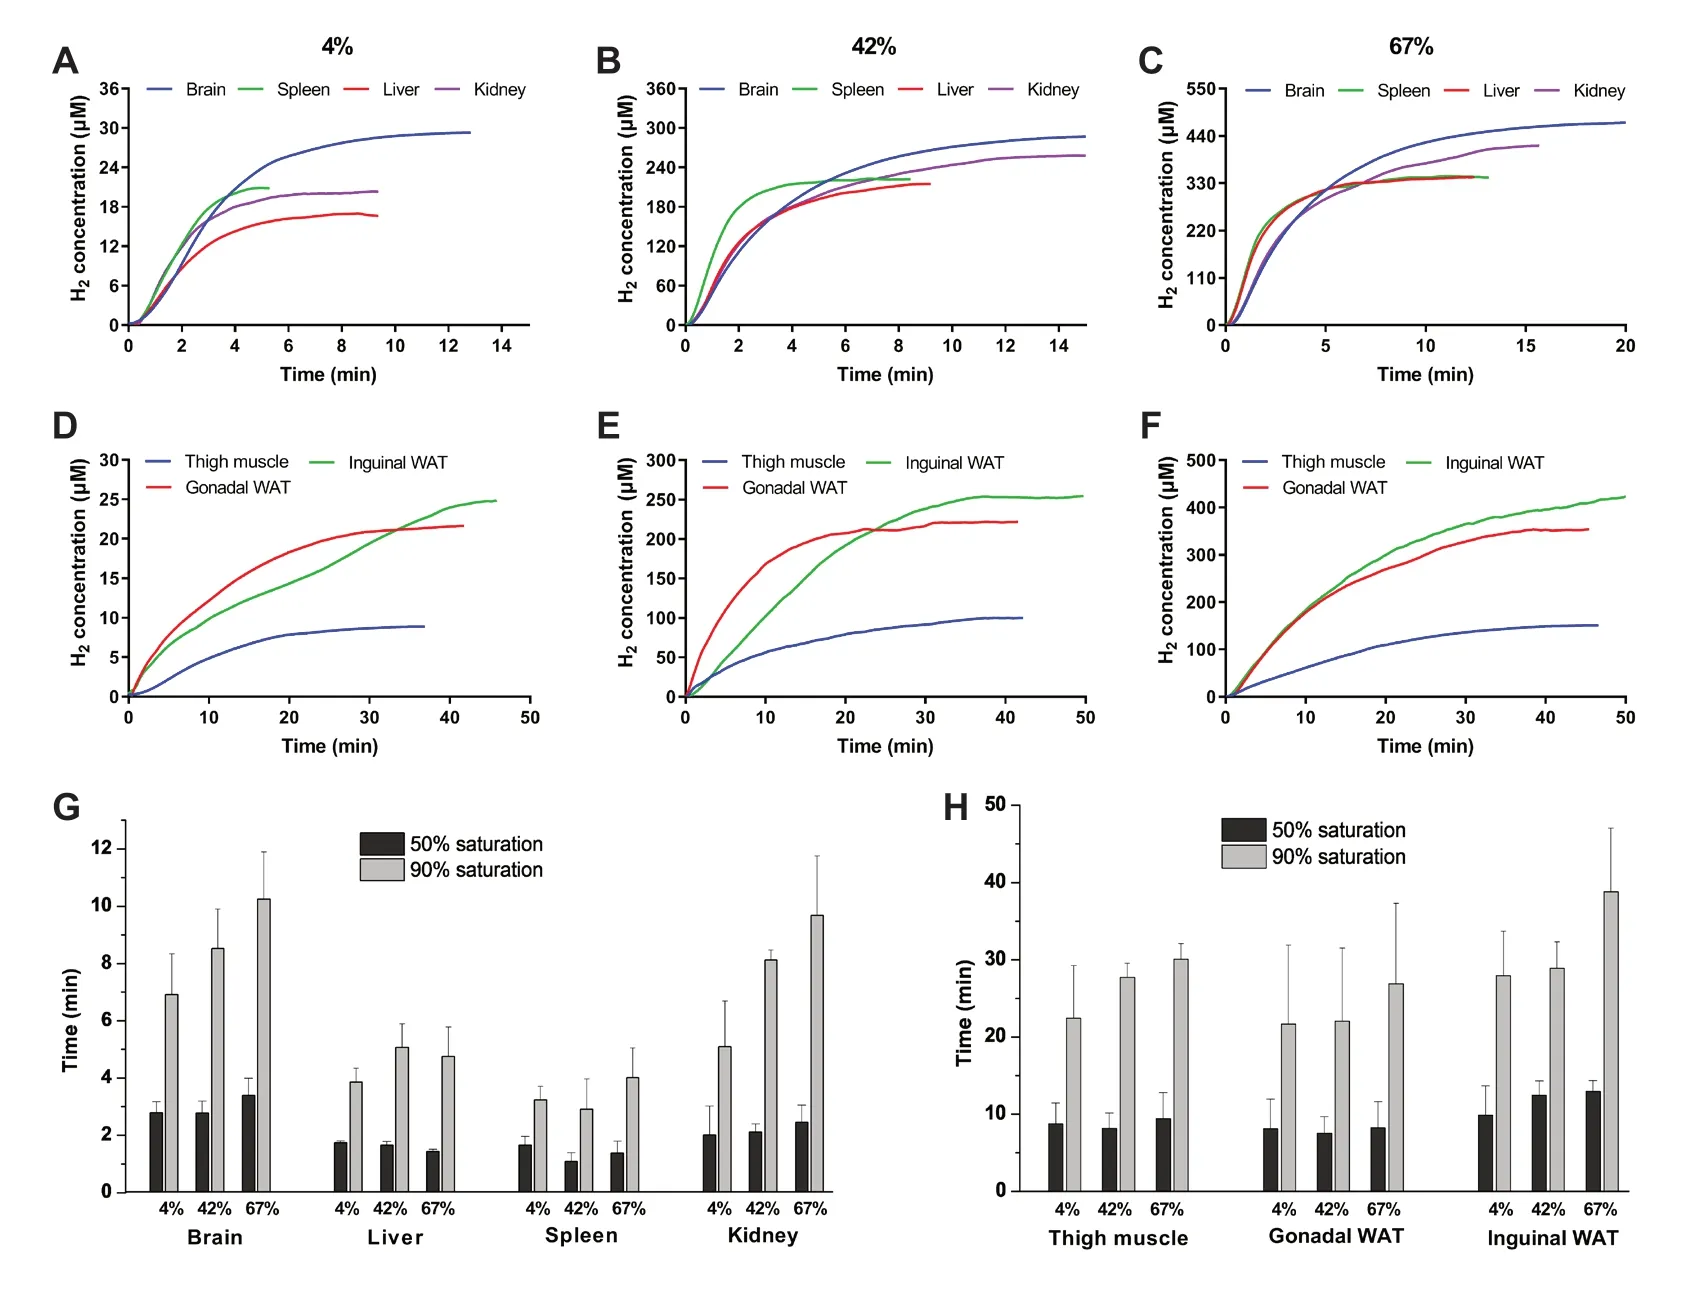
Figure 3:H2 saturation dynamics in the brain, liver, spleen, kidney, thigh muscle, gonadal white adipose tissue (WAT), and inguinal WAT after inhaling different concentrations of H2.
H2 desaturation dynamics in different tissues
The H2concentrations in different tissues started decreasing after H2administration was withdrawn (Figure 4A−F).In the beginning, the brain, liver, kidney, and spleen exhibited a similar sharp drop right after H2withdrawal, and then plots decreased gradually until reached the baseline (Figure 4A−C).However, the curves of the thigh muscle, inguinal WAT, and gonadal WAT exhibited a more gradual decrease after H2withdrawal and took more time to reach the baseline (Figure 4D−F).In ascending order of the time needed for different tissues to reach 50% and 90% desaturation, the spleen and liver took the least time, followed by kidney, brain, thigh muscle, gonadal WAT, and inguinal WAT (Figure 4G and H).In the same tissue, the times to reach 50% and 90% desaturation concentrations exhibited a dose-dependent relationship.More time was required to reach baseline for higher H2concentrations.
DIscUssION
As a small molecular gas, H2can diffuse into the target tissues without any hindrance, even while passing through the bloodbrain barrier.Inhalation is a common method to administer H2.When mixed with air, the explosive range of H2is 4–75% (v/v).21Hence, inhalation of 2–4% H2gas is frequently used in medical researches.1The development of H2generator has recently led to an increasing number of studies using high H2concentrations.A H2generator produces a mixture of H2(67%) and O2(33%) by electrolyzing water.A commercial medicalgrade H2/O2ventilator has been shown to ameliorate different diseases in animal models22,23and patients.24,25However, an abnormal O2content may have an ambiguous effect on research results.Therefore, in some experiments, the H2/O2mixture gas was diluted with nitrogen (N2) to obtain 42% H2and maintain the same O2concentration (~21%) as in the atmosphere.26The distribution of H2in tissues after inhaling low concentrations of H2has been investigated.16,17,27,28However, how the specific molecular mechanisms of high concentrations of H2differ from that of low concentrations needs further investigation.In addition, the distribution or concentration differences of H2in vivoafter inhaling different concentrations of H2also need further exploration.In this study, we monitored the concentrations of H2in different tissues in rats after inhaling 4%, 42%, and 67% H2.
In the beginning of inhalation, H2enters the arterial blood through the alveoli and is then taken into tissues by a pressure gradient until reaches equilibrium.In this study, H2in the brain reached the highest Ce, followed by inguinal WAT, kidney, gonadal WAT, spleen, and liver tissues.In the thigh muscle, the H2concentration was significantly lower than in other tissues.This is consistent with a previous report suggesting that the saturation concentration of H2in the thigh muscle is much lower than in the blood and myocardium of rats.27However, the distribution of H2concentrations in different tissues found in this study was contradictory to results in some other literatures.Yamamoto et al.17reported that after inhalation of 3% H2, the saturation concentration was highest in the liver and lowest in the kidney.Another study revealed that the H2concentrations in different tissues varied with different administration methods and H2inhalation resulted in the highest H2concentration in the muscle.16The reasons for the contradictory results varied and may be attributed to the different detected locations and depths chosen to represent the whole organ, the different concentrations and durations for H2inhalation, or the methodological differences.
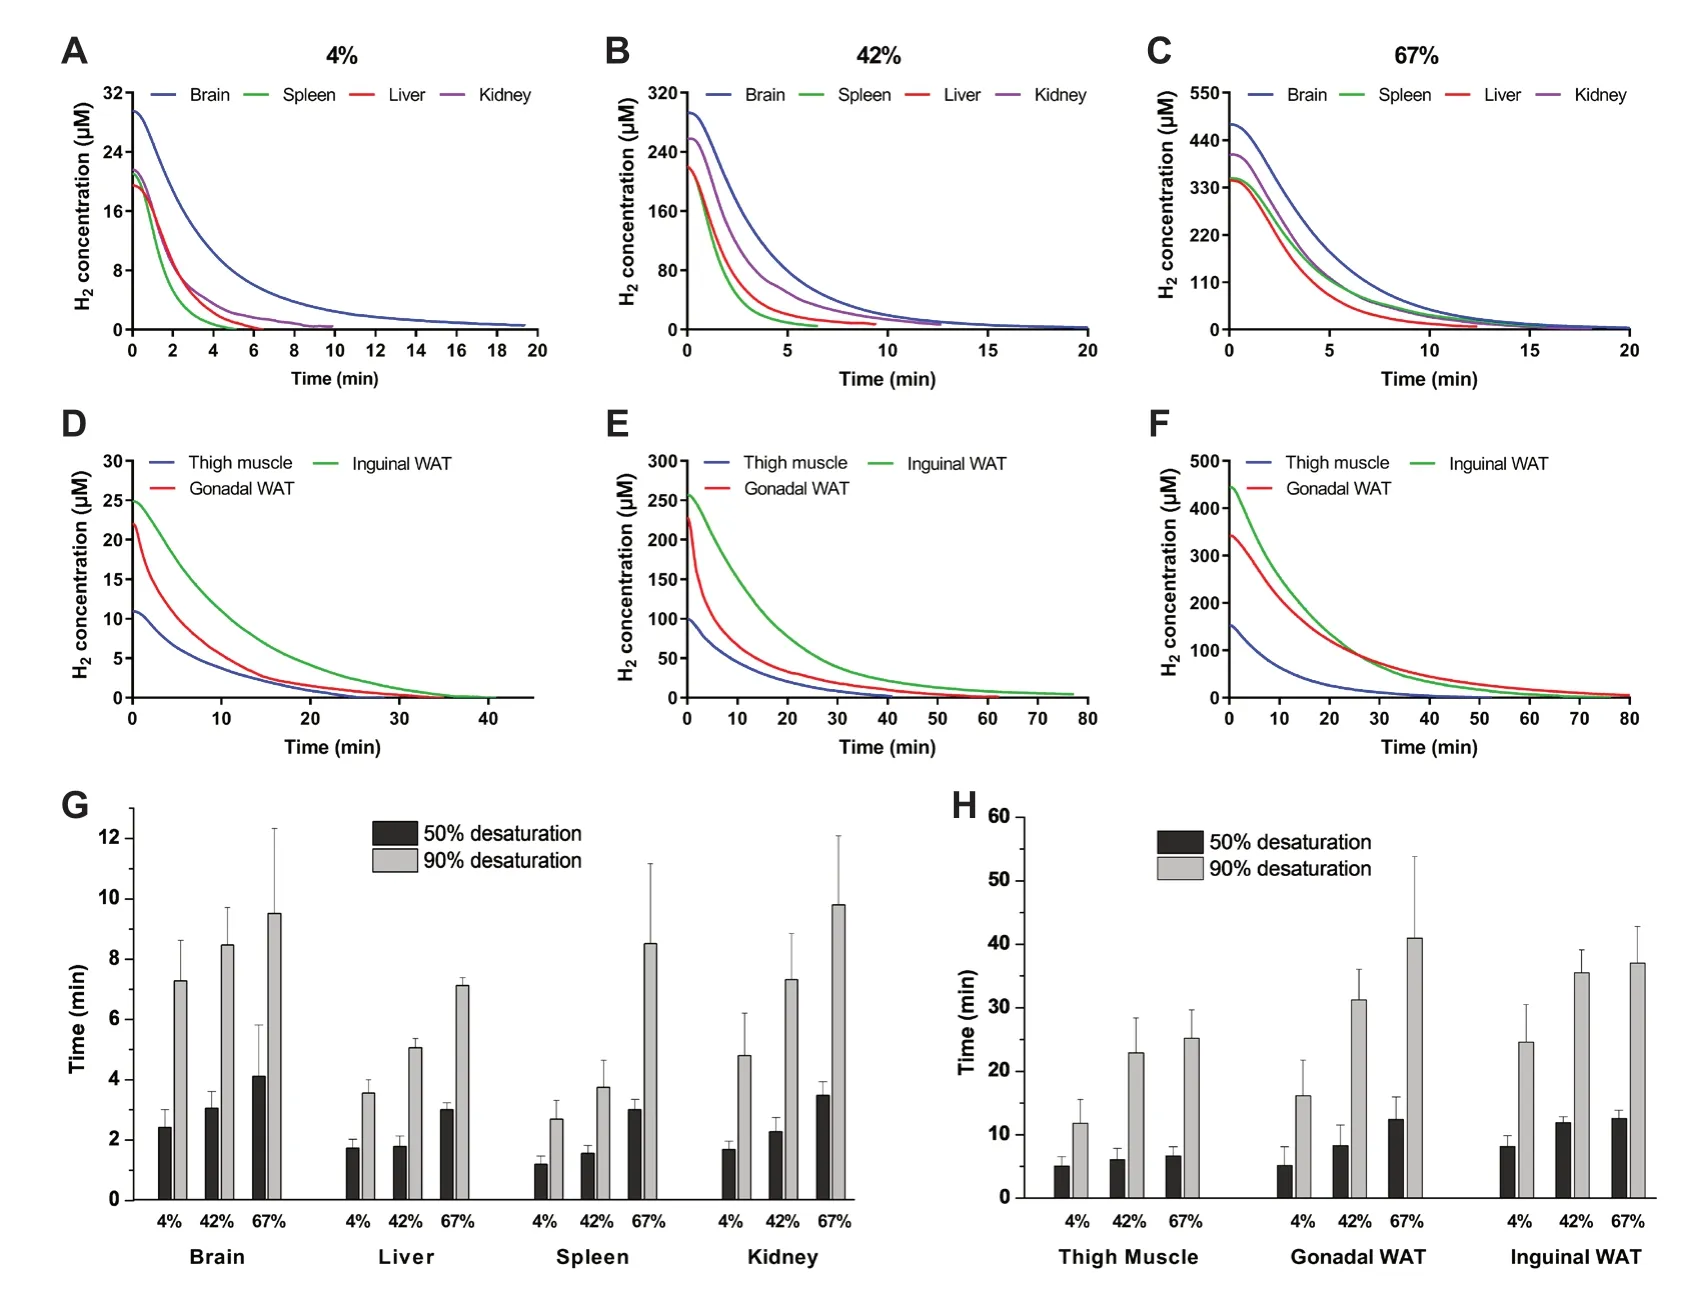
F i g u r e 4:H y d r o g e n desaturation dynamics in the brain, liver, spleen, kidney, thigh muscle, gonadal white adipose tissue (WAT), and inguinal WAT after inhaling different concentrations of H2.
Intermittent and continuous measurements have been applied to determine the H2concentrations in tissues.An intermittent measurement requires taking samples at regular intervals.After homogenization, H2is released into an airtight tube and then the gas is collected and measured with gas chromatography.16In contrast, continuous measurement leads to the ability to create a continuous concentration curve against time using a microsensorin vivo,17which has been used in biomedical fields.29,30A continuous measurement was performed in this study to obtain a complete equilibrium curve.
The Ceof H2for 4%, 42%, and 67% H2at 0.9% salinity have been shown to be about 28.5, 299.0, and 476.9 μM, respectively.20A previous study revealed that the H2concentration in the blood was in accordance with the value predicted by Henry’s law for the solubility of a gas in liquid.28It would be interesting to compare the actual Cewith theoretical concentrations in tissues rather than blood.In this study, only the Ceof H2in the brain was consistent with the theoretical concentrations, whereas in other tissues the Ceof H2were lower, especially in the thigh muscle.This may result from the diffusion of H2into the surroundings.A previous study detected the H2concentrations in air samples from the surface of the skin after volunteers inhaled 4% H2.31The gaseous diffusion model and the blood flow model have been applied in theoretical models of H2distributions.17As per the gaseous diffusion model based on the distance between the gas supply hood and each organ, the brain reached a higher H2concentration due to the short distance between the face and head.In the blood flow model, different tissues reached the same Ceof H2at different rates based on the blood flow.17This study indicated that both of the models worked because highest Ceof H2was found in the brain, and the Ceof H2in most tissues approached the theoretical concentrations.
H2concentrations of different tissues showed different saturation and desaturation rates in this study.In general, spleen and liver tissues needed less time to reach 50% and 90% Ce, followed by the kidney and brain.In tissues of the thigh muscle, gonadal WAT, and inguinal WAT, the equilibrium rates were slower than other tissues.The blood flow of muscle and adipose tissue was slower than that of abdominal tissues.32,33This may lead to a slower equilibrium rate.Moreover, as a fat-soluble gas, H2accumulated in adipose tissues.This leads to a slower rate when approaching equilibrium compared with other tissues.34A previous report17showed that the saturation time was significantly longer and the concentration increased more slowly in muscle than the other examined organs for 3% H2.Another study revealed that for 2% H2, the arterial H2concentration in rats reached a maximum level after 5 minutes, whereas the increasing rate of H2concentration was much slower in the center of the thigh muscle and it reached the maximum level after 30 minutes.27
The blood flow rate in various tissues has been measured by the H2clearance method.33,35Therefore, the desaturation of H2occurs mainly through blood circulation to the lung and then is released out of the body.
Anin vitroexperiment has shown a dose-dependent relationship for H2in protecting cells from cell death and reacting with hydroxyl radicals.1In anin vivoexperiment, inhalation of H2(1−4%) was applied for hepatic injury caused by ischemia-reperfusion, and 2−4% H2was found to work the best.36Another study27on myocardial ischemia-reperfusion injury revealed that inhalation of 0.5−2% H2significantly reduced infarct size in a dose-dependent manner with 2% H2providing the most prominent effects.In contrast, 4% H2inhalation did not show the alleviating effect.27These results indicated the importance of choosing the appropriate dosage of H2for various tissue injuries.Considering the different Ce, the optimal concentration of H2inhalation may vary from disease to disease.Moreover, given the different saturation rates in tissues, different inhalation times may be needed to achieve the desired effect for lesions in different tissues, especially in muscle and adipose tissue.
We used a microsensor tip inserted into the tissue at a depth of 1 mm below the organ surface.The concentrations of H2may vary between different locations and depths in a same tissue and it is needed to estimate in future studies.This study revealed the H2distribution in different tissues under anesthesia in rats.However, it is known that anesthesia results in the tendency for blood flow rates to decrease in most tissues.33To confirm these results, it would be of interest to measure the H2distribution in different tissues while the animal is in a conscious state.However, at present, this would be difficult to achieve because of the constraints of the current measurement methods.Pharmacokinetics of H2in vivovaries with methods of administration and thus influence the biomedical effects.Other H2intake methods, such as drinking H2-rich water, are also worth further exploration.
To summarize, the H2distribution in different tissues of rats during and after inhaling different concentrations of H2over time was investigated.The results provide a reference for H2dose selection for animal and clinical trials and promote the use of H2in clinical therapies.
Acknowledgements
The authors are grateful to technical instructors of Shanghai Weizai Technology Co., Ltd.for their help in the monitoring technology.
Author contributions
BYL, JLX, and SCQ designed the experiments.BYL, JLX, QQG, MYZ, MZ and MYW performed experiments.JLX and BYL analyzed the data and wrote the manuscript.YW helped with the methodology.All authors reviewed the manuscript.
conflicts of interest
There is no conflict of interest.
Open access statement
This is an open access journal, and articles are distributed under the terms of the Creative Commons AttributionNonCommercial-ShareAlike 4.0 License, which allows others to remix, tweak, and build upon the work non-commercially, as long as appropriate credit is given and the new creations are licensed under the identical terms.©Article authors (unless otherwise stated in the text of the article) 2022.All rights reserved.No commercial use is permitted unless otherwise expressly granted.

- Medical Gas Research的其它文章
- Current research progress of isoflurane in cerebral ischemia/reperfusion injury:a narrative review
- Comparative analgesic, hemodynamic, pain and duration of sensory and motor block effects of dexmedetomidine, granisetron, and nitroglycerin added to ropivacaine in intravenous anesthesia for forearm surgeries:a randomized clinical study
- Effects of different fresh gas flows and different anesthetics on airway temperature and humidity in surgical patients:a prospective observational study
- Hydrogen-rich bath with nano-sized bubbles improves antioxidant capacity based on oxygen radical absorbing and inflammation levels in human serum
- Color change after tooth bleaching with ozone and 10% ozonized carbamide peroxide for in-office use
- spuriously low end tidal carbon dioxide in capnometry:Nafion tube malfunction in end tidal carbon dioxide module blamed for near mishap!