退火温度对LiBaPO4∶Eu3+荧光粉的结构及发光性能影响
2022-12-06 06:29王喜贵
无机化学学报 2022年11期
史 荣 王喜贵
(内蒙古师范大学化学与环境科学学院,呼和浩特 010022)
0 Introduction
White light-emitting diodes(wLEDs)are currently one of the most efficient light sources in solid-state lighting applications.At present,there are three main ways to realize wLEDs.One is a white light emission composed of blue and yellow light by coating YAG phosphors on the blue LED chip,when the correlated color temperature of the device decreases,its total efficiency will decrease rapidly;And the lack of red light and its poor color rendering make it unsuitable for solid-state lighting;Secondly,red,green,and blue LED chips are mixed in a certain proportion to produce white light;Finally,the LED ultraviolet light chip is coated the trichromatic phosphor.All of those show that red phosphor plays an important role in achieving white LED.Among the various trivalent rare-earth ions,Eu3+is the preferred source of red light due to its simple energy level structure for probing the local environment of Eu3+ions,and Eu3+doping in crystal hosts is widely studied for potentially efficient red lightemitting materials due to its large transitions from5D0excitation level to7FJ(J=0,1,2,3,4)energy level in the 4f6configuration in the red region[1-2],such as NaYGeO4∶Eu[3],Ba3B6Si2O16∶Eu[4],LaSrAl3O7∶Eu[5],etc.
The great interest in phosphors has led to the rapid development of various displays and other related lighting technologies.For general lighting applications,such as UV light-emitting diodes,photoluminescence(PL)bodies,including silicate,aluminate,aluminosilicate,nitride,and borate,all play a vital role as substrates[6-9].Among the subjects of these studies,phosphate as the main material has attracted attention due to its ability to provide many crystal field environments imposed at the emission center.ABPO4phosphates with a more rigid crystal structure,good thermal stability,and high quantum conversion rate at high temperatures are also a good matrix for fluorescent materials[10]and one of the most promising phosphor materials for lamps,cathode ray tubes(CRT),and plasma display panels(PDP)[11].Among them,the LiBaPO4host provides good applicability in luminescence and other fields.
LiBaPO4-based phosphors have been reported in previous studies,such as LiBaPO4∶Eu3+phosphors prepared by the high-temperature solid-phase method[12].However,The emission spectra showed multi-peak characteristics,and the annealing temperature has not been analyzed;the LiBaPO4∶Eu3+phosphor was prepared by an improved high-temperature solid-phase method[13],where only the concentration was explored and its X-ray diffraction(XRD)pattern showed unexplained miscellaneous peaks;The preparation process of the LiBaPO4∶Eu3+phosphor prepared by citrate sol method[14]was complicated and the concentration was explored and its optimal doping concentration(molar ratio)was 1%,etc.Previous studies have not investigated the effect of annealing temperature on the emission intensity of LiBaPO4∶Eu3+phosphors prepared by solgel method.Herein,a single-doped Eu3+phosphor based on LiBaPO4was prepared by the sol-gel method,and the structure and luminescence properties of the materials at different annealing temperatures and doping concentrations were studied in detail.
1 Experimental
1.1 Reagents and instruments
Diammonium hydrogen phosphate((NH4)2HPO4,AR,99.0%)was purchased from Tianjin Shengao Chemical Reagent Co.,Ltd.,which was dissolved in distilled water to formulate a 2.00 mol·L-1(NH4)2HPO4.Eu2O3(AR,99.999%)was purchased from Baotou Research Institute of Rare Earths,which were dissolved in HNO3solution to formulate a 0.10 mol·L-1Eu(NO3)3solution.Ba(NO3)2(AR,99.0%)and Li2CO3(AR,99.0%)were purchased from Tianjin Tianda Chemical Experiment Factory and Shanghai Aladdin Biochemical Technology Co.,Ltd.,respectively.Li2CO3was dissolved in HNO3solution to formulate a 1.00 mol·L-1LiNO3solution.Ba(NO3)2was dissolved in distilled water to formulate a 0.20 mol·L-1Ba(NO3)2solution.The citric acid(C6H8O7,AR,99.5%)was purchased from Beijing Chemical Works.
The heating rate of thermogravimetric-differential thermal analysis(TG-DTA)by using French Setaram Labsys Evo synchronous thermal analyzer was 10℃·min-1.The Fourier transformation infrared(IR)spectrum was detected by the KBr compression method using infrared spectrometer Nicolet 6700 with the scanning 32 times.The phase purity and crystal structure of the samples were confirmed by XRD analysis in the range 20°-80°using Japan Ultima Ⅵ XRD diffractometer type with a Cu Kα radiation of wavelength 0.154 06 nm(U=40 kV,I=40 mA).The PL spectra were recorded using Japan Model fluorescence spectrometer F-4500,with a scanning speed of 1 200 nm·min-1and a slit width of 2.5 nm.
1.2 Synthesis
LiBaPO4∶Eu3+phosphors were synthesized by the sol-gel method.Firstly,LiNO3(5.00 mL),Ba(NO3)2(25.00 mL),and amount of Eu(NO3)3(The molar fractions related to LiBaPO4were 1%,3%,5%,7%,9%,11%,13%)were added to a clean beaker,and the solution was thoroughly stirred.Then citric acid with a molar ratio of 1∶1 to rare-earth ions was added and stirred for 30 min.Secondly,(NH4)2HPO4solution(2.00 mol·L-1)was added and the solution was heated and kept at 80℃and stirred for 30 min.Thirdly,the obtained solution was placed in a drying oven at 100℃for 12 h to obtain a gel with a porous structure.Finally,the dried gel was annealed at different temperatures for 2 h to obtain the final samples.
2 Results and discussion
2.1 TG-DTA
Fig.1 shows the TG-DTA curves of the precursors of LiBaPO4under gradient annealing.The weight loss and endothermic phenomena in TG and DTA curves before 150℃are related to the loss of crystal water;The exothermic peak in the DTA curve at 175.39℃is attributed to the decomposition of nitrate;The exothermic peak at 510.20℃is due to the residual organic compounds and the combustion reaction between nitrate compounds and citric acid[15].Although the material underwent exothermic reaction above 600℃,its weight loss curve tends to be stable,which is considered to be the formation of the final LiBaPO4phase.Above 700℃,the structure of the material tended to be stable and did not change.Therefore,the preparation temperature of the material is above 700℃.
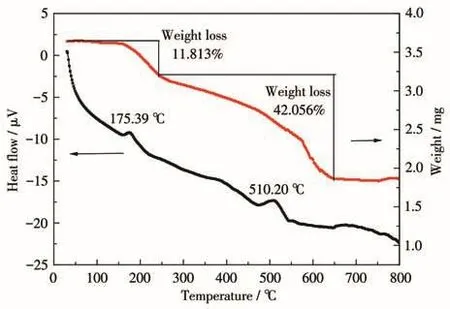
Fig.1 TG-DTA curves of LiBaPO4 under gradient annealing
2.2 IR spectrum
Fig.2 shows the IR spectrum of LiBaPO4∶13% Eu3+in the range of 1 600 to 500 cm-1.The absorption band around 1 386-1 400 cm-1is caused by the stretching of the P=O along the phosphate chain and the asymmetric stretching of PO2[16].The band at 1 035 cm-1is caused by PO43-symmetric stretching vibration[17].The vibration band at 584 cm-1is attributed to P—O—P asymmetric stretching[18].
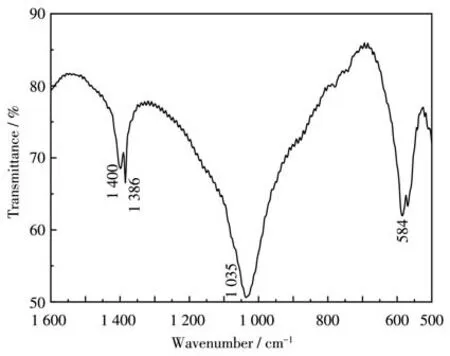
Fig.2 IR spectrum of LiBaPO4∶13% Eu3+
2.3 XRD analysis
Fig.3 shows the XRD patterns of LiBaPO4and LiBaPO4∶Eu3+.All of the XRD patterns are consistent with the standard card(PDF No.14-0270).The XRD pattern of LiBaPO4annealed at 900℃shows that LiBaPO4belongs to hexagonal crystals,the space group is P63,the lattice constants a=b=0.904 6 nm,c=1.256 6 nm,V=0.391 577 nm3,Z=4.
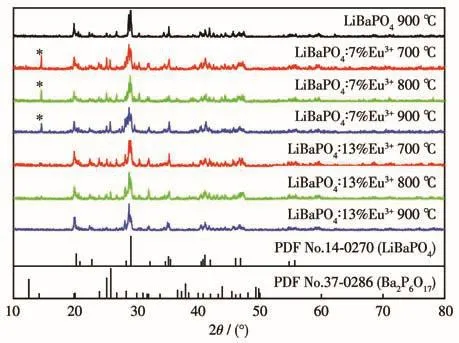
Fig.3 XRD patterns of the LiBaPO4 and LiBaPO4∶Eu3+phosphors
The XRD patterns of LiBaPO4∶7% Eu after annealing at 700,800,and 900℃for 2 h are also basically consistent with the standard card(PDF No.14-0270),but the Ba2P6O17impurity phase appeared at 15°,and the change of annealing temperature also caused different degrees of splitting of LiBaPO4crystal.The weakest degree of splitting was observed when the annealing temperature was 800℃.
It was found that with the increase of Eu3+doping concentration,the impurity phase of Ba2P6O17disappeared at 15°,and the temperature of different degrees of splitting of LiBaPO4changed.When the annealing temperature was 900℃,the splitting degree was the weakest and tended to the pure phase,so 900℃was selected as the best annealing temperature of the samples.The possible reason is that with the increase of annealing temperature and Eu3+doping concentration,the number of luminescence centers increases,and the molecules or ion groups in the crystal rotate freely,to obtain higher symmetry and make the crystal structure more complete;Or when Eu3+replaces Ba2+,lattice defects are created and more luminescent centers are generated[19].
2.4 TEM images of LiBaPO4∶Eu3+
The TEM images of LiBaPO4∶Eu3+are shown in Fig.4.It can be seen that LiBaPO4∶7% Eu3+was composed of a circular particle with a particle size of about 200 nm(Fig.4a).Fig.4b shows a representative TEM image of LiBaPO4∶13% Eu3+and it was composed of easily clumped particles with irregular morphology and partially agglomerated int circular particles(Fig.4c),which may be the reason for the splitting of the XRD peak.The agglomeration of the particles can enhance the electron-hole recombination rate and the luminescence performance of the phosphors[20-21].
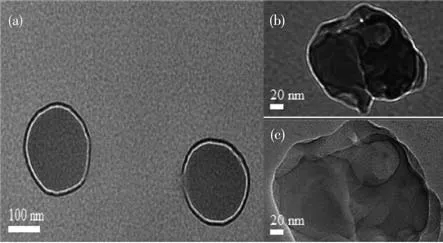
Fig.4 TEM images of LiBaPO4∶7% Eu3+(a)and LiBaPO4∶13% Eu3+(b,c)
2.5 Luminescence properties of LiBaPO4∶Eu3+
Fig.5 shows the excitation and emission spectra of LiBaPO4∶7% Eu3+phosphors at different annealing temperatures.As shown in Fig.5a,the excitation spectrum was composed of broadband of 200-300 nm and some spikes,where the strongest peak in 200-300 nm broadband was located at 255 nm and belongs to the O2--Eu3+charge transfer band from the ligand to the metal,while the spikes in 300-500 nm correspond to the f-f transition of Eu3+ions,which corresponds to7F0-5H6(318 nm),7F0-5D4(362 nm),7F0-5L7(382 nm),7F0-5L6(394 nm),7F0-5D3(416 nm),and7F0-5D2(465 nm)transitions,respectively[22].It is found that the excitation spectra of the samples annealed at 800 and 900℃were quite different.The optimum excitation wavelength of the sample annealed at 800℃was 255 nm,and the monitoring wavelength used in the test was 593 nm,while the optimum excitation wavelength of 900℃annealed samples was 394 nm,and the monitoring wavelength was 615 nm.
As shown in Fig.5b,the emission spectra were composed of peaks in the range of 570-700 nm,which is related to the transition of Eu3+from5D0to7FJ(J=0,1,2,3,and 4)energy levels,attributed to5D0→7F0(578 nm),5D0→7F1(593 nm),5D0→7F2(615 nm),5D0→7F3(652 nm),and5D0→7F4(688 nm)[23].The emission spectra of the samples annealed at 800℃with 255 or 394 nm as excitation energy showed that the strongest emission peak appeared at 593 nm,corresponding to the5D0→7F1transition,while the peak at 615 nm corresponding to the5D0→7F2transition was weak,indicating that Eu3+occupies the center of inversion symmetry and hardly changes with the crystal field strength.The emission spectra of the samples annealed at 900℃with 394 nm as the best excitation energy showed that the intensity difference between the emission peak at 593 nm corresponding to the5D0→7F1transition and the emission peak at 615 nm corresponding to the5D0→7F2transition was small and the intensity of the emission peak at 615 nm was slightly stronger,indicating that Eu3+is located in the asymmetric central lattice,and the odd-order term of the crystal field can mix the opposite parity state into the 4f6configuration energy level.At this time,the electric dipole transition is no longer strictly prohibited,Eu3+is mainly emitted by5D0→7F2forced electric dipole transition,and the whole material is red light emission[24].Combined with the XRD patterns,it is speculated that the existence of the Ba2P6O17phase may be one of the reasons for the energy redistribution of Eu3+between5D0-7F1and5D0-7F2transitions[25].These changes showed that the monitored wavelengths varied with annealing temperature and their dominant energy level transitions,which may be related to the crystal structure and coordination environment of the activator at different temperatures[26].
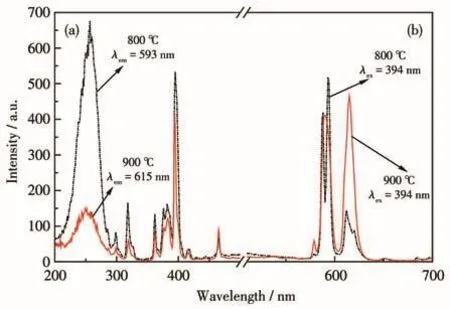
Fig.5 Excitation(a)and emission(b)spectra of LiBaPO4∶7% Eu3+annealed at 800 and 900℃
Generally,the intensity of the charge transfer band was higher than the f-f transition of Eu3+,but the LiBaPO4∶Eu3+phosphors annealed at 900 ℃ have observed an experimental phenomenon different from that of 800℃,that is,the intensity of the f-f transition was stronger than the charge transfer band,which may be related to the fact that the energy of Eu—O electron cloud migration is not enough to effectively reach the luminous center of Eu3+[27].In the excitation spectrum,the sample annealed at 900℃shows a small excitation band near 255 nm.The analysis shows that the substitution of Eu3+for Ba2+into the matrix lattice is unequivalent,and interstitial oxygen or vacancy may be generated in the crystal during annealing at 900℃.This makes it difficult for the 2p electrons of O2-adjacent to Eu3+to migrate to the 4f level of Eu3+,resulting in the decrease of charge transition efficiency between O2-→Eu3+[12].At the same time,the exciting 2p electron of O2-enters the 4f orbital of Eu3+,and the energy difference between the 2p valence band of O2-and the 4f orbital of Eu3+determines the position of the charge transfer state(CTS).Although the bonding between Eu3+and ligand O2-is independent of the 4f orbital,the bonding orbital(2p)and anti-bonding orbital(5d)are formed by the interaction between the 5d orbital of Eu3+and the 2p orbital of O2-.The longer the Eu3+—O2-bond,the smaller the energy difference between the 2p valence band of O2-and the 4f orbital of Eu3+.Since the average bond length of Ba—O is greater than that of Li—O,the energy difference between the orbital of Eu3+and the 2p electron of O2-is small.Therefore,the CTS energy of Eu3+occupying the Ba2+lattice is low[28].
Fig.6 shows the relationship between emission intensity and the Eu3+doping concentration of LiBaPO4.During annealing at 800℃,with the gradual increase of Eu3+concentration,the emission intensity of the sample increased first and then decreased.With the increase of Eu3+concentration,the intensity of the emission peak reached the maximum when the concentration of Eu3+was 7%.The existence of too many luminescent centers of Eu3+makes the distance between Eu3+shorter,and the probability of collision between ions in the excited state increases,so part of the ions in the excited state will lose excitation energy and return to the ground state.So that the phosphor luminous intensity gradually weakened.When the annealing tem-perature was 900℃and the doping concentration reached 13%,the emission peak intensity still showed an upward trend,and the optimal doping concentration was not determined.
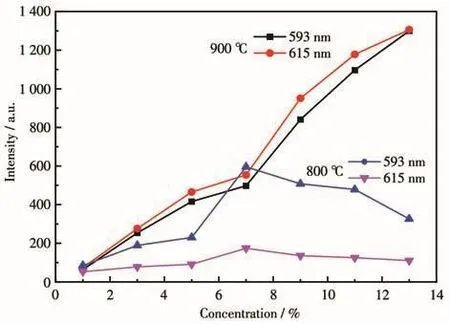
Fig.6 Relationship between emission intensity and the Eu3+doping amount of LiBaPO4∶Eu3+
Fig.7 shows the relationship between emission intensity and annealing temperature of the sample.It is determined that the optimal annealing temperature was 900℃,and only at this annealing temperature,the emission spectrum was dominated by the5D0→7F2energy level transition,indicating that the annealing temperature is too high or too low,which is not suitable for the preparation of red phosphors.
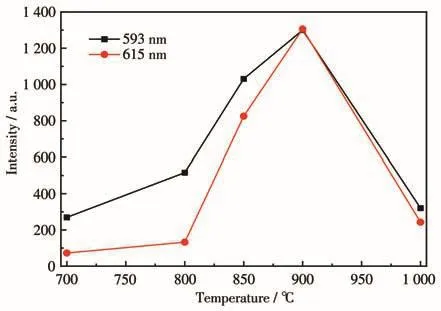
Fig.7 Relationship between emission intensity and annealing temperature of LiBaPO4∶13% Eu3+
The difference with the experimental results[12]is that the optimum doping concentration of the sample synthesized by the high-temperature solid-state method was 5%;Puppalwar et al.[13]used the improved hightemperature solid-state method,and the optimum doping concentration of the sample was 3%;Game et al.[14]the prepared samples by citric acid sol method,the best doping concentration of the samples was 3%.However,the emission peak intensity of the samples prepared by the sol-gel method in this experiment still showed an upward trend when the doping concentration was 13% and the optimal annealing temperature was 900℃.The results show that the phosphor prepared by the sol-gel method can improve the luminescence efficiency of rare-earth ions more than other methods,and can effectively delay the concentration quenching effect of rare-earth ions.Compared with the Eu3+luminescence properties of other material systems,orange or red phosphors can be prepared at different annealing temperatures.The result is consistent with the XRD result.The sample annealed at 900℃was a pure phase of LiBaPO4with good luminescence.The spectral characteristics of the material show that LiBaPO4∶Eu3+can be effectively excited by 394 nm long-wave ultraviolet light,indicating its potential application value in the field of wLEDs.
The critical distance(Rc)corresponding to the critical quenching concentration is defined as the average shortest distance between the nearest Eu3+ions where energy transfer occurs.If the distance between adjacent Eu3+ions is less than 0.5 nm,the energy transfer is mainly realized by exchange interaction,and when the distance is greater than 0.5 nm,the multi-pole interaction is dominant.The critical distance of energy transfer is estimated by the following formula:
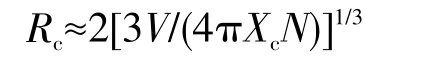
Where Xcis the critical concentration,N is the number of cations in the unit cell,and V is the volume of the unit cell.According to the crystal structure of the sample,the V and N values were obtained by consulting relevant information,and the Xcvalues were obtained by analyzing the experimental data(V=0.391 577 nm3,Z=4,and Xc=0.07(800℃)/Xc=0.13(900℃),respectively).The critical distance of LiBaPO4∶Eu3+was calculated to be about 1.387 7 nm/1.128 9 nm,which is greater than 0.5 nm.Therefore,the multipole interaction of the samples annealed at 800 or 900℃is responsible for the concentration quenching.
Fig.8 shows the simplified energy level diagram and the proposed relaxation mechanism of Eu3+in LiBaPO4∶Eu3+under excitation at 394 nm.PL emission is due to the transition of electrons between energy levels,involving the excitation of electrons from the ground state to the excitation level5L6of Eu3+after absorbing an excited photon,and then non-radiative relaxation to the lower5D0energy level of Eu3+ions.The rapid non-radiative(NR)multi-phonon relaxation from the excited state to the5D0energy level is followed by the radiative emission corresponding to the5D0→7FJ(J=0,1,2,3,4)transition of Eu3+.Taking 394 nm excitation as an example,under the excitation of this wavelength,the electron undergoes a7F0-5L6transition,and then transfers to the lower energy level of5D0through non-radiative transition,resulting in characteristic emission at 593 and 615 nm(5D0→7F1,2).The excitation mechanism of other wavelengths is the same.When the annealing temperature was 800℃,Eu3+occupies the center of inversion symmetry and the5D0→7F1transition is strong;When annealed at 900℃,Eu3+is in the central lattice of non-inversion symmetry,and Eu3+is mainly emitted by5D0→7F2electric dipole transition.
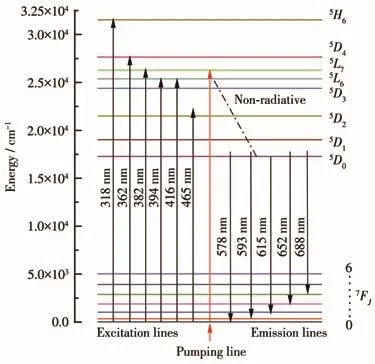
Fig.8 Simplified energy level image of Eu3+
2.6 CIE coordinate of LiBaPO4∶Eu3+
Fig.9 is the CIE coordinate diagram of LiBaPO4∶7% Eu3+(800 ℃)and LiBaPO4∶13% Eu3+(900 ℃)phosphors calculated by 1931CIE.The coordinate value of LiBaPO4∶7% Eu3+at 800 ℃ was(0.457 0,0.484 4);At 900℃,the coordinate value of LiBaPO4∶13% Eu3+was(0.576 0,0.354 6),which are all located in the redlight region.
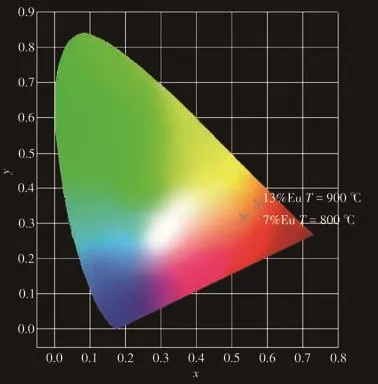
Fig.9 CIE coordinate diagram of the LiBaPO4∶Eu3+phosphors
3 Conclusions
The LiBaPO4∶Eu phosphors were prepared by the sol-gel method.The results of the TGA showed that the LiBaPO4phase could be formed after 700℃.The absorption peaks obtained in the IR spectra confirmed the existence of PO43-and symmetrical and asymmetrical tensile vibrations among P—O in the samples.The XRD results showed that the temperature variations caused the split in varying degrees of diffraction peaks.The doping concentration of Eu3+will affect the structure,and the sample with a small doping concentration appeared heterophase.With the increase of concentration,the sample showed a pure phase.The experimental results show that when the annealing temperature was 800℃,the charge transfer band was the monitoring wavelength,and the emission spectrum was dominated by the5D0→7F1,indicating that Eu3+occupies the center of inversion symmetry.When the annealing temperature was 900℃,the f-f transition was the monitoring wavelength,and the5D0→7F2emission of Eu3+in LiBaPO4was dominated,indicating that Eu3+is in an asymmetric central lattice.With the change of monitoring wavelength,the dominant energy level transition was different,and the concentration quenching caused by Eu3+also changed.CIE calculation showed that the color purity of the sample became better with the increase in annealing temperature and concentration.
猜你喜欢
陶瓷学报(2021年5期)2021-11-22
儿童故事画报(2021年7期)2021-10-04
大众文艺(2021年12期)2021-07-19
陶瓷学报(2020年6期)2021-01-26
贵州农机化(2020年3期)2020-12-24
长江丛刊(2018年8期)2018-11-14
中国计量大学学报(2018年2期)2018-07-12
商情(2017年9期)2017-04-29
草原歌声(2017年4期)2017-04-28
大陆桥视野(2016年14期)2016-12-27