天津市大气颗粒物中有机标识物粒径分布的季节特征
2022-12-19 12:32王晓宁田瑛泽薛倩倩
中国环境科学 2022年11期
王晓宁,田瑛泽,薛倩倩
天津市大气颗粒物中有机标识物粒径分布的季节特征
王晓宁,田瑛泽*,薛倩倩
(南开大学环境科学与工程学院,国家环境保护城市空气颗粒物污染防治重点实验室,天津 300350)
为探讨采暖季和非采暖季大气颗粒物中有机标识组分的粒径分布特征,识别其来源,于2018年5月至2019年4月在天津采集分粒径颗粒物,利用GC-MS对9个粒径段颗粒物中17种多环芳烃(PAHs)、20种正构烷烃(-Alkanes)和7种藿烷(hopanes)进行分析,并通过有机标识物及特征比值的方法探讨其主要来源.结果表明:非采暖季的四环多环芳烃Pyr、BaA、Chr和五环多环芳烃BbF、BaP呈3峰分布,其余PAHs呈双峰分布,采暖季的低环PAHs呈双峰分布,中高环PAHs近似单峰分布.根据PAHs特征比值发现,非采暖季的燃煤源和交通源是PAHs的主要贡献源,采暖季PAHs受燃煤源的影响更显著.非采暖季的正构烷烃中C29呈单峰分布,C27、C31、C32和C33近似单峰分布,其余正构烷烃呈双峰分布,采暖季的正构烷烃均呈双峰分布.根据正构烷烃碳优势指数(CPI)和主碳峰数(max)发现,人为源是正构烷烃的主要来源,非采暖季受自然源的影响大于采暖季,自然源排放的正构烷烃倾向于富集在粗颗粒物上,人为源排放的正构烷烃则更倾向于富集在细颗粒物上.藿烷在粗粒径段和细粒径段均存在峰值.根据藿烷特征比值发现,非采暖季的藿烷受交通源的影响较大,采暖季的藿烷受燃煤源的影响更显著.
大气颗粒物;有机标识组分;粒径分布;采暖季
有机物是PM的重要组成部分,影响能见度和人体健康[1-2],PM粒径影响其运输、转化、降解以及在呼吸道的沉积[3-5].PM上标识物的粒径分布受来源和大气物理化学过程影响[6-8],并与物质的物理化学性质有关,会随着季节和排放源的变化而改变.
目前国内外已开展了有关有机标识物粒径分布特征的研究[9-11],国内的研究多集中于PAHs和正构烷烃[12-15],如Bi等[3]对广州冬季PM中PAHs和正构烷烃的粒径分布的研究发现,PAHs和正构烷烃主要分布在小于1.5μm的细颗粒物中,低分子量有机物呈双峰分布,高分子量有机物呈单峰分布;Xu等[16]对环巢湖10~12月份PM中正构烷烃粒径分布的研究发现,短链正构烷烃在粗粒径段呈单峰分布,长链正构烷烃呈双峰分布.上述研究采样周期较短,多为秋冬季.有机标识物粒径分布的季节变化方面研究较少,唐小玲[17]对广州PM中烃类化合物粒径分布的研究发现,高温季节的化合物优先富集在细颗粒物,低温季节则向粗颗粒物方向偏移;许绍峰[18]在对北京有机气溶胶的研究中指出有机物的粒径分布特征会受季节和气象条件的影响.
综合分析多类有机标识物粒径分布的季节特征可以为PM来源及污染防治提供更有效的支撑,本研究分析了采样期为1a包含采暖季和非采暖季的大气颗粒物上有机标识物多环芳烃、正构烷烃和藿烷的粒径分布特征,利用有机分子标识物及其特征比值的方法分析不同时期的主导源,并探讨其形成机制,以期为大气污染防治提供科学依据.
1 材料与方法
1.1 样品采集
采样点设置在南开大学津南校区大气环境综合观测站楼顶(38°59′40″N、117°20′6″E).采用安德森八级采样器进行分级采样,采样流量为28.3L/ min,采样滤膜为直径81mm的石英滤膜.采集的粒径范围依次是:>9.0μm,5.8~9.0μm,4.7~5.8μm, 3.3~ 4.7μm, 2.1~3.3μm, 1.1~2.1μm, 0.65~1.1μm, 0.43~ 0.65μm和<0.43μm.采样时间为2018年5月~2019年4月;春夏季采样时间为当日早上09:00~第3日早上08:00,采样累积时长47h;秋冬季采样时间为当日早上09:00~次日早上08:00,采样累积时长23h.依据采样条件将样品分为非采暖季(2018 年5~8月;2019年3月中旬~4月)和采暖季(2018年9月~ 2019年3月中旬).本研究共采集195组分粒径样品,共1755个样品.
1.2 样品分析

将1/2滤膜剪成碎条放入试管中,加入20mL正已烷和二氯甲烷混合溶液(1:1,:),冰浴超声提取2次,每次15min并更换提取试剂,将提取液合并后用0.22μm的滤头过滤,再经过预先活化的固相萃取小柱,经正己烷洗脱后转移至圆底烧瓶在旋转蒸发仪蒸发浓缩至小于5mL后移至KD瓶进行氮吹,吹至约0.5mL,分别加入50uL 5种氘代PAHs内标(2μg/mL)、50μL六甲基苯(2μg/mL)和50uL正二十四烷-d50内标(20μg/mL),用正己烷定容至1mL后,用气相色谱-质谱联用仪(7890B/5977B,安捷伦科技有限公司,美国)分析,测定各有机物的浓度.色谱柱为DB-5MS(30m×0.25mm,0.25mm)石英毛细管柱,载气为氦气,恒定流速为1.0mL/min.质谱离子源为EI源,电离能为70eV.多环芳烃和藿烷的入口和传输线温度分别设置为230℃和280℃,正构烷烃的入口和传输线温度为300℃.
1.3 质量控制
空白石英膜在采样前需要在马弗炉中500℃烘烤2h以去除膜中残留的有机质以减少偏差.所有滤膜在称重前均需在恒温恒湿环境(相对湿度(50±5)%,温度(20±1)℃)下平衡48h,使用精密度为十万分之一的电子天平(XPE105型,瑞士METTLER TOLEDO)进行称重.样品在-20℃冰箱中避光保存.用全过程空白、基质空白和基质加标平行样对数据进行质量控制,以保证实验结果的准确性.分析结果表明全过程空白和基质空白对实验分析的影响可忽略不计. Nap, Any, Ana的回收率低于50%(由于Nap, Any, Ana的回收率较低,所以在此次研究中不予讨论),其余有机化合物的回收率在70 %~130 %.
2 结果与讨论
2.1 多环芳烃质量浓度粒径分布特征
非采暖季∑14PAHs的平均浓度为20.75ng/m3,细粒径段(<2.1μm) ∑14PAHs浓度达12.06ng/m3,占PM10中∑14PAHs的58.12%.采暖季∑14PAHs的平均浓度为38.76ng/m3,细粒径段∑14PAHs的浓度为25.89ng/m3,占PM10中∑14PAHs的66.80%,采暖季细颗粒物中PAHs浓度及占比均有增加, PAHs倾向于富集在细粒径段,这与其他研究一致[4,19].

图1 采暖季和非采暖季多环芳烃的粒径分布
由图1可见,非采暖季的4环多环芳烃Pyr、BaA、Chr和5环多环芳烃BbF、BaP呈现3峰分布模式,峰值分别在0.43~0.65μm、1.1~2.1μm和4.7~5.8μm处,其余PAHs呈双峰分布模式,峰值在0.43~0.65μm和4.7~5.8μm处;采暖季低环(3环) PAHs呈双峰分布模式,中高环(4~6环)PAHs近似单峰分布模式,但中高环PAHs (BkF和DBA除外)在细粒径段的峰值远高于在粗粒径段的峰值.总的来说,随着环数的增加,PAHs呈现由粗模态向细模态偏移的趋势,这主要是因为不同环数PAHs的理化性质不同[20-21].首先,低环PAHs有更高的挥发性,更易从细颗粒物上挥发冷凝到粗颗粒物上[22].此外,有研究表明PAHs的辛醇-水分配系数与分子量呈正相关,低环PAHs相较于中高环PAHs更加亲水.粗颗粒物含水率较大,对低环PAHs有更高的亲合力[23-24].同时,采暖季的4~5环多环芳烃Pyr、BaA、Chr、BbF在细粒径段的峰值从非采暖季0.43~0.65μm偏移增长至0.43~1.1μm,这可能是因为采暖季供热锅炉和散煤燃烧增加,排放源更为复杂[25],排放的细颗粒物粒径范围更宽,且采暖季气温低、光照弱,细颗粒物上的PAHs挥发及光降解作用降低,使PAHs在细粒径段聚集.采暖季的四环PAHs主要分布在0.43~1.1μm粒径段,它们主要来源于燃煤源排放,五六环PAHs主要来源于交通源[26],采暖季外界温度较低,高分子量PAHs排放后难以挥发而富集于细颗粒物中[27-28].
多环芳烃的特征比值如Ant/(Ant+Phe)和IPY/ (IPY+BghiP)经常用于辨别PAHs的来源[16].如图2所示,采暖季及非采暖季各粒径段的Ant/(Ant+Phe)值均大于0.1,说明PAHs主要来自于高温燃烧源[29].特征比值IPY/(IPY+BghiP)的范围0.38~0.74,说明PAHs受到交通源和燃煤源的混合影响[30].采暖季IPY/(IPY+BghiP)比值高于非采暖季,表明燃煤源排放产生的PAHs增加,与上述粒径分布的结果一致.因此PAHs受燃煤源和交通源排放的共同影响,而采暖季的PAHs受燃煤源排放的影响更显著.
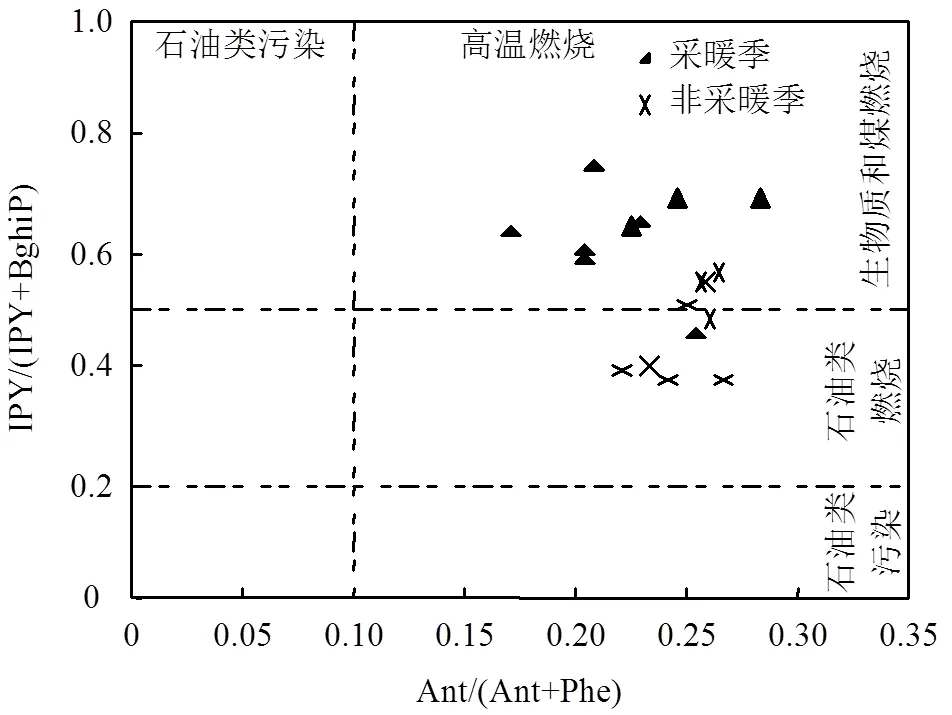
图2 采暖季和非采暖季PAHs的特征比值
2.2 正构烷烃质量浓度粒径分布特征

非采暖季∑20-Alkanes 的平均浓度为2009.65ng/m3,细粒径段浓度为944.87ng/m3,占PM10中∑20-Alkanes的47.01%.采暖季∑20-Alkanes的平均浓度为3610.17ng/m3,细粒径段浓度为1763.43ng/m3,占PM10中∑20-Alkanes的48.84%,浓度和占比均高于非采暖季.由图3可见,采暖季的正构烷烃均呈现明显的双峰分布模式,非采暖季的C29呈粗粒径段单峰分布模式,C27、C31、C32和C33近似粗模态单峰分布模式,其余的正构烷烃均呈现双峰分布模式,峰值分别为细粒径段0.43~ 1.1μm和粗粒径段3.3~5.8μm.对于低碳数正构烷烃,尤其是C14~C20,在采暖季富集于粗颗粒物上的浓度大于细颗粒物,非采暖季则不明显.采暖季燃煤源排放的增加加剧了正构烷烃的排放,此时的气象因素也有利于正构烷烃在颗粒物中的富集,采暖季温度更低,可以使挥发性高一些的正构烷烃挥发后分配到粗颗粒物上的时间缩短[17,31].非采暖季的高碳数奇数正构烷烃C27、C29、C31和C33主要来源于高等植物蜡的排放及花粉孢子等植物源[32],在粗粒径段的浓度远大于采暖季,说明自然源在非采暖季的排放增强,其排放的正构烷烃更倾向于和粗颗粒物结合[33].

图4 采暖季和非采暖季正构烷烃质量浓度分布比较

表1 采暖季和非采暖季不同粒径段正构烷烃的CPI值和主碳峰数

此外,正构烷烃主峰碳数(max)和碳优势指数(carbon preference index, CPI)经常被用于判定正构烷烃的主要来源[34-35],成熟度高的化石燃料具有较低的max和CPI值.由图4和表1可见,采暖季和非采暖季的正构烷烃碳数分布的峰型均是双峰型,采暖季的max为C23和C28,说明化石燃料燃烧是正构烷烃主要的排放源[15];非采暖季正构烷烃的max为C23和C31,分别为交通源和高等植物蜡的主峰碳数[36],说明非采暖季正构烷烃受到人为源和自然源的共同影响.因此,根据主碳峰数可以得出,采暖季的正构烷烃主要来自于人为源,非采暖季的正构烷烃则同时受自然源和人为源的影响.为更好地判断人为源和自然源的影响,采用正构烷烃CPI、CPI1和CPI2来判断来源.从表1可以看出,采暖季和非采暖季的CPI值均接近于1,表明人为源是正构烷烃的主要来源,采暖季的CPI值普遍低于非采暖季,表明采暖季的正构烷烃更多地受到人为源的影响,这与其他研究结果一致[37].细颗粒物上正构烷烃CPI值低于粗颗粒物,说明人为源产生的正构烷烃更倾向于和细颗粒物结合[18].根据CPI1和CPI2可以得出,采暖季化石燃料的燃烧是大气颗粒物中低碳数正构烷烃的主要来源,非采暖季正构烷烃受植物源的影响相对较大,采暖季正构烷烃受植物源的影响较小.非采暖季颗粒物中正构烷烃在粗粒径段的CPI2值范围是1.35~1.90,在细粒径段CPI2值范围是1.06~1.20,可见粗粒径段的CPI2高于细粒径段的CPI2,表明粗模态的颗粒物受植物源排放的影响更大.
2.3 藿烷质量浓度粒径分布特征
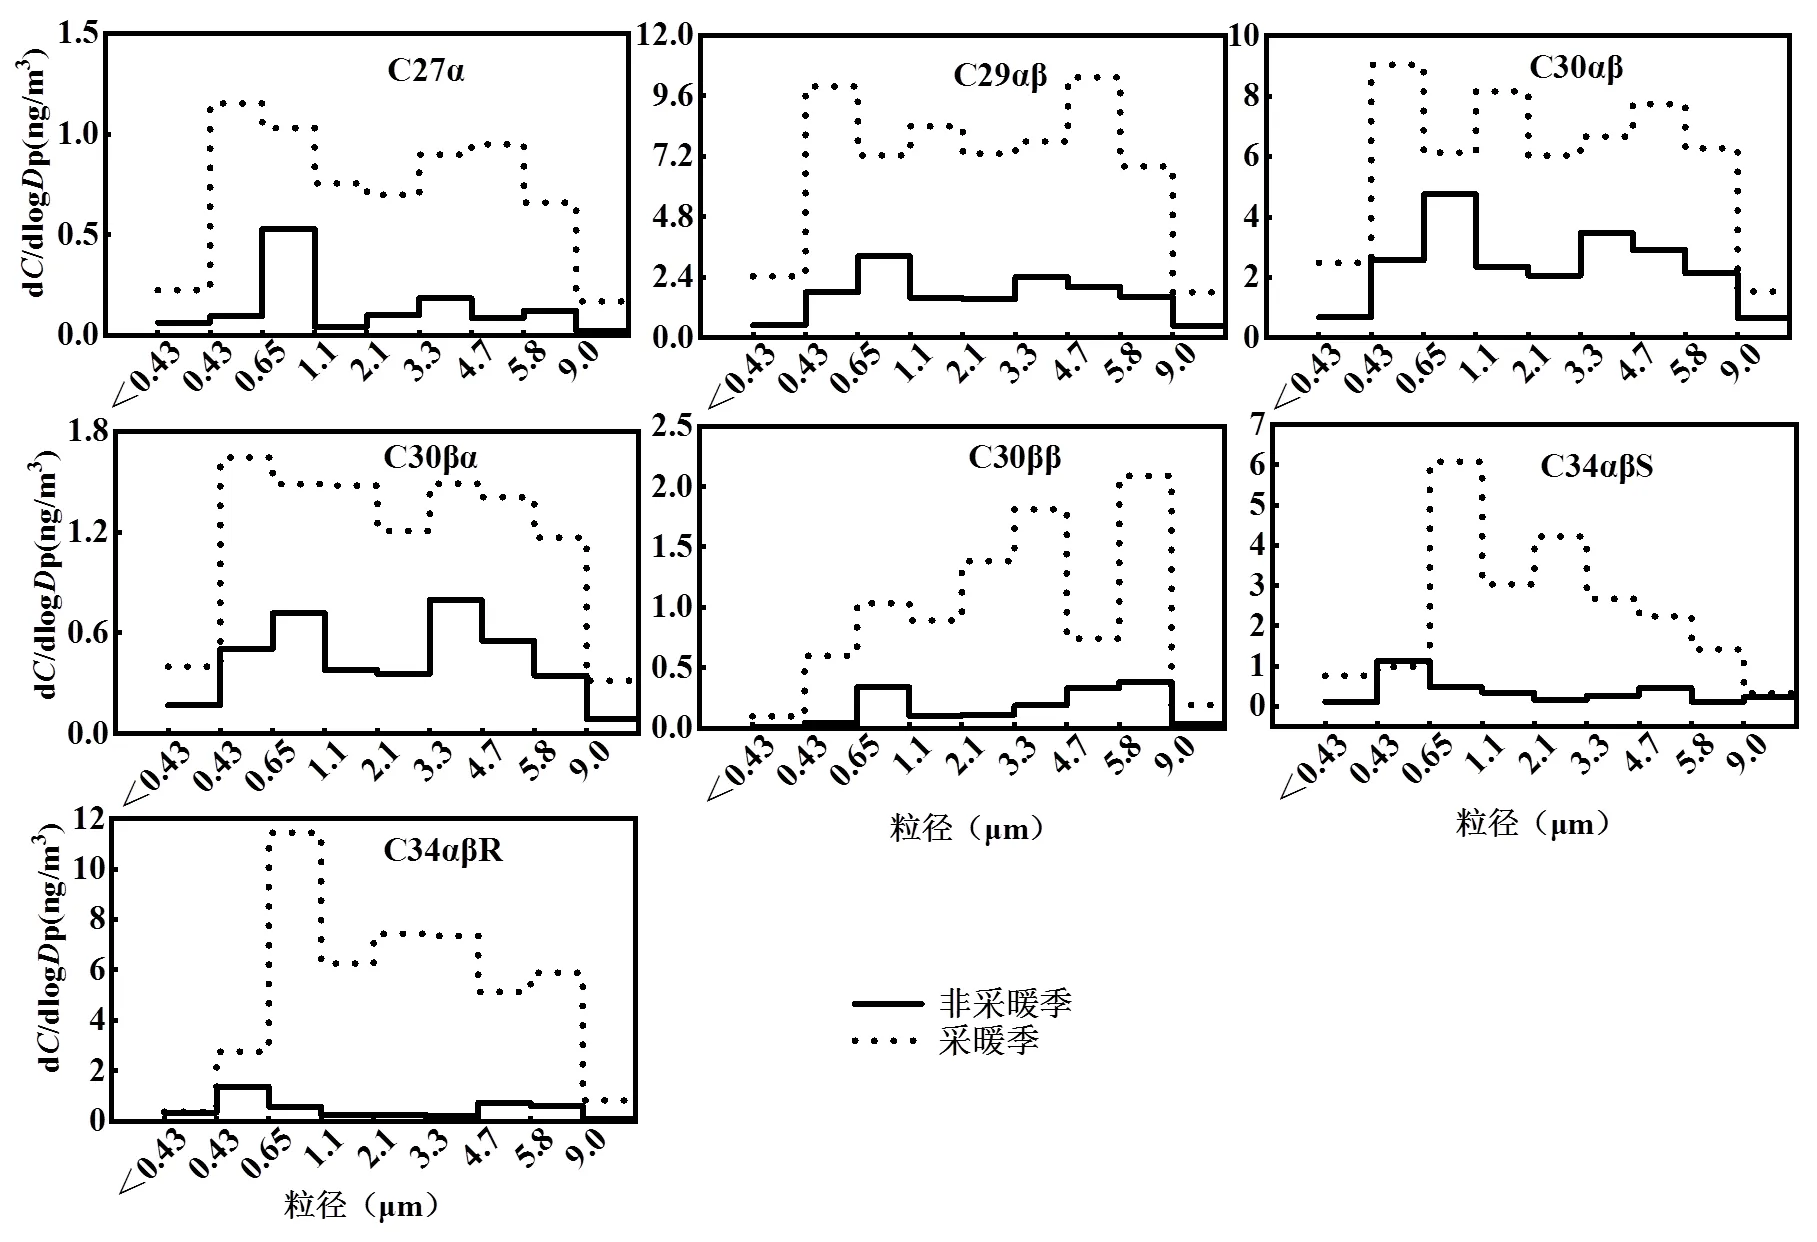
图5 采暖季和非采暖季藿烷的粒径分布
非采暖季∑7hopanes的平均浓度为11.26ng/m3,细粒径段浓度为6.58ng/m3,占PM10中∑7hopanes的58.43%.采暖季的∑7hopanes的平均浓度为45.28ng/m3,细粒径段浓度为24.99ng/m3,占PM10中∑7hopanes的55.19%.采暖季的藿烷浓度明显高于非采暖季,除了采暖季大气层稳定不利于颗粒物扩散外,这主要是因为供暖期燃煤量大大增加所致.由图5可见,非采暖季的藿烷除C27α在细模态有一个峰值、在粗模态有2个峰值外,其他均呈双峰分布模式,采暖季的藿烷没有相似的粒径分布规律,其中C29αβ、C30αβ在细模态有2个峰值、在粗模态有一个峰值,C27α、C30βα、C34αβS呈双峰分布模式,C30ββ和C34αβR则在粗模态有2个峰值、细模态1个峰值.C30ββ和C34αβR被认为是成熟度较低的煤的标识物,主要来源于褐煤和亚烟煤的燃烧[38],因此采暖季成熟度较低的煤的燃烧增加使得粗模态颗粒物藿烷浓度有所增加.对于其他藿烷,在粗粒径段的浓度占比也较高,推断粗模态藿烷可能是道路扬尘和交通源排放的混合物[39].
藿烷特征比值C29αβ/C30αβ和异构化指标C34[/(+)]是判断其来源的重要参数.研究表明C29αβ/C30αβ的比值是0.4时为柴油车排放,0.6~0.7时为汽油车排放[40],0.6~2.0时为燃煤排放[38].在本研究中,采暖季和非采暖季的C29αβ/C30αβ的比值范围分别为0.98~1.34和0.66~0.76(表2),这表明采暖季的藿烷主要来源于燃煤源排放,非采暖季的藿烷可能主要来源于汽油车排放.C34[/(+)]随着燃料成熟度的增加而增加[41],该比值在0.05~0.35时说明颗粒物主要受燃煤源排放影响,大于0.35时标识交通排放[38].本研究中的C34[/(+)]在采暖季全粒径段的比值为0.33,说明藿烷在采暖季受燃煤源排放的影响更为显著,在非采暖季全粒径段比值为0.42,说明藿烷在非采暖季可能受机动车排放源的影响较大.

表2 采暖季和非采暖季藿烷的特征比值
3 结论
3.1 非采暖季的四环多环芳烃Pyr、BaA、Chr和五环多环芳烃BbF、BaP呈现3峰分布模式,峰值在0.43~0.65μm、1.1~2.1μm和4.7~5.8μm处,其余PAHs呈双峰分布模式,峰值在0.43~0.65μm和4.7~5.8μm处,采暖季的低环PAHs呈双峰分布模式,峰值分别在0.43~1.1μm和4.7~5.8μm,中高环PAHs近似单峰分布模式,高环PAHs在细粒径段的峰值远高于在粗粒径段的峰值.采暖季燃煤源排放增加使得细模态四环PAHs浓度急剧增加.通过PAHs特征比值Ant/(Ant+Phe)和IPY/(IPY+BghiP)得出非采暖季的PAHs主要来源于燃煤源排放和交通源排放,而非采暖季的PAHs受燃煤源的影响较为显著.
3.2 采暖季的正构烷烃呈现稳定的双峰分布模式, 峰值分别在0.43~1.1μm和3.3~5.8μm,非采暖季C29呈单峰分布模式,峰值在3.3~5.8μm,C27、C31、C32和C33近似单峰分布模式,其余的正构烷烃均呈现明显的双峰分布模式.采暖季的正构烷烃在全粒径段的浓度均高于非采暖季.采暖季和非采暖季正构烷烃的CPI值分别为0.75和1.23,均接近1,说明人为源是正构烷烃的主要来源,非采暖季受自然源的影响大于采暖季,自然源排放的正构烷烃易于富集在粗颗粒物上,人为源排放的正构烷烃更倾向于富集在细颗粒物上.
3.3 藿烷在粗粒径段和细粒径段均有峰.采暖季的藿烷浓度明显高于非采暖季,受到秋冬季气温低、大气层稳定的气象因素和燃煤源排放增加的共同影响.采暖季的C29αβ/C30αβ和C34[/(+)]分别为1.12和0.33,非采暖季的C29αβ/C30αβ和C34[/(+)]分别为0.70和0.42,说明非采暖季的藿烷受交通源影响较大,采暖季的藿烷受燃煤源排放的影响显著,采暖季成熟度较低的煤的燃烧增加导致部分藿烷在粗模态的浓度升高.
[1] Li Y G, Huang H X H, Griffith S M, et al. Quantifying the relationship between visibility degradation and PM2.5constituents at a suburban site in Hong Kong: Differentiating contributions from hydrophilic and hydrophobic organic compounds [J]. Science of the Total Environment, 2017,575:1571-1581.
[2] Yang L, Zhang H, Zhang X,et al. Exposure to atmospheric particulate matter-bound polycyclic aromatic hydrocarbons and their health effects: A review [J]. Journal of Environmental Research and Public Health, 2021,18(4).
[3] Bi X, Sheng G, Peng P A,et al. Size distribution of-alkanes and polycyclic aromatic hydrocarbons (PAHs) in urban and rural atmospheres of Guangzhou, China [J]. Atmospheric Environment, 2005,39(3):477-487.
[4] Lv Y, Li X, Xu T T,et al. Size distributions of polycyclic aromatic hydrocarbons in urban atmosphere: sorption mechanism and source contributions to respiratory deposition [J]. Atmospheric Chemistry and Physics, 2016,16:2971-2983.
[5] 翟宇虹,黄晓锋,张 丽,等.深圳大气气溶胶中水溶性有机物粒径分布特征 [J]. 中国环境科学, 2015,35(11):3211-3216.
Zhai Y H, Huang X F, Zhang L, et al. Size distribution characteristics of water-soluble organic matter in atmospheric aerosol in Shenzhen, China [J]. China Environmental Science, 2015,35(11):3211-3216.
[6] 刘 臻,祁建华,王 琳,等.青岛大气气溶胶水溶性无机离子的粒径分布特征 [J]. 中国环境科学, 2012,32(8):1422-1432.
Liu Z, Qi J H, Wang L, et al. Particle size distribution of water-soluble inorganic ions of atmospheric aerosol in Qingdao [J]. China Environmental Science, 2012,32(8):1422-1432.
[7] 郝 娇,葛 颖,何书言,等.南京市秋季大气颗粒物中金属元素的粒径分布 [J]. 中国环境科学, 2018,38(12):4409-4414.
Hao J, Ge Y, He S Y, et al. Size distribution characteristics of metal elements in air particulate matter during autumn in Nanjing [J]. China Environmental Science, 2018,38(12):4409-4414.
[8] 于广河,曹礼明,朱 乔,等.深圳大气有机硝酸酯粒径分布特征和来源研究 [J]. 中国环境科学, 2022,42(4):1510-1517.
Yu G H, Cao L M, Zhu Q, et al. Sizing and source characterization of particulate organic nitrates based on long time-of-flight aerosol mass spectrometer (Long-ToF-AMS) [J]. China Environmental Science, 2022,42(4):1510-1517.
[9] Kang M J, Fu P Q, Aggarwal S G, et al. Size distributions of-alkanes, fatty acids and fatty alcohols in springtime aerosols from New Delhi, India [J]. Environmental Pollution, 2016,219:957-966.
[10] Mirante F, Alves C, Pio C,et al. Organic composition of size segregated atmospheric particulate matter, during summer and winter sampling campaigns at representative sites in Madrid, Spain [J]. Atmospheric Research, 2013,132-133:345-361.
[11] Offenberg J H, Baker J E. Aerosol size distributions of polycyclic aromatic hydrocarbons in urban and over-water atmospheres [J]. Environmental Science & Technology, 1999,33(19):3324-3331.
[12] Zhang J D, Liu W J, Xu Y S,et al. Distribution characteristics of and personal exposure with polycyclic aromatic hydrocarbons and particulate matter in indoor and outdoor air of rural households in Northern China [J]. Environmental Pollution, 2019,255:113176.
[13] Wang G, Kawamura K, Mingjie X I E, et al. Organic molecular compositions and size distributions of Chinese summer and autumn aerosols from Nanjing: Characteristic haze event caused by wheat straw burning [J]. Environmental Science & Technology, 2009,43 (17):6493-6499.
[14] Yu Q, Ding X, He Q,et al. Nationwide increase of polycyclic aromatic hydrocarbons in ultrafine particles during winter over China revealed by size-segregated measurements [J]. Atmospheric Chemistry and Physics, 2020,20:14581-14595.
[15] Lyu Y, Xu T T, Yang X,et al. Seasonal contributions to size-resolved-alkanes (C8–C40) in the Shanghai atmosphere from regional anthropogenic activities and terrestrial plant waxes [J]. Science of the Total Environment, 2017,579:1918-1928.
[16] Xu Q P, Wang J Z, Liu J Q,et al. Particulate size distribution and sources evaluation of-alkanes during long-term haze episode around Chaohu Lake, eastern [J]. Aerosol and Air Quality Research, 2017, 17(8):1975-1984.
[17] 唐小玲.广州市典型地区气溶胶中烃类化合物的粒径分布特征及极性组分的分子标志物研究 [D]. 北京:中国科学院研究生院, 2006.
Tang X L. Size distribution of-alkanes and polycyclic aromatic hydrocarbons and molecular marker in polar portion in aerosol from typical area of Guangzhou [D]. Beijing: Institue of Earth Environment, Chinese Academy of Sciences, 2006.
[18] 许绍锋.北京市大气中有机气溶胶的分子组成、粒径分布及季节性变化 [D]. 天津:天津大学, 2019.
Xu S F. Molecular composition, size distributions and seasonal variation of urban organic aerosols in Beijing [D]. Tianjin: Tianjin University, 2019.
[19] Wu S P, Tao S, Liu W X. Particle size distributions of polycyclic aromatic hydrocarbons in rural and urban atmosphere of Tianjin, China [J]. Chemosphere, 2006,62(3):357-367.
[20] Khalili N R, Scheff P A, Holsen T M. PAH source fingerprints for coke ovens, diesel and gasoline engines, highway tunnels, and wood combustion emissions [J]. Atmospheric Environment, 1995,29(4):533- 542.
[21] Zhang Y X, Dou H, Chang B,et al. Emission of polycyclic aromatic hydrocarbons from indoor straw burning and emission inventory updating in China [J]. Annals of the New York Academy of Sciences, 2008,1140:218-227.
[22] Kiss G, Varga-Puchony Z, Rohrbacher G,et al. Distribution of polycyclic aromatic hydrocarbons on atmospheric aerosol particles of different sizes [J]. Atmospheric Research, 1998,46(3):253-261.
[23] Allen J O, Dookeran N M. Measurement of polycyclic aromatic hydrocarbons associated with size-segregated atmospheric aerosols in Massachusetts [J]. Environmental Science & Technology, 1996,30(3): 1023-1031.
[24] Zhang L L, Yang L, Zhou Q Y,et al. Size distribution of particulate polycyclic aromatic hydrocarbons in fresh combustion smoke and ambient air: A review [J]. Journal of Environmental Sciences, 2020, 88:370-384.
[25] Tian S L, Pan Y P, Wang Y S. Size-resolved source apportionment of particulate matter in urban Beijing during haze and non-haze episodes [J]. Atmospheric Chemistry and Physics, 2016,16:1-19.
[26] Hien T T, Le T T, Kameda T,et al. Distribution characteristics of polycyclic aromatic hydrocarbons with particle size in urban aerosols at the roadside in Ho Chi Minh City, Vietnam [J]. Atmospheric Environment, 2007,41(8):1575-1586.
[27] Wang R W, Huang Q, Cai J W,et al. Seasonal variations of atmospheric polycyclic aromatic hydrocarbons (PAHs) surrounding Chaohu Lake, China: Source, partitioning behavior, and lung cancer risk [J]. Atmospheric Pollution Research, 2021,12(5):101056.
[28] Yu H, Yu J Z. Polycyclic aromatic hydrocarbons in urban atmosphere of Guangzhou, China: Size distribution characteristics and size- resolved gas-particle partitioning [J]. Atmospheric Environment, 2012, 54:194-200.
[29] Han D M, Fu Q Y, Gao S,et al. Non-polar organic compounds in aerosols in a typical city of Eastern China: Size distribution, gas-particle partitioning andtracer for PM2.5source apportionment [J]. Atmospheric Chemistry and Physics, 2018:1-27.
[30] Grimmer G, Jacob J, Naujack K W,et al. Profile of the polycyclic aromatic hydrocarbons from used engine oil — inventory by GCGC/MS — PAH in environmental materials, Part 2 [J]. Fresenius' Zeitschrift für analytische Chemie, 1981,309(1):13-19.
[31] Aceves M, Grimalt J O. Seasonally dependent size distributions of aliphatic and polycyclic aromatic hydrocarbons in urban aerosols from densely populated areas [J]. Environmental Science & Technology, 1993,27(13):2896-2908.
[32] Lin L, Lee M L, Eatough D J. Review of recent advances in detection of organic markers in fine particulate matter and their use for source apportionment [J]. Journal of the Air & Waste Management Association, 2010,60(1):3-25.
[33] 唐小玲,毕新慧,陈颖军,等.广州市空气颗粒物中烃类物质的粒径分布 [J]. 地球化学, 2005,34(5):508-514.
Tang X L, Bi X H, Chen Y J, et al. Size distribution of-alkanes and polycyclic aromatic hydrocarbons (PAHs) in urban aerosol of Guangzhou [J]. Geochemica, 2005,34(5):508-514.
[34] Simoneit B. Organic matter of the troposphere — V: Application of molecular marker analysis to biogenic emissions into the troposphere for source reconciliations [J]. Journal of Atmospheric Chemistry, 1989,8(3):251-275.
[35] Wang Z, An Z, Gao S,et al. Size-distributions of-alkanes, PAHs and hopanes and their sources in the urban, mountain and marine atmospheres over East Asia [J]. Atmospheric Chemistry and Physics, 2009,9(22):8869-8882.
[36] Hao Z, Hopke P K, Zhou C,et al. Ambient mercury source identification at a New York State urban site: Rochester, NY [J]. Science of the Total Environment, 2018,650:1327-1337.
[37] 范艳兵.天津市大气有机气溶胶的分子组成、季节变化及来源分析 [D]. 天津大学, 2019.
Fan Y B. Sources, Molecular composition and seasonal variation in organic aerosols in Tianjin City, North China [D]. Tianjin University, 2019.
[38] Oros D R, Simoneit B R T. Identification and emission rates of molecular tracers in coal smoke particulate matter [J]. Fuel, 2000, 79(5):515-536.
[39] Huang X F, Chen D L, Lan Z J,et al. Characterization of organic aerosol in fine particles in a mega-city of South China: Molecular composition, seasonal variation, and size distribution [J]. Atmospheric Research, 2012,114(15):28-37.
[40] Rogge W F, Hildemann L M, Mazurek M A,et al. Sources of fine organic aerosol. 2. Noncatalyst and catalyst-equipped automobiles and heavy-duty diesel trucks [J]. Environmental Science & Technology, 1993,27(4):636-651.
[41] Phuleria H, Geller M, Fine P,et al. Size-resolved emissions of organic tracers from light-and heavy-duty vehicles measured in a California roadway tunnel [J]. Environmental Science & Technology, 2006, 40(13):4109-4118.
Distribution characteristics of organic markers in particulate matter with different sizes during different seasons in Tianjin.
WANG Xiao-ning, TIAN Ying-ze*, XUE Qian-qian
(State Environmental Protection Key Laboratory of Urban Ambient Air Particulate Matter Pollution Prevention and Control, College of Environmental Science and Engineering, Nankai University, Tianjin 300350, China). China Environmental Science, 2022,42(11):4974~4982
In order to study the distribution characteristics of organic markers in particulate matter with different sizes during the heating and non-heating period, and identify their pollution sources, the Anderson eight-stage sampler was used to collect one-year samples from May 2018 to April 2019. 17 kinds of polycyclic aromatic hydrocarbons(PAHs), 20kinds of-Alkanes and 7kinds of hopanes in 9particle size segments were analyzed and the main sources of particulate matter were identified by molecular markers and diagnostic ratios. The results showed the 4~5rings PAHs Pyr, BaA, Chr, BbF and BaP showed a three-peak distribution and the rest of the PAHs showed a bimodal distribution during the non-heating period, and 3rings PAHs showed a bimodal distribution and 4~6rings PAHs showed a approximately unimodal distribution during the heating period. The diagnostic ratios of PAHs indicated that vehicle emissions and coal combustion were the main contributors of PAHs during the non-heating period and the coal combustion was the main contributors of PAHs during the heating period. The-Alkanes showed a stable bimodal size distribution during the heating period and C29 showed a unimodal distribution, C27, C31, C32 and C33 showed approximately a unimodal distribution, with the remaining-Alkanes in a bimodal distribution during the non-heating period. According to the CPI andmax, it is found that anthropogenic sources were the main source of-Alkanes during the non-heating period and the heating period. The concentration of high molecular weight-Alkanes was better influenced by natural sources during the non-heating period than during the heating period. In addition,-Alkanes emitted from natural sources were easy to concentrate in coarser particulates, and-Alkanes from anthropogenic sources were more likely to concentrate in the finer particles. The hopanes had peaks in both coarse and fine particle modes during two seasons. Traffic was proposed as the main emission source of hopanes during the non-heating period, and the hopanes mainly originated from coal combustion during the heating period.
atmospheric particulate matter;organic markers;size distribution;the heating period
X511
A
1000-6923(2022)11-4974-09
王晓宁(1997-),女,山东聊城人,南开大学硕士研究生,研究方向为大气污染防治.
2022-04-11
国家自然科学基金(41977181);中国工程院院地合作项目(2020C0-0002)
* 责任作者, 副研究员,tianyingze@hotmail.com
猜你喜欢
润滑油(2022年4期)2022-09-16
纺织标准与质量(2022年3期)2022-08-10
电力科技与环保(2022年3期)2022-07-15
能源工程(2022年2期)2022-05-23
中国环境科学(2019年5期)2019-06-06
石油石化绿色低碳(2019年6期)2019-01-14
教学考试(高考化学)(2017年3期)2017-08-08
通信电源技术(2016年3期)2016-03-26
中国资源综合利用(2016年1期)2016-02-03
中国石油大学学报(自然科学版)(2015年2期)2015-11-10