
Differentiate Xp11.2 Translocation Renal Cell Carcinoma from Computed Tomography Images and Clinical Data with ResNet-18 CNN and XGBoost
2023-02-17 03:12YanwenLuWenliangMaXiangDongMackenzieBrownTongLuandWeidongGan
Yanwen Lu,Wenliang Ma,Xiang Dong,Mackenzie Brown,Tong Luand Weidong Gan
1Department of Urology,Nanjing Drum Tower Hospital,The Affiliated Hospital of Nanjing University Medical School,Nanjing,210008,China
2School of Data Science,Perdana University,Serdang,43400,Malaysia
3State Key Laboratory for Novel Software Technology,Nanjing University,Nanjing,210008,China
ABSTRACT This study aims to apply ResNet-18 convolutional neural network(CNN)and XGBoost to preoperative computed tomography(CT)images and clinical data for distinguishing Xp11.2 translocation renal cell carcinoma(Xp11.2 tRCC) from common subtypes of renal cell carcinoma (RCC) in order to provide patients with individualized treatment plans.Data from 45 patients with Xp11.2 tRCC from January 2007 to December 2021 are collected.Clear cell RCC(ccRCC),papillary RCC(pRCC),or chromophobe RCC(chRCC)can be detected from each patient.CT images are acquired in the following three phases:unenhanced,corticomedullary,and nephrographic.A unified framework is proposed for the classification of renal masses.In this framework,ResNet-18 CNN is employed to classify renal cancers with CT images,while XGBoost is adopted with clinical data.Experiments demonstrate that,if applying ResNet-18 CNN or XGBoost singly,the latter outperforms the former,while the framework integrating both technologies performs similarly or better than urologists.Especially,the possibility of misclassifying Xp11.2 tRCC,pRCC,and chRCC as ccRCC by the proposed framework is much lower than urologists.
KEYWORDS ResNet-18 CNN;XGBoost;computed tomography;TFE3;renal cell carcinoma
1 Introduction
Renal cell carcinoma (RCC) is the most common subtype of primary renal cancer, accounting for 80%-90% of renal malignancies [1]. Clear cell renal cell carcinoma (ccRCC), papillary renal cell carcinoma(pRCC),and chromophobe renal cell carcinoma(chRCC)are common subtypes of renal cancer, accounting for 70%, 15%-20%, and 6%-11% of all renal cancers, respectively [2-4]. Xp11.2 translocation renal cell carcinoma (Xp11.2 tRCC) is an independent and rare subtype of RCCs,formed by the balanced translocation of theTFE3gene on the short arm of the X chromosome and other genes, accompanied by the overexpression of TFE3 protein [5]. Xp11.2 tRCC and RCC associated with t (6; 11)/TFEBgene fusions were classified as MiT family translocation RCC in the 2016 World Health Organization kidney tumor classification scheme[6].Recent studies have reported that Xp11.2 tRCC was more aggressive than ccRCC in adult patients[7,8].Due to the aggressive nature of Xp11.2 tRCC,adult patients with strong positive expression of TFE3 protein tend to have a worse prognosis than patients with TFE3-negative RCC, namely ccRCC, pRCC, and chRCC. In addition,the 2019 European Urological Association guidelines strongly recommended nephron-sparing surgery for clinical stage T1 renal cancer.However,multi-center clinical studies have shown that Xp11.2 tRCC patients who undergo nephron-sparing surgery at clinical stage T1b are more likely to suffer disease progression than radical nephrectomy [9,10]. The treatment for Xp11.2 tRCC should be different from common subtypes of RCCs when the surgical plan is selected for the first time.However,there is still a lack of effective preoperative diagnosis in differentiating Xp11.2 tRCC from three main subtypes of RCCs.Therefore,accurate preoperative prediction of Xp11.2 tRCC is essential to realize the individualized surgical plan for patients.
Artificial intelligence (AI) for image classification through deep learning (DL) models and machine learning(ML)has been established in health and medicine and achieved rapid development.The diagnostic performance of AI technology in several diseases has exceeded those of manual methods with advantages of automated quantitative evaluation,low error probability,and consistent and stable diagnosis results [11-14]. In recent years, the applications of ML and DL in urology increased and succeeded in image recognition diagnostics,personalized medicine,and clinical decisionmaking,and the development of AI technology will further improve disease prediction accuracy and promote precision medicine[15-18].The deep neural network model trained and tested by histopathological images can automatically differentiate Xp11.2 tRCC and ccRCC with high performance[19],simplifying the traditional pathological diagnosis model of Xp11.2 tRCC.However,the pathological diagnosis was performed by pathologists or AI technology after surgery, which cannot meet the urgent clinical needs of preoperative diagnosis. Therefore, the development of a DL neural network model based on preoperative abdominal computed tomography(CT)scan to assist in the differential diagnosis of Xp11.2 tRCC has greater clinical significance and practical value.
In this study, we proposed an AI model based on preoperative CT images and clinical data to distinguish between Xp11.2 tRCC and common subtypes of renal cancer and then provided patients with individualized treatment plans.
2 Materials and Methods
2.1 Patient Enrollment
The complete CT imaging data and postoperative pathological data of patients with Xp11.2 tRCC diagnosed in the Nanjing Drum Tower Hospital were retrospectively analyzed from January 2007 to December 2021.45 cases of Xp11.2 tRCC with complete clinicopathological data were enrolled in the study, including complete medical histories, clinical information, and pathological data. According to both tumor size and pathological stage,the matched patients included 45 with ccRCC,pRCC,or chRCC, respectively. The study was approved by the Institutional Review Board of Nanjing Drum Tower Hospital.
Whilst he was an old and tried servant of the king s, his wife had been almost a mother to the young princess ever since the queen had died some years before
Inclusion criteria:
1. Patients underwent radical or partial nephrectomy.
Next Thursday evening the White Bear came to fetch her.18 She seated herself on his back with her bundle,19 and thus they departed. When they had gone a great part of the way, the White Bear said: Are you afraid? 20
The young man was led into the presence of the Iron King, who was seated on a black throne in a hall also hung with black, as a token of mourning for all the relations whom he had put to death
2. Preoperative CT examination of renal tumors and complete examination records.
3. The reviewed pathological diagnosis was consistent with the initial postoperative diagnosis and the pathological diagnosis of Xp11.2 tRCC was validated by the next generation sequence.
4. These patients were without cardiovascular and cerebrovascular diseases and chronic kidney disease that affected the blood supply of the kidney.
5. These patients had a unilateral single renal tumor.
Exclusion criteria:
1. Incomplete clinical and CT imaging data.
We used XGBoost to classify clinical data.XGBoost is a variant of random forest,which is widely used for the mining of structured data. Different from the random forest, XGBoost first builds all the subtrees that can be established from top to bottom and then reversely prunes from the bottom to the top to avoid the model from falling into the optimal local solution. For clinical data, it only contained 7 fields,and each decision tree of XGBoost randomly discarded some fields,so XGBoost with a maximum depth of 3 was enough to cover all fields.For each case,we got the corresponding probabilities of the four tumors.The process was represented as follows:
8. Grandmother, what big arms you have! : These exclamations23 are a favorite story element for tellers24 and listeners. They are an excellent storybuilding tool, creating anticipation25 and horror for the listener/reader as Little Red Riding Hood realizes she is not talking to her grandmother. Many oral versions of the story add extra body parts to increase the bawdiness26 of the story. The list inevitably27 ends with the teeth however.
We screened all RCC patients treated in Nanjing Drum Tower Hospital from January 2007 to December 2021 and collected 45 cases of Xp11.2 tRCC with complete clinicopathological data,which included complete medical histories,clinical information,and pathological data.The matched patients included 45 with ccRCC,pRCC,or chRCC,respectively.The clinicopathologic characteristics of the entire cohort were displayed in Table 1. The mean age of Xp11.2 tRCC patients was 36.40±13.44 years(range 21-71 years),and young female patients were more common in Xp11.2 tRCC.Conversely,ccRCC, pRCC, and chRCC affected older men more frequently. The mean diameter of the lesion for Xp11.2 tRCC patients was 4.70±3.23 cm, and there was no significant difference in tumor size between Xp11.2 tRCC and the three main RCCs. The clinicopathologic records, such as hematuria,lumbago, abdominal mass, hypertension, and hyperuricemia, were retrospectively investigated and listed as categorical variables in the models. Patient demographics and kidney cancer subtypes distributions for training or testing set were summarized in Table 2. Thirty-seven cases with three CT phases were randomly selected to test these models,and the remaining cases were performed on the training test.The mean tumor size and kidney cancer subtypes distributions were not significantly different between the training and testing sets.The age and gender distribution in the training or testing set were consistent with the entire cohort.
There, in the very place they had chosen, stood a beautiful house--doors and windows, and everything all complete! Now you must fix on a spot for your cow-stalls, said the girl, when they had breakfasted off wild cherries; and take care it is the proper size, neither too large nor too small
4. These patients had multiple renal tumors.
2.2 CT Technical Parameters and Image Preprocessing
All patients in our hospital used 64-slice CT (Light-Speed; GE Healthcare, Princeton, NJ,USA) for CT examination. In each case, images inputted into the model were acquired at three phases, including unenhanced, corticomedullary, and nephrographic phases. Both corticomedullary and nephrographic phases were included in the enhanced phase.Most of the image layer thicknesses in the unenhanced phase were 5 and 10 mm,and the image layer thicknesses in the corticomedullary and nephrographic phases were 1 and 6 mm.We exported anonymous images in digital imaging and communication in medicine (DICOM) format from Picture Archiving and Communication System(PACS) for each patient. We manually segmented the kidney cancer area in each CT image and removed the segmented non-tumor area using MATLAB software (MATLAB R2016a). The CT images in the folder were automatically read,manually scribed by two experienced urologists,executed the segmentation algorithm,removed the background,and automatically saved the segmented tumor image according to the original path. The procedure of segmentation is shown in Figs.1 and 2. In order to ensure that all kidney cancers were in the segmentation area,we set the mouse click position 2 mm within the edge of the tumor to ensure the accuracy of the segmentation image. Since the boundaries of the renal tumors in the unenhanced CT images were difficult to distinguish from the normal kidney tissue,we decided to use the enhanced image to assist the segmentation.For ambiguous cases,determining the boundaries of renal cancers were jointly determined by two urologists with more than 10 years of work experience.

Figure 1: Flowchart illustrating the design of the research. The ResNet-18 CNN model took image patches of renal tumor extracted from a multi-phase CT scan as an input.The Clinical data was applied to train and test the XGBoost model. The fusion model was constructed from the ResNet-18 CNN combined with the XGBoost model and compared with urologists in predictive performance

Figure 2:Representative axial CT images of delineating and extracting renal tumor in Xp11.2 tRCC(a),ccRCC(b),pRCC(c),chRCC(d):unenhanced phase,corticomedullary phase,and nephrographic phase were used as the input data of the model,respectively.For every single renal cancer subtype,the left was the original CT axial image,the middle was the segmented image of the kidney tumor,and the right was the kidney tumor after removing the non-tumor area
2.3 Clinical Data Preprocessing
Since the clinical data of patients was an essential basis for differentiating Xp11.2 tRCC from the common subtypes of RCCs, we inputted the clinical data of patients into the model, including age,gender, tumor size, hypertension, hematuria, hyperuricemia, abdominal pain, and abdominal mass.Among them,age data was converted into integer type,and the rest of the clinical data was represented by 1 for yes and 0 for no.
2.4 Model
In the inference, we use the fusion method mentioned in Section 2.4.3 to fuse the CT images probability and fuse with the probability of XGBoost to get the final result.
2.4.1 ResNet-18 Convolutional Neural Network
We used deep convolutional neural networks (CNN) to classify CT image data, of which we chose ResNet-18 CNN to extract image features and used Softmax for four-classification. ResNet-18 CNN was formed by stacking a series of convolutional blocks with shortcuts, with different suffixes depending on the number of convolutional layers.ResNet-18 CNN indicated that this network consisted of 18 convolutional layers.At the end of the network,the activation layer Softmax directly gave the probability of each renal cell carcinoma. For each patient, we had the CT image sequence{Su,Sc,Sn} for its three phases, namely unenhanced, corticomedullary, and nephrographic, whereS= {st|t= 1,2,...,T},Tindicated the total number of slices. For each slice, we used ResNet-18 CNN to extract features and use Softmax to classify the features into four categories to obtain the probabilitiespt,wherePt= {pt1,pt2,pt3,pt4}andpindicated the probability that the slice belonged to the corresponding category.This process can be formulated as follows:
Suddenly, it dawned on me that I was dog-tired. I simply couldn t work as long as I could when I was younger. I ve got to rest for a minute, I told my husband, Roy, as I collapsed2 into my favorite rocking chair. Music was playing, my dog and cat were chasing each other and the telephone rang.

Since slices at different positions of the renal cell carcinoma had different contributions to distinguishing tumor types, the closer to the center, the stronger the degree of discrimination,so we used the normal distribution function to calculate the fusion weight of each image.For thei-th slice,we defined its weight as:
On the days when it was Ronny’s turn, I’d give him a silent nod, and he’d fly out of his chair and bound across the room in a blink. He sat awfully12 close -- too close for me in the beginning, I must admit -- and opened the book we were tackling as if he were unearthing13 a treasure the world had never seen.

Therefore,the classification result of each phase can be formulated as follows:
And as she had walked the whole day and not eaten one mouthful, and hunger tormented12 her, she thought, Ah, if I were but inside, that I might eat of the fruit, else must I die of hunger! Then she knelt down, called on God the Lord, and prayed

Clinical experience showed that the reliability of CT at different phases varies widely. The reliability of unenhanced, corticomedullary, and nephrographic renal CT increased sequentially.Therefore,we empirically set the phases of unenhanced,corticomedullary,and nephrographic weights to be 0.2,0.3,and 0.5 in the three phases fusion step.

2.4.2 XGBoost
Every trade was located in the basement of the houses or inthe side thoroughfares; and the sun shone with such heat, and theair was so close, that one seemed to be in an oven full of beetles,cockchafers, bees and flies, all humming and buzzing together
2. After reviewing the pathological diagnosis, it was inconsistent with the initial pathological diagnosis.

2.4.3 Fusion
Considering the importance of CT images and clinical data for the judgment of renal cancer types,we added the results of CNN and the results of XGBoost to obtain the final probability.

2.5 Training and Inference
2.5.1 Training
For CT images,we train each image separately.We use the ResNet-18 pre-trained on ImageNet[20]as the backbone.All cropped CT images are resized to 224×224 with the randomized horizontal flip data augmentation.We use SGD as the optimizer with a weight decay of 0.0001 and a momentum of 0.9 and set the batch size to 256.The model is trained for 30 epochs.The learning rate is set as 0.01 and divided by 10 at epochs 15 and 25.For clinical data,we set the learning rate of XGBoost to 0.1,the number of estimators to 100,and the maximum depth to 3.
He saw nothing for it but to submit to some horrible death, but he determined that the Iron King should not profit more than he could help, and flung his precious thread into the air, saying, as he did so, O fairy, my misfortunes are greater than your power
2.5.2 Inference
Our model consisted of two modules: a CT image classifier and a clinical data classifier. Both modules operated in parallel.First,each patient’s CT images and clinical data were input into a CT image classifier and a clinical data classifier,respectively.Then,each of the two classifiers classified the data and outputted the probability of the type of renal cancer.Finally,the results of the two classifiers were fused to obtain the final predicted probability of kidney tumor.
2.6 Statistical Analysis
We used a permutation test to compare the performance of the ensemble model with that of the urologists.Specifically,we randomly sampled 35 times from 45 patients with replacement to obtain 35 bootstrap samples and then calculated sensitivity,specificity,accuracy,and AUCs for these 35 samples,respectively.This process was repeated 100 times to generate the distribution of sensitivity,specificity,accuracy,and AUCs,and then the mean and 95 confidence intervals(CI)were calculated.
3 Results
3.1 Patients and Lesion Features
3. These patients had cardiovascular and cerebrovascular diseases, chronic kidney disease, and other diseases which affected the blood supply of the kidney.
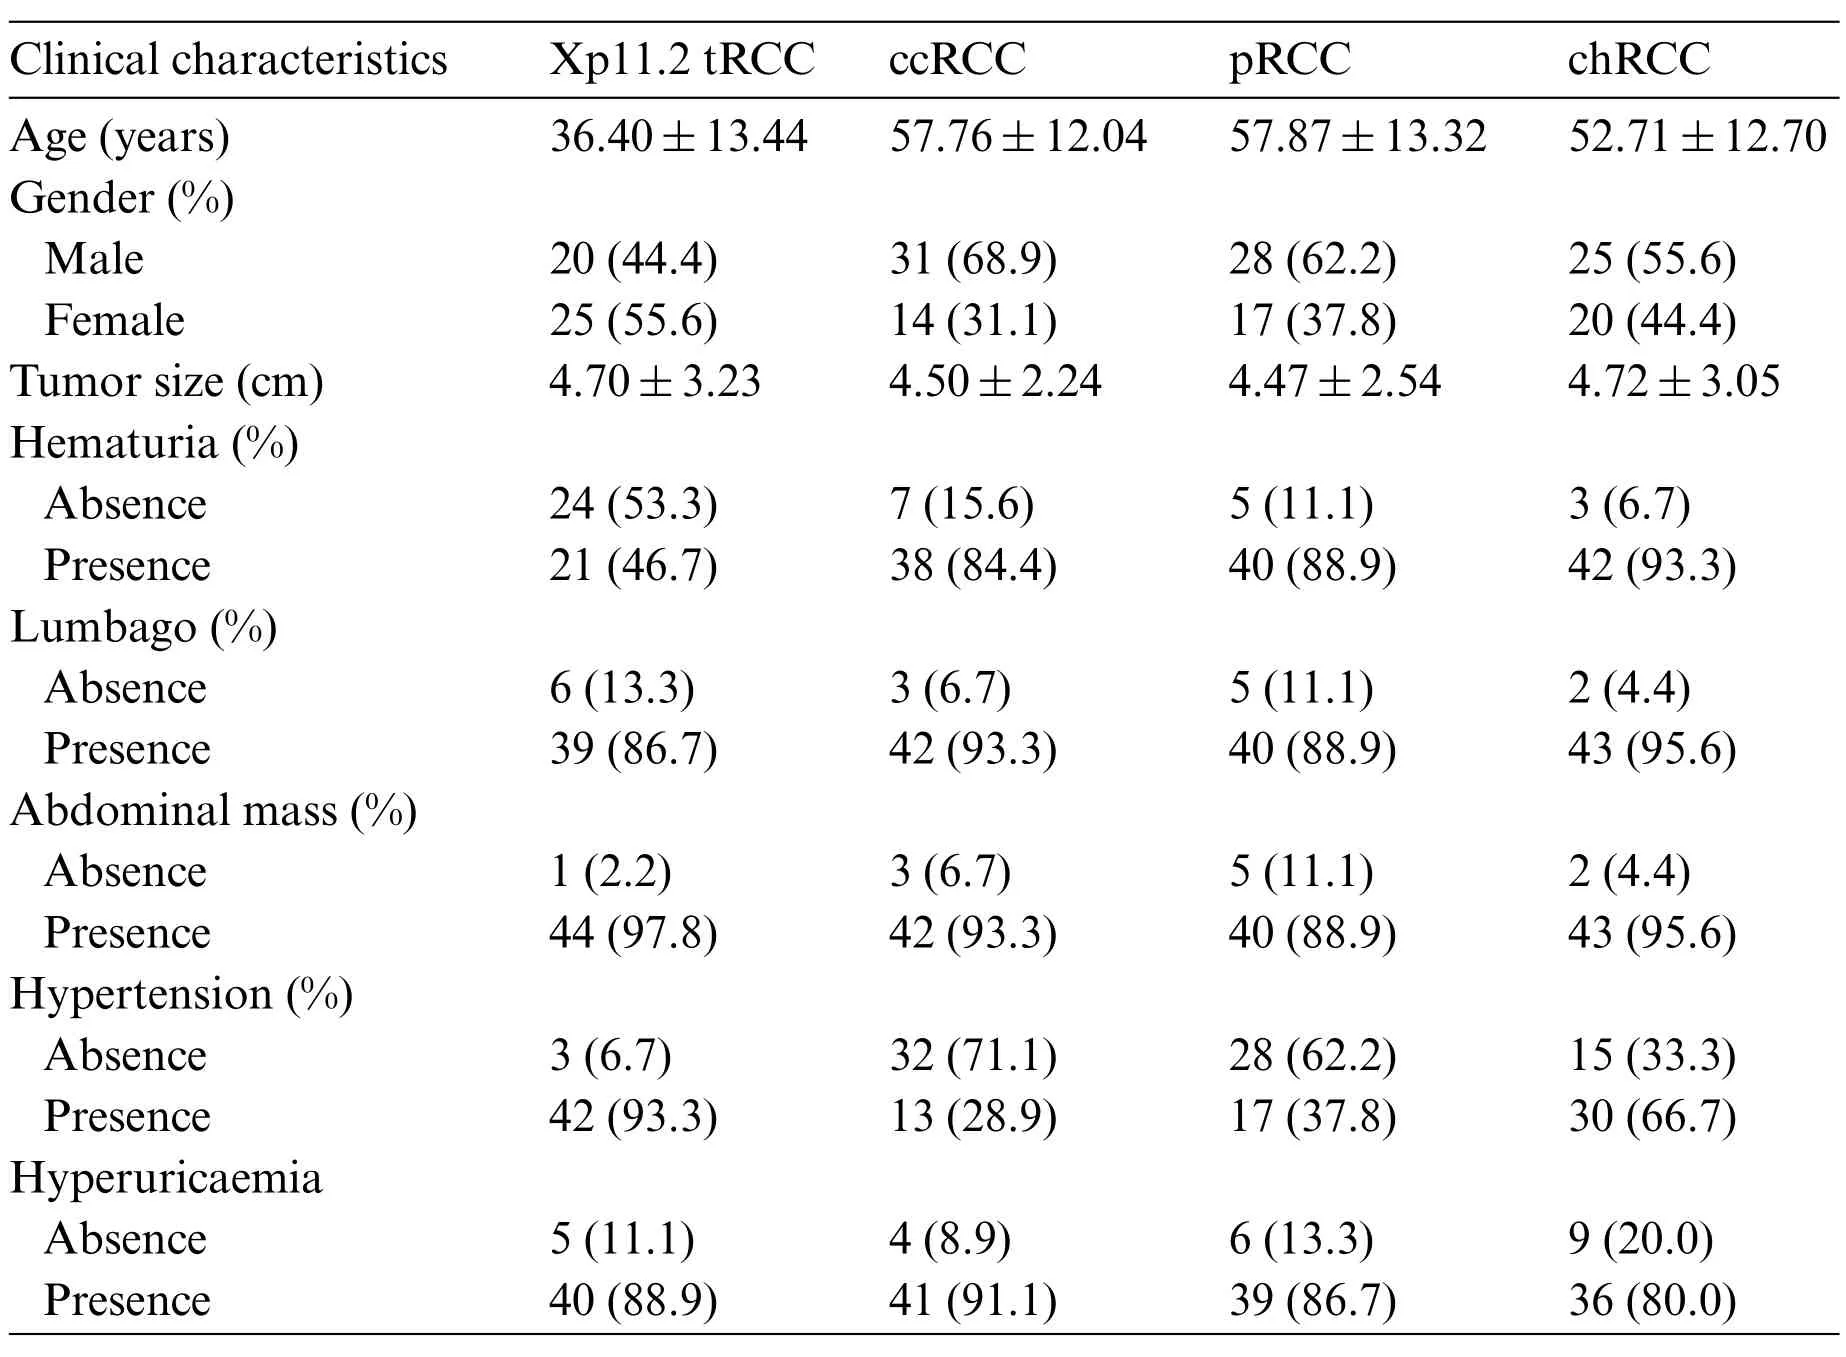
Table 1: Clinical features of patients and RCC subtypes. Xp11.2 tRCC: Xp11.2 translocation renal cell carcinoma;ccRCC:Clear cell renal cell carcinoma;pRCC:Papillary renal cell carcinoma;chRCC:Chromophore renal cell carcinoma
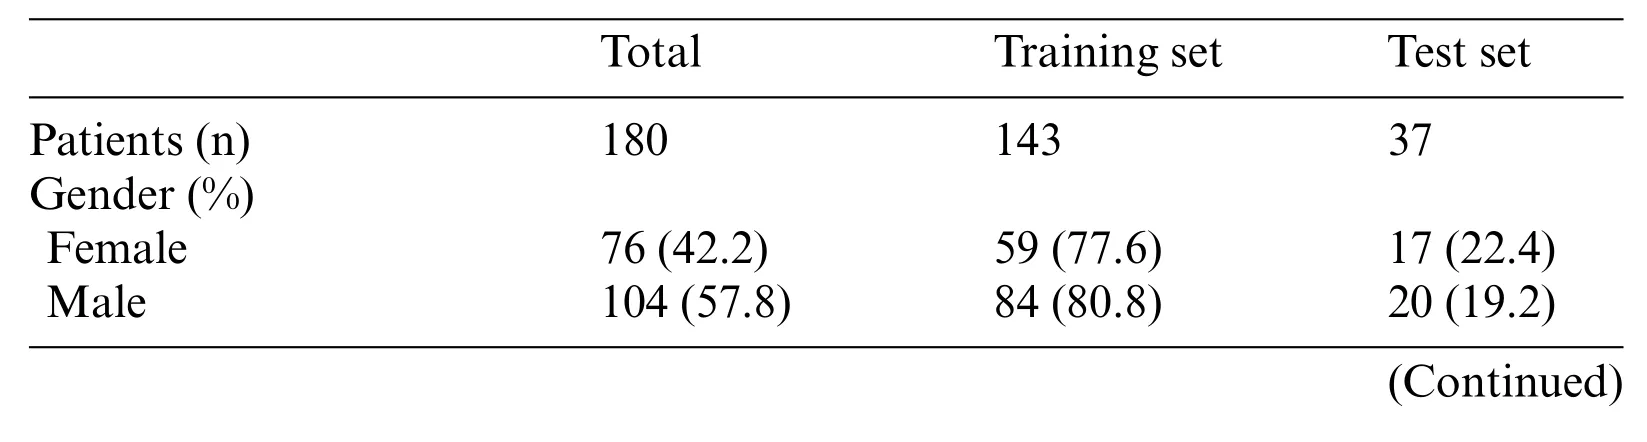
Table 2: Patients demographics and kidney cancer subtypes distributions for training or testing set.Xp11.2 tRCC: Xp11.2 translocation renal cell carcinoma; ccRCC: Clear cell renal cell carcinoma;pRCC:Papillary renal cell carcinoma;chRCC:Chromophore renal cell carcinoma

Table 2 (continued)Total Training set Test set Age(%)≤45 61(33.9) 47(77.0) 14(23.0)>45 119(66.1) 96(80.7) 23(19.3)Subtypes(%)Xp11.2 tRCC 45(25.0) 36(80.0) 9(20.0)ccRCC 45(25.0) 36(80.0) 9(20.0)pRCC 45(25.0) 36(80.0) 9(20.0)chRCC 45(25.0) 35(77.8) 10(22.2)Tumor size(cm) 4.65±2.80 4.67±2.83 4.58±2.71 Images in CT phases Unenhanced 1973 1405 568 Corticomedullary 8968 7296 1672 Nephrographic 5694 4767 927 Enhanced 14662 12063 2599 All 16635 13468 3167
3.2 Predictive Performance Metrics
During the training stage, 30 epochs were performed to converge the ResNet-18 CNN. For prediction using a ResNet-18 CNN model,the subtypes of RCCs were differentiated by the average probability scores of their image patches. The predictive performance metrics of the ResNet-18 CNN model in classifying subtypes of RCCs during the testing stage were displayed in Table 3.Among the predictive performance metrics of the ResNet-18 CNN model based on different CT phases,the average sensitivity,specificity,accuracy,and AUC were 0.547(95%CI,0.354-0.741),0.857(95% CI, 0.751-0.964), 0.782 (95% CI, 0.689-0.875) and 0.702 (95% CI, 0.601-0.804) respectively in the nephrographic phase,which exhibited the high performance in comparison with single phase.However, when we ensembled the classification results of CT images in different phases (enhanced phases or all phases), we found that the model’s performance trained by enhanced phases or all phases data did not improve further.Surprisingly,compared with ResNet-18 CNN model,XGBoost model trained by clinical data achieved the top performance with the average sensitivity, specificity,accuracy and AUC:0.667(95%CI,0.596-0.737),0.904(95%CI,0.848-0.959),0.848(95%CI,0.798-0.898)and 0.785(95%CI,0.731-0.839),respectively.In addition,the diagnostic performance of the ResNet-18 CNN fused XGBoost model to differentiate Xp11.2 tRCC from three main RCC subtypes is shown in Table 4. The ensemble model trained by unenhanced phase and clinical data achieved a test sensitivity of 0.615 (95% CI, 0.529-0.700), specificity of 0.846 (95% CI, 0.725-0.966), accuracy of 0.792(95%CI,0.694-0.890),precision-recall AUC of 0.730(95%CI,0.643-0.817),which showed better performance than the ResNet-18 CNN model trained by unenhanced phase. Similarly, other ensemble models outperform the compared ResNet-18 CNN model.The ensemble model trained by corticomedullary phase and clinical data achieved optimal performance with a test sensitivity of 0.760(95%CI,0.690-0.831),specificity of 0.929(95%CI,0.882-0.977),accuracy of 0.890(95%CI,0.862-0.917),precision-recall AUC of 0.845(95%CI,0.809-0.881).

Table 3: Diagnostic performance of ResNet-18 CNN and XGBoost model to differentiate Xp11.2 tRCC from the three main RCC subtypes based on different phases
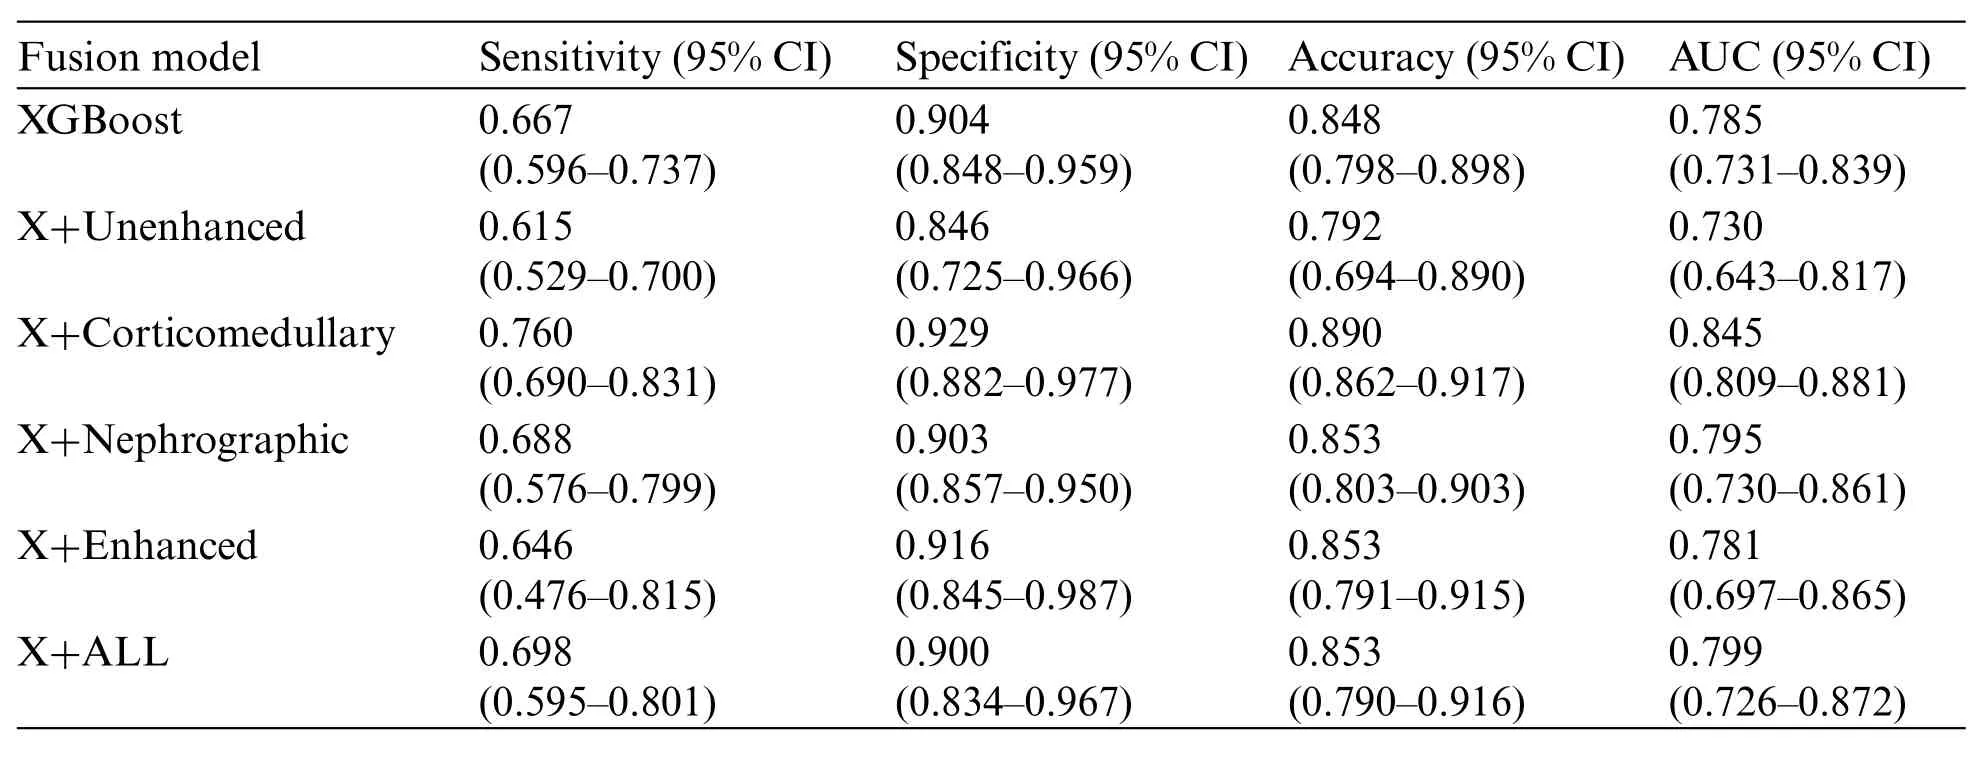
Table 4:Diagnostic performance of fusion model to differentiate Xp11.2 tRCC from the three main RCC subtypes.X indicates the XGBoost method
3.3 Performance Compared between the Ensemble Model and Urologists
The confusion matrices for the ensemble model and three individual urologists were depicted in Figs.3a-3d.Urologist 1 achieved a test sensitivity of 0.495(95%CI,0.128-0.861),specificity of 0.830(95%CI,0.655-1.004)and accuracy of 0.744(95%CI,0.661-0.826).Urologist 2 had a test sensitivity of 0.492(95%CI,0.225-0.758),specificity of 0.829(95%CI,0.680-0.979)and accuracy of 0.744(95%CI,0.681-0.806).Urologist 3 had a test sensitivity of 0.414(95%CI,0.001-0.827),specificity of 0.802(95% CI, 0.640-0.964) and accuracy of 0.703 (95% CI, 0.614-0.791). Compared with all urologists averaged, the ensemble deep learning model had higher test sensitivity (0.667vs.0.467,P=0.0036,specificity (0.893vs.0.820,P=0.2173, and accuracy (0.838vs.0.730,P=0.0272). Moreover, the results displayed that Xp11.2 tRCC, pRCC, and chRCC were frequently misclassified as ccRCC by the urologists,whereas they were more correctly predicted by the ensemble deep learning model.As was depicted in Figs.3e-3g, compared to the average urologists, the ensemble model demonstrated statistically significant improvements in sensitivity for pRCC and chRCC(P=0.0167 andP <0.05,respectively) and even in specificity for ccRCC (P= 0.0056). In addition, there were statistically significant improvements in accuracy for ccRCC and chRCC(P=0.0038 andP=0.0027).The receiver operating characteristic(ROC)curves of the ensemble model and the performance of the urologists are depicted in Fig.4. The AUCs with 95% CI for each curve were computed. The ensemble model achieved an average AUC of 0.799 (95% CI, 0.726-0.872) and outperformed the urologists in most cases.Especially most of the points indicating the performance of the urologists fell on or below the ROC curves of the ensemble model for four subtypes of RCCs.
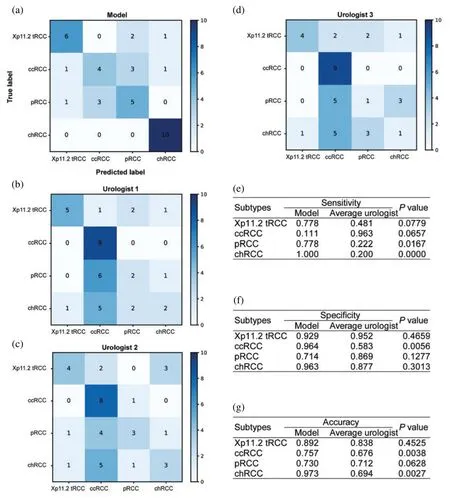
Figure 3:Diagnostic performance of the ensemble model and individual urologists for kidney cancer.Confusion matrices for the ensemble model(a)and individual urologists(b-d).The ensemble model compares with urologists,including the sensitivity(e),specificity(f),and accuracy(g)

Figure 4: The ROC curves of the ensemble model and the performance of the three urologists are plotted for four tumor subtypes,including Xp11.2 tRCC(a),ccRCC(b),pRCC(c),and chRCC(d)
4 Discussion
Compared with other common subtypes of renal tumor, Xp11.2 tRCC is highly aggressive and has a poor clinical prognosis. Therefore, the treatment for Xp11.2 tRCC should vary. However,the current diagnosis of Xp11.2 tRCC depends on postoperative pathology, and there are still no effective preoperative diagnosis methods.As the understanding and acceptance of AI grows in health and medicine, so does our imagination in ways to improve diagnostic accuracy, expedite clinical processes, and decrease human resource costs by assisting medical professionals in what once were time-consuming problems [21]. Therefore, we proposed a preoperative diagnosis prediction model based on an artificial intelligence algorithm. In the present study, we described automated methods based on decision fusion of a slice-based ResNet-18 CNN or clinical data-based XGBoost model to differentiate Xp11.2 tRCC from the three main RCC subtypes on multi-phase abdominal computed tomography. Also, we evaluated the performance of the ensemble model from both the ResNet-18 CNN model and the XGBoost model for the classification of renal masses. Although the ensemble model slightly outperformed the urologists based on small samples, our proposed deep learning methods assisted them in swiftly and noninvasively distinguishing Xp11.2 tRCC. For experienced urologists, the proposed method may be useful for reducing workload and increasing consistency of diagnostic results, and it also really does help those who are not fully trained in urology and shorten their learning curves.To our knowledge,a definitive diagnosis is vital for Xp11.2 tRCC,which has different surgical plans. The study is the first to investigate the use of artificial neural networks to differentiate Xp11.2 tRCC from common RCC subtypes on multiphasic CT and thus provides individualized treatment plans. In addition, our data consisting of CT images and detailed medical history is extremely intact,which is beneficial to the accuracy and reliability of our model.
Artificial neural networks have been increasingly and successfully applied to image recognition diagnostics,personalized medicine,and clinical decision-making.In recent years,powerful CNN has been used to explore complex interactions in clinical and imaging data to provide diagnosis,treatment planning,and prognosis for RCCs.For example,Uhm et al.proposed a DL model for differentiating five major histologic subtypes of renal tumors that outperformed radiologists for most subtypes,achieving an AUC of 0.889[11],and ML also showed the same performance according to the literature[22,23].In our study,the ensemble deep learning model showed good performance for discriminating Xp11.2 tRCC from common RCC subtypes with a test AUC of 0.845,and it also achieved similar or better diagnostic performance than urologists.Additionally,the previous study has shown that deep learning models trained by CT images can accurately distinguish between high and low nuclear grades for ccRCC with the accuracy of 0.82 [24], but more studies displayed that ML models constructed from CT imaging texture features can accurately predict the nuclear grades for ccRCC or pRCC with good performance [25-28]. We speculated that ML has much better performance than DL for nuclear-grade prediction,but ML based on artificial neural networks showed the greatest accuracy for differentiating low-and high-grade for ccRCCs[29].Moreover,DL was also applied to doing treatment planning.Chen et al.evaluated epithelial-mesenchymal transition molecular classification of ccRCC tissue to predict prognosis and the effect of immunotherapy using DL convolutional neural networks[30],and a commercial AI-based contouring model was trained to provide prostate segmentation and demonstrated good performance in the implementation of an automated prostate treatment planning process [31]. Another important application of AI is the prediction of prognosis for RCCs. The AI prediction model based on multiple gene expression signatures has been developed to predict overall survival in ccRCC [32], and most previous studies also proposed AI model-based histopathological images or clinical data to evaluate prognosis for RCC patients[33-35].Although the application of AI has been wildly studied in ccRCC,it deserves further exploration in other more aggressive renal cancer subtypes, such as pRCC, renal collecting duct carcinoma, and Xp11.2 tRCC. These are promising and broad prospects for developing AI models of histopathologic subtypes, nuclear grade, therapy response,and prognosis,which benefit patients.
XGBoost is a highly effective ML method used widely by data scientists to achieve state-of-theart results on many ML challenges. As a novel type of ML algorithm, XGBoost can achieve better performance and accuracy than ML algorithms, and it comes from an improved gradient lifting decision tree and has great advantages in preventing over-fitting,parallel processing,cross-validation,and processing missing values[36].XGBoost is growingly gaining popularity in health and medicine and is applied to predict cancer early diagnosis, subtypes, and prognosis. Schieda et al. proposed the XGBoost ML model trained by texture analysis features from CT images to distinguish ccRCC from other RCC subtypes or benign tumors with high performance[37].The results from our study displayed that the XGBoost model constructed from clinical data also achieved the top performance with an average AUC of 0.785, which had similar or better diagnostic performance than previous studies.Furthermore,the XGBoost model was applied to predict the overall survival of genitourinary cancer patients in recent studies [38,39]. Wei et al. designed the XGBoost model based on clinical data to predict the prognosis of renal collecting duct carcinoma, and the results implied that the models had the highest predictive accuracy and helped clinicians to make clinical decisions for patients[40].Consistent with our study,clinical data should be considered a very important basis for diagnosing diseases when building models. Although some clinical data may be subjective, they still have reference value.Our results showed that the performance of the ResNet-18 CNN model was not very outstanding,but the clinical characteristics between Xp11.2 tRCC and the common subtypes of RCCs were significantly different.Therefore,clinical data were used to train the XGBoost model,and finally,the ensemble model was established and achieved great performance than urologists,especially in Xp11.2 tRCC,pRCC,and chRCC.
Despite several strengths,our research has certain limitations.Firstly,the tumor location cannot be automatically detected by our model, and manually segmenting the renal lesions was timeconsuming and labor-intensive work. Further study is required to combine automatic renal mass recognition strategies with our ensemble model. Secondly, the ensemble model was validated with our dataset; therefore, it lacks external validation. The applicability of the model in other datasets requires further validation.Thirdly,the study was retrospective,and the patients in the entire cohort were small and not consecutive.Therefore,it may introduce potential population bias,and validation of our model is needed to validate in other populations,especially in prospective and consecutive large clinical samples.
5 Conclusions
In this research, we proposed a ResNet-18 CNN combined with an XGBoost model that can achieve urologist-level performance for distinguishing Xp11.2 tRCC from three main RCC subtypes using CT images and clinical data.Moreover,the ensemble model successfully performed fine-grained classification of renal tumors into four pathological subtypes, including rare and common kidney cancer.These results highlight the potential for the ensemble model to assist urologists in diagnosing Xp11.2 tRCC patients. Further studies with a larger number of cases will be needed to validate the applicability of the model in clinical practice and required to validate in further research with large prospective clinical data. Additionally, we believe the presented DL model could also be applied to analyze other cancer types and other multimodality imaging, such as magnetic resonance imaging and contrast-enhanced ultrasound.
Acknowledgement:Thank you for the technical support from Dr.Lei Yang,Dr.Yindong Zheng,and Dr.Guo Chen.
Now I ve caught my bird, said the tailor, and he came out from behind the tree, placed the cord round its neck first, then struck the horn out of the tree with his axe, and when everything was in order led the beast before the King
Availability of Data and Materials:The datasets generated during and/or analyzed during the current study are available from the corresponding author on reasonable request.
Funding Statement:This study was supported by Beijing Ronghe Medical Development Foundation.
Conflicts of Interest:The authors declare that they have no conflicts of interest to report regarding the present study.
 Computer Modeling In Engineering&Sciences2023年7期
- Computer Modeling In Engineering&Sciences的其它文章
- Edge Intelligence with Distributed Processing of DNNs:A Survey
- Turbulent Kinetic Energy of Flow during Inhale and Exhale to Characterize the Severity of Obstructive Sleep Apnea Patient
- The Effects of the Particle Size Ratio on the Behaviors of Binary Granular Materials
- A Novel Light Weight CNN Framework Integrated with Marine Predator Optimization for the Assessment of Tear Film-Lipid Layer Patterns
- Implementation of Rapid Code Transformation Process Using Deep Learning Approaches
- A New Hybrid Hierarchical Parallel Algorithm to Enhance the Performance of Large-Scale Structural Analysis Based on Heterogeneous Multicore Clusters