
MDNN:Predicting Student Engagement via Gaze Direction and Facial Expression in Collaborative Learning
2023-02-17 03:12YiChenJinZhouQiantingGaoJingGaoandWeiZhang
Yi Chen,Jin Zhou,Qianting Gao,Jing Gao and Wei Zhang
1School of Computer Science,Central China Normal University,Wuhan,430079,China
2Computer Science,School of Science,Rensselaer Polytechnic Institute,Troy,12180,USA
3National Engineering Laboratory of Educational Big Data Application Technology,Central China Normal University,Wuhan,430079,China
ABSTRACT Prediction of students’engagement in a Collaborative Learning setting is essential to improve the quality of learning.Collaborative learning is a strategy of learning through groups or teams. When cooperative learning behavior occurs,each student in the group should participate in teaching activities.Researchers showed that students who are actively involved in a class gain more.Gaze behavior and facial expression are important nonverbal indicators to reveal engagement in collaborative learning environments.Previous studies require the wearing of sensor devices or eye tracker devices,which have cost barriers and technical interference for daily teaching practice.In this paper,student engagement is automatically analyzed based on computer vision. We tackle the problem of engagement in collaborative learning using a multi-modal deep neural network(MDNN).We combined facial expression and gaze direction as two individual components of MDNN to predict engagement levels in collaborative learning environments.Our multi-modal solution was evaluated in a real collaborative environment.The results show that the model can accurately predict students’performance in the collaborative learning environment.
KEYWORDS Engagement;facial expression;deep network;gaze
1 Introduction
Collaborative learning is a mode of knowledge construction based on the group [1]. According to psychosocial developmental theory, interactions between learners will improve their mastery and understanding of crucial task concepts. However, traditional classroom often emphasizes teaching content,ignoring students’feedback and interaction.Activities of collaborative learning pay attention to student interaction; students complete learning tasks in a relaxed, happy, democratic learning atmosphere. The interactive way of collaborative learning makes learning tasks complete efficiently and promote the development of learners’knowledge and ability.
Collaborative learning needs group interaction. The success of collaborative learning is closely related to the state,intensity,content,and emotion of interpersonal interaction between group participants.Students need to maintain a positive mood and a positive enterprising mentality.However,in the current collaborative learning situation,students’communication,interaction,and other learning behaviors cannot be collected, analyzed, and evaluated effectively. Therefore, effective intervention and guidance are impeded.
Different from the traditional classroom teaching model,the analysis object of learning analysis is expanded from individual to group members in the collaborative learning model.It is necessary to study learners’behaviors in interactive social activities within the group.
Students’performance is often reflected in their facial expressions and mutual eye contact.Sinha et al. [2] used four aspects, such as behavioral engagement, social engagement, cognitive engagement,and concept-to-outcome engagement to describe the level of engagement in collaborative learning among group members.Engagement is closely related to learning efficiency.
1.1 Research Challenges
Although the measurement of learning engagement has been around for decades, collaborative learning environments are very different from traditional classrooms. Several key issues remain unresolved for collaborative learning scenarios:
1) There is a lack of an automatic evaluation and analysis model for collaborative learning scenarios.The previous examination or teacher scoring methods cost manpower and material resources.In addition,they are susceptible to subjective factors.
2) Computer-aided studies rely heavily on facial expressions, ignoring the information on gaze behavior between learners in collaborative learning.
3) Among science and engineering courses at university, learners’emotional fluctuations are subtle. Relying only on facial emotional changes to identify engagement leads to a poor prediction effect.
4) Wearing gaze tracking glasses interferes with the learners’learning state.The post-processing technology is also complicated.
5) In scenarios of collaborative learning,eyes or faces are partially occluded while learners lean to other members.That makes gaze estimation difficult.
6) There is also a lack of corresponding open datasets in collaborative environments.
Given the above problems,this paper mainly considers the detection of facial expression and gaze in real collaborative learning scenarios to predict students’engagement in class.
The difference between our approach and previous gaze-tracking studies is that learners do not need gaze-tracking glasses,but use cameras to capture images undisturbedly,so the research has the potential for wider application with fewer condition constraints.
The main contributions of this paper are summarized as follows.
1.2 Contributions of Our Approach
1. A new perspective. In collaborative learning, communication and interaction among group members reflect the inner state of learners’engagement. Given this respect, we proposed a method to detect learners’engagement by joint analysis of facial expressions and gaze.
2. New idea. The difference between this paper and the classical gaze tracking/eye movement analysis is that there are fewer constraints on the learners.Learners do not need to wear gaze tracking glasses or sit in front of a screen.Moreover,learners do not need to face the camera directly but use the camera in the distance to capture learners’gaze behavior,which has little interference to learners. In cooperative learning, the communication or movement between members results in partial occlusion of eyes, which makes it difficult to predict gaze. Our method can output an estimated gaze direction based on the visible head features even when the eyes are completely occluded.
3. New technology. In this paper, deep neural networks in computer vision are used to analyze learners’engagement through gaze behavior automatically instead of manual coding, which has the advantages of promptness and wider applicability.
4. New solution. For some courses (such as science), there are few obvious facial expression changes to learners,so the accuracy of manual or automatic results of the facial analysis is not ideal.We proposed a solution to tackle this problem by a fuzzy logic of joint facial expression and gaze to complement each other.
Mining student behaviors in collaborative mode can be used to construct student portraits.It is of great significance and value to identify learning risks and propose intervention measures.Given the above problems,this paper mainly considers the estimation of facial expression and gaze behaviors in collaborative learning scenarios to detect student engagement.
2 Related Works
2.1 Analysis of Methods for Teaching in a Classroom
The quality of classroom teaching is a core content to measure the level of schools’and teachers’teaching quality. However, the evaluation method of teaching quality has not formed a unified standard.Traditional classes use tests,questions,manual observations,self-reports,and after-school surveys,which cost manpower and time.As the collected data are often not comprehensive enough,and there are too many human factors,there exists a certain lag,which is of little significance for the establishment of a real-time and objective classroom teaching evaluation system.Therefore,more and more researchers have participated in the study of classroom teaching evaluation.
The classroom has always been the most important site for teachers and students to learn and communicate, so it has attracted wide attention from educational researchers. However, traditional classroom often lacks collaboration and interaction,and the evaluation of teaching quality is usually limited to the evaluation of teachers’teaching level,and the feedback and interaction of students are not paid enough attention to.
With the profound changes in education,education technology,and talent training,the engagement of classroom learning members has become an important index to evaluate the quality of the classroom.
2.2 Student Engagement
The research on student engagement began with educational psychologist Ralph Tyler[3].Engagement is used to represent the active,effective,and continuous state of learners in the learning process.Existing studies showed a positive correlation between student engagement and teaching quality or academic performance. The literature emphasizes the central role of engagement in classroom learning[4].
For individual behavior,Fredricks proposed the definition of the indicator to evaluate individual learning engagement. This indicator is a three-dimensional structure, namely behavior, cognition,and emotion [5]. These three dimensions reflect the internal dynamic interrelation of an individual student.For group learning,the social input dimension is added.The interaction direction,interaction content, and emotional state between partners are mainly concerned. For example, Li et al. [6]established behavior, cognition, emotion, and social interaction to analyze the engagement levels of group members.
Both individual behavior and group collaboration contain less obvious internal cognitive processes. The level of engagement in classroom behavior and emotion can usually be observed from external performance,using two methods:self-report method or expert scoring method.
1) Self-report method. Self-report is simple, practical, and widely used. However, it depends on whether there is a deviation in the understanding of the requirements or any concealment in the content. 2) Expert scoring method. The expert score method has high quality and strong reliability.However,due to the small number of experts,it is impossible to increase the observation samples in the classroom. And the experts may be influenced by personal factors, so there are deviations and inconsistencies.Moreover,both of these methods have lag problems and scale limitations,which are not ideal for solving real classroom teaching problems timely[7].
With the development of wireless connectivity and the Internet of Things(IoT),researchers make efforts to sense information in the classroom environment and predict student engagement through explicit behaviors and learning data. Gao et al. [8] detected multimodal data such as physiological signals and physical activities of students through IoT sensors, recording students’physiological responses and changes in activities. Then student engagement level was inferred through emotions,behaviors,and cognition aspects.It is verified that the level of classroom engagement of high school students is highly correlated with the measured physiological data, which can be used to predict students’engagement.
However, fitting every student with a physical sensor like a wristband would be expensive and impractical for the average school.With the proliferation of cameras in classrooms,computer vision offers a cheaper,non-invasive and unobtrusive alternative to sensing.In recent years,computer vision technology has been used for student engagement[9,10].
2.3 Research on Engagement Based on Computer Vision
2.3.1 Single-Modal Student Engagement Detection
In recent years, computer vision and deep learning techniques have been widely used to detect student engagement. Gupta et al. [11] directly labeled the engagement of images and people in the DAiSEE dataset by employing InceptionNet[12],C3D[13],and long-term Recurrent convolutional Networks(LRCN)[14].After training and testing,the accuracy of engagement according to different networks is 46.4%,56.1%,and 57.9%,respectively.
To solve the serious imbalance of positive and negative sample ratios in the dataset,Geng et al.[15]improved the cross-entropy loss function by Focal Loss to improve the engagement accuracy by 56.2% in the DAiSEE dataset. Then, Zhang et al. [16] proposed a cross-entropy loss function with weight to reduce the performance degradation by the imbalance of negative and positive samples.In combination with the Inflated 3D network (I3D), parameters of the 2D network were extended with the advantages of a wider view field in the time domain, with an accuracy rate of 52.35% on the DAiSEE dataset. Zhang et al. [16] stated that the root cause of sample proportion imbalance was the small scale of low engagement data. Therefore, they simplified the original four categories(high engagement, low engagement, very low engagement, and nonengagement) into two categories(engagement and nonengagement) to increase the number of cases in each set. Experimental results showed that the accuracy is 98.82%.
In 2021,Liao et al.[17]proposed a network structure based on Spatio-temporal features of images,which effectively utilized spatial and temporal information of images, improving the accuracy of engagement prediction to 58.84%. Their design includes the pretrained SE-ResNet-50 (SENet) and LSTM Network with the global attention mechanism. Although SE-ResNet-50 has strong spatial feature extraction capability, it still suffers the problem of low classification accuracy from the unbalanced case distribution in the dataset.
To further improve the classification performance,Abedi et al.[18]proposed end-to-end network architecture, detecting engagement levels from video data directly. It is a hierarchical structure composed of ResNet + TCN. Firstly, 2D ResNet extracts spatial features from successive video frames, then TCN (Temporal Convolutional Network-TCN) analyzes temporal features to detect engagement.The spatial feature vector extracted from the continuous frame(via a ResNet)is input to TCN,so TCN retains more feature information than LSTM.The prediction accuracy of engagement is improved to 63.9%.
2.3.2 Multi-Modal Student Engagement Detection
There are three main categories of multi-modal data:(1)learning process data;(2)physiological data;(3)image data.Learning data include test results,response time,online time,etc.,with limitations and lag. Physiological data need special sensors. Due to economic reasons and invasiveness, it is difficult to implement in general classrooms with several students.
Image data have attracted increasing attention from researchers in recent years, due to their non-contact and instantaneity.Existing studies on engagement are mainly based on facial expression analysis or gaze tracking[19].
Although studies based on facial expression and gaze tracking have been carried out for a long time,previous studies were only limited to an individual rather than a group because the subject was required to wear an eye tracker to locate one’s current learning content [20]. Therefore, only noninvasive,image-based facial expression and gaze recognition techniques are discussed below.
Facial Expression Classification
Facial expression is a language of emotion, a kind of physiological and psychological state expression.Psychologists have defined six basic categories of human expressions—surprise,sadness,happiness,anger,disgust,and fear.By analyzing the facial expression information of learners in images or videos,we can understand their inner psychological and emotional states.
At present,some international enterprises have tried to apply facial recognition technology in the classroom.SensorStar Lab uses cameras to capture learners’smiles,frowns,and sounds in images by the technology of EngageSense to determine whether students are distracted or engaged in class[21].
Wu et al. [22] used LSTM and GRU networks to extract the facial and upper body features from the video, classifying the level of students’engagement in the course. Dhall et al. [23] adopted the improved GRU model to analyze students’engagement levels. By using attention weighting, the training time of the model on the EmotiW data set was accelerated.Huang et al.[24]added attention mechanism to the LSTM network to train extracted facial features with 60% accuracy of students’engagement on the DAiSEE dataset.Wang et al.[25]used a CNN network to extract facial features and classify student engagement levels.
Murshed et al. [26] proposed a two-level engagement detection model by training face images extracted from videos in the DAiSEE dataset. They used local direction mode (LDP) for humanindependent edge futures extraction, nuclear principal component analysis (KPCA) for nonlinear correlation analysis of extracted features, and deep belief network (DBN) for participation level classification of extracted features.Two-stage engagement detection accuracy is 91%,and three-stage engagement detection accuracy is 87%.
Gaze Detection
A learner’s gaze behavior is an important real-time indicator of learning status.Gaze,as a basic form of communication,is of great significance in the study of human behavior,emotional expression,and social interaction[27,28].Gaze tracking refers to automatically detecting the direction of the gaze and mapping it accurately to a real-world target.
In 1948, the first modern head-mounted eye tracker appeared [29]. It can record the complex process of the line of sight without the effect of head movements.In recent years,the Microsoft Kinect camera has been widely applied in many fields such as gaze tracking, due to its advantages of low cost, small size, and depth perception in 3D scenes. Gaze-tracking glasses also use infrared light to estimate gaze direction through corneal reflection,tracking the target at which the eye is gazing.But these technologies rely on hardware support.They are expensive and patented,limiting use popularity.
However, the emergence of AI has revolutionized the field of gaze tracking. Computer vision and intelligent learning have made considerable progress.Devices such as optical camera sensors have become cheap, which has prompted researchers to automatically extract knowledge from images or videos.
Understanding where one is looking and analyzing the behavior behind the gaze is the goal of this field of research.The results of this research can provide an implicit way to study the dynamics of human interaction,as well as the interaction between people[30].
Chong et al.[31]sent the scene image and the face segment cut from the original image into two separate convolutional layers to extract features respectively and determine the in-scene target of the person’s actual gaze after features fusion.This is the first time to solve the gaze estimation problem from a third-person perspective.
Researchers in education have been exploring the importance of gaze fixation, aversion, and following in the classroom[32].Researchers found that intimacy and positive feelings between teachers and students in the class were positively correlated with the frequency of eye communication between teachers and students[33].
In class, students who are gazed more inclined to be more active [34]. The frequency of gaze is generally thought to be associated with interest or indifference[35].
Gaze, therefore, expresses a common interest between interlocutors and reflects a positive response to each other[36].In cooperative learning situations,students who made frequent eye contact with a teacher or partner were more likely to participate effectively in class learning than students who made low eye contact.
3 Model Formulation
The goal of our study is to predict student engagement in learning scenarios based on computer vision. This study attempts to add gaze detection to facial expression recognition to improve the accuracy of student engagement classification.
In collaborative learning,students’gaze direction and facial expression are unconscious behaviors while communicating with each other.Studying this nonverbal behavior in the classroom can provide an important indicator for teachers. Previous studies required the wearing of sensor devices or eyetracking devices,which had a high price and technical hindrances for general applications.This study uses cameras to capture learners’facial expressions and gazes in the wild and adopts AI technology to detect student engagement.We adopt fuzzy control to integrate the two modal features and output the engagement value.
3.1 Overview of the Proposed Method
Fig.1 shows the overall network structure of this method.It includes three parts of face detection,facial expression identification, and gaze estimation. The sentiment in the facial expression is set in two levels,and the gaze is divided into four levels(high,a little bit high,a bit little low,low).Combing human facial expression and gaze estimation jointly, the final student engagement is classified into four levels(high engagement,engagement,a little bit low engagement,low engagement),as is shown in Table 1.
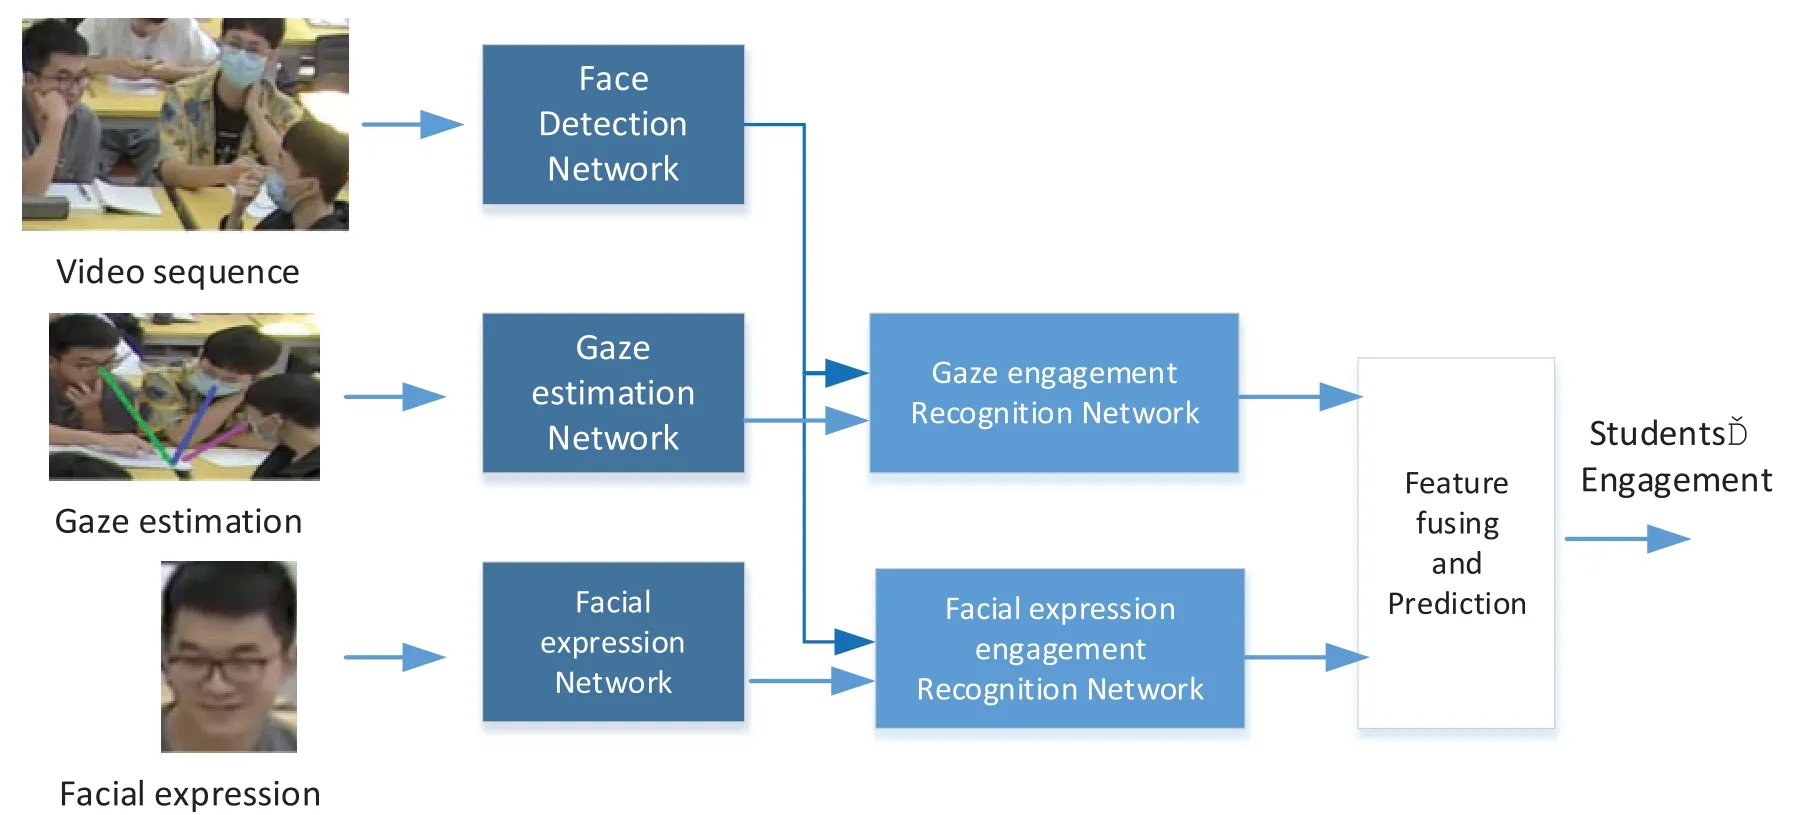
Figure 1:Overview of the proposed network for students’engagement level prediction
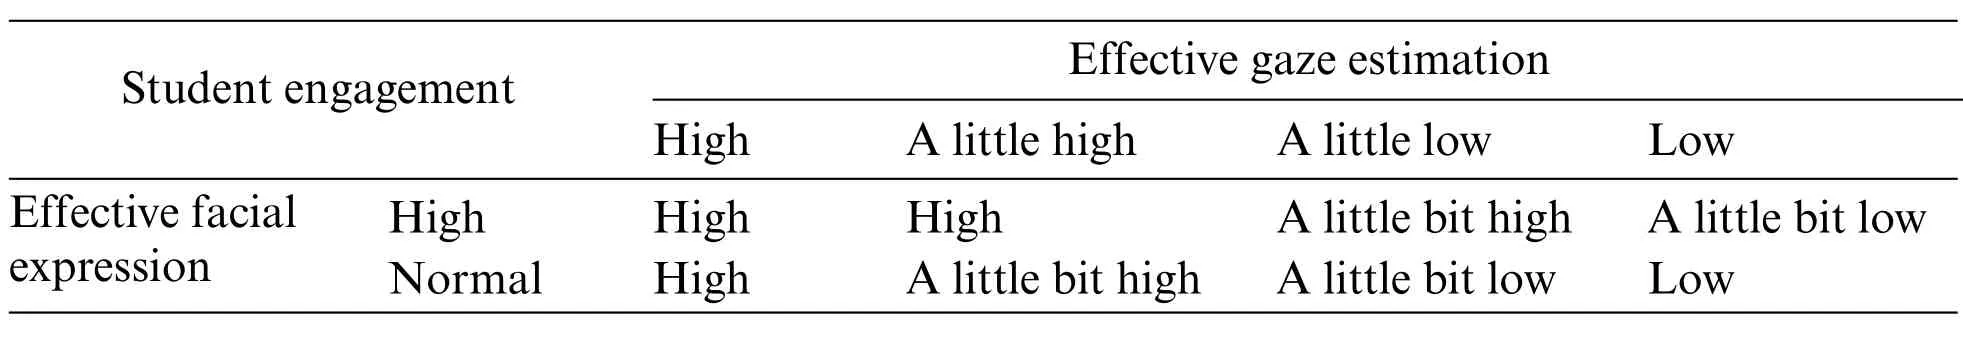
Table 1: Student engagement table
3.2 Facial Expression Processing
1)Video preprocessing
The FFmpeg[37]is used to process the video recorded by the camera in class,and the corresponding frames are extracted according to the time sequences.
2)Face detection using MTCNN
MTCNN is a cascade multi-task convolutional neural network. In this model, three cascaded networks are used,and a candidate bounding box plus classifier is used to detect face area quickly and efficiently.
By using cascaded CNN networks, the face information in corresponding frames is extracted through PNET,RNET,and ONET CNN networks in MTCNN.
MTCNN algorithm performs a multi-scale transformation on the image to form an image pyramid, which contains 10 images of scale transformation and forms multiple images of different sizes.These results are sent to the network for detection respectively so that the MTCNN algorithm can automatically adapt to the target detection requirements of large or small targets.
P-NET Proposal Network is a network structure mainly to get the candidate bounding boxes of the local face area. The fully connected convolution network is used to detect the face of the input image, and at the same time, the boundary boxes are used for regression processing to calibrate the position of the candidate boxes. Finally, the non-maximum suppression NMS is used to merge the highly overlapping candidate boxes and optimize the quantity and quality of the candidate boxes.
R-NET Refine Network is a network structure that is mainly to further optimize the face candidate boxes obtained by P-NET,and input the candidate boxes obtained by P-NET into R-NET as parameters. Compared with the P-NET network structure, a full connection layer is added, the candidate boxes are further adjusted by the regression of face boundary frames, and the candidate frames are discarded by the non-maximum suppression-NMS again, thus further improving the suppression effect on interference information of wrong candidate boxes.
O-NET Output Network,the main task of this network structure,is to output facial feature points.Compared with R-NET, it has an additional convolution layer, which will make the results of face candidate boxes more accurate. This layer realizes more supervision over candidate boxes, and can also complete the positioning and output of the nose,left eye,right eye,left mouth,and right mouth in face candidate frames.
As shown in Fig.2, many candidates’bounding boxes are generated after P-NET. The number of bounding boxes is reduced after maximum suppression. Then they are sent to the next R-NET resulting in the face boundary candidate box being further reduced.Finally,the only face prediction bounding box is output after O-NET.
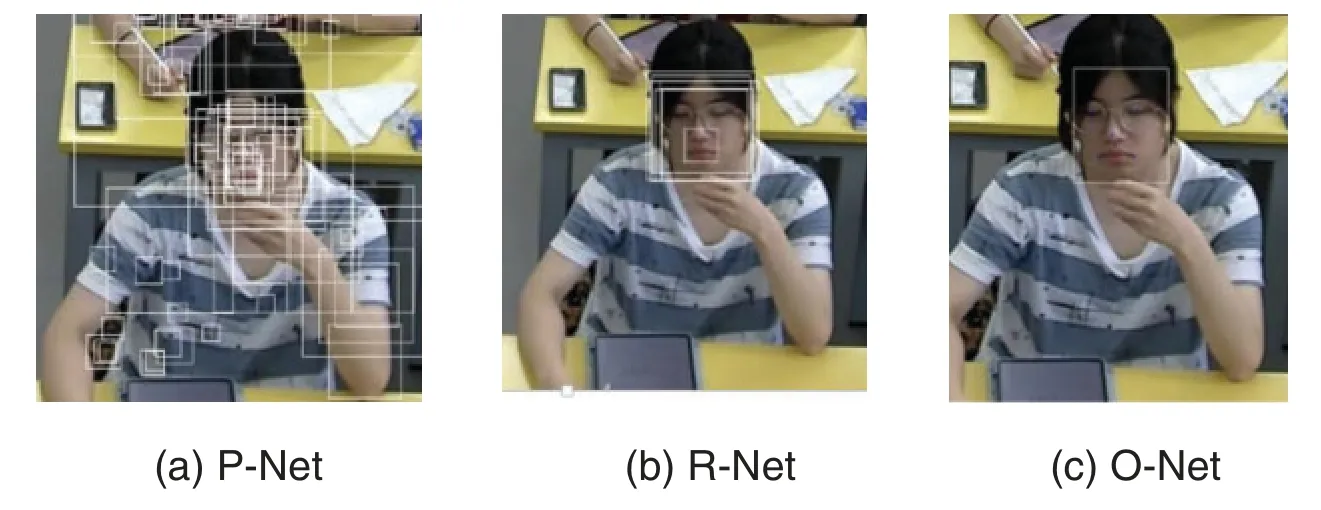
Figure 2:The output of predicted face boundary boxes through MTCNN
3)Identify effective students’facial expressions
The CNN-based lightweight neural network can further process the face information extracted by the MTCNN network to obtain facial expression information.The network is trained using the RAF data set.The network structure is a 6-layer CNN network,wherein the convolution layer operator is 3 * 3 lightweight operators, and the multi-layer convolution layer is superimposed, with the kernel being 5 * 5 and 7 * 7.
The network model structure of the design is in Table 2:
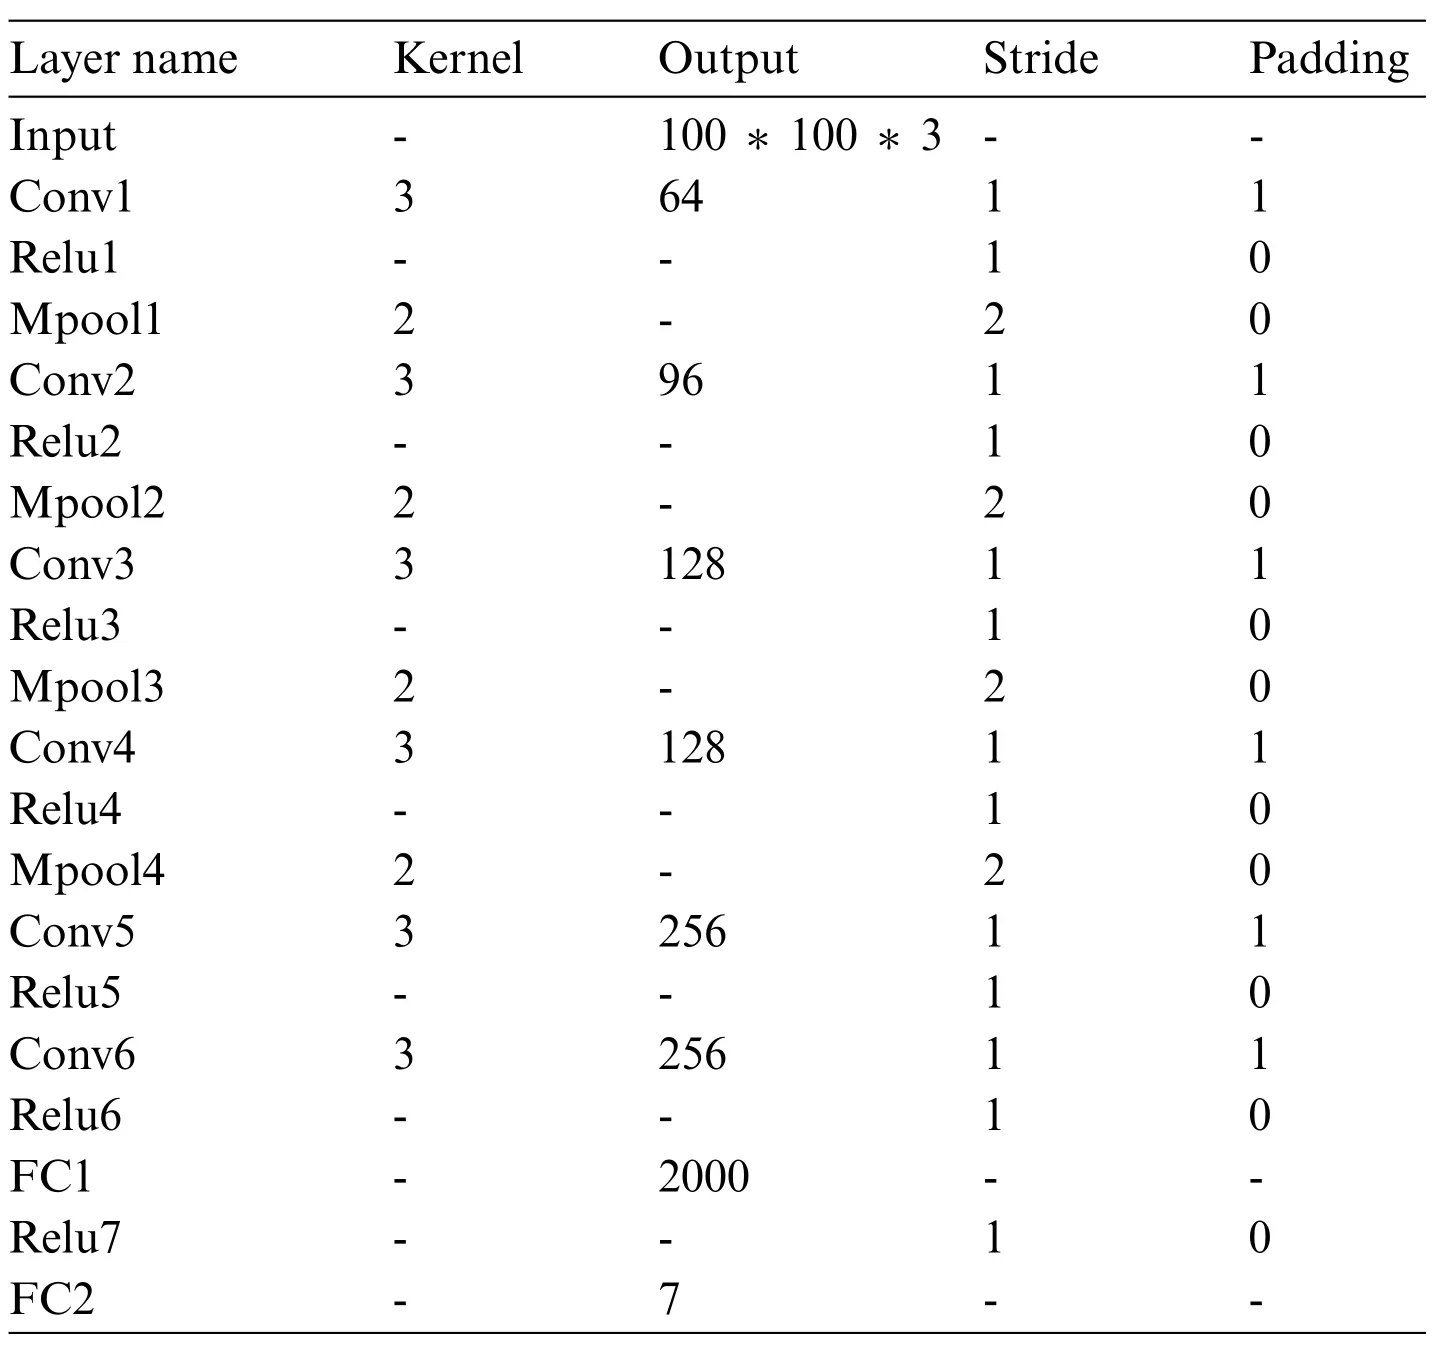
Table 2: Network for face expression identification
For the network training, we use the RAF-DB data set for the training and testing network parameters.The data set contains about 30,000 face images,and each image is labeled by expression classification.The labeled results are surprise,happiness,neutrality,fear,disgust,sadness,and anger.In the actual training process, we selected 12,271 pictures as the training set for training network parameters and 3068 pictures as the test set. When testing the training results, we used the crossentropy loss function to detect the accuracy of the network.
4)Classify the student status based on the seven classification results
According to the seven-class classification, the corresponding emotional state is divided into surprise,happiness,fear,disgust,sadness,and angry,neutral expression.Fig.3 shows the engagement level based on the facial expression in collaborative learning activities.
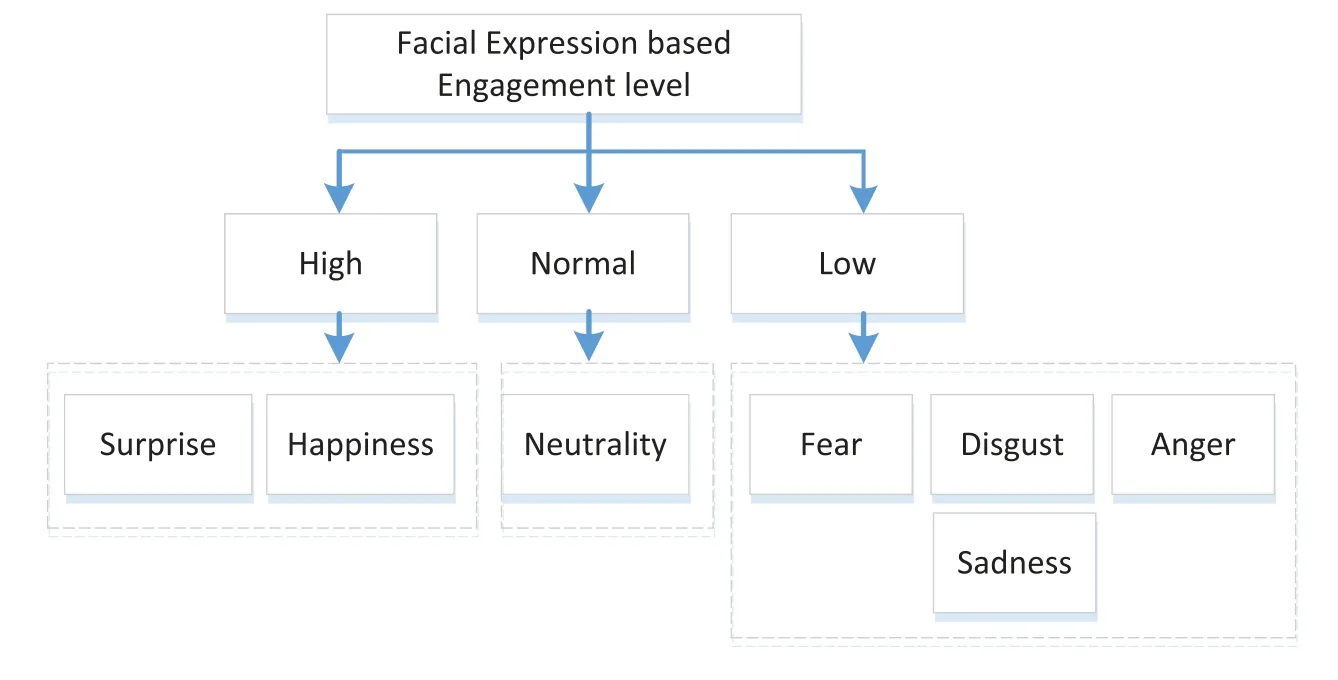
Figure 3:Facial expression-based engagement level
The emotional result is computed as follows:

Among them,ωiit is the weight of the emotion network outputoi. Since students rarely show extremely facial expressions,such as sadness,fear,etc.,Efaceshould be formulated by weighted seven emotions.
3.3 Gaze Estimation Model
The gaze is a continuous signal,so we use the Bidirectional Long Short-Term Memory Capsules(Bilstm)to capture temporal information.A 7-frame image sequence is used to predict the gaze of the central frame.Fig.4 is a gaze estimate architecture.In each frame,the image uses CNN firstly to get high-level features with Dimensionality 256.Then,These Features are input to a bidirectional LSTM network with two layers.Finally,all vectors and features are input into a full connecting layer,which outputs the gaze prediction and an error quantile estimation.
Fig.4 shows the direction of the gaze predictive model for the subject who stands straightly in front of the camera.An ImageNet-pretrained ResNet-18 is firstly used to capture the high-level features from the crop of each frame.The model is trained using an Adam optimizer with 0.0001 learning rate.
Since the collaborative learning setting is in unconstrained environments,the prediction is likely to degrade while the eye in the image deviates from the front of the camera.To model error bounds,a pinball loss function to predict error quantiles.For an image,we estimate the expected gaze direction(as shown in Fig.5)as well as the cone of error with a 10%-90%ground truth quantile boundary.
The output of the network is the gaze direction in spherical coordinates which is shown as

whereθ=-arctanandφ=arcsingy.
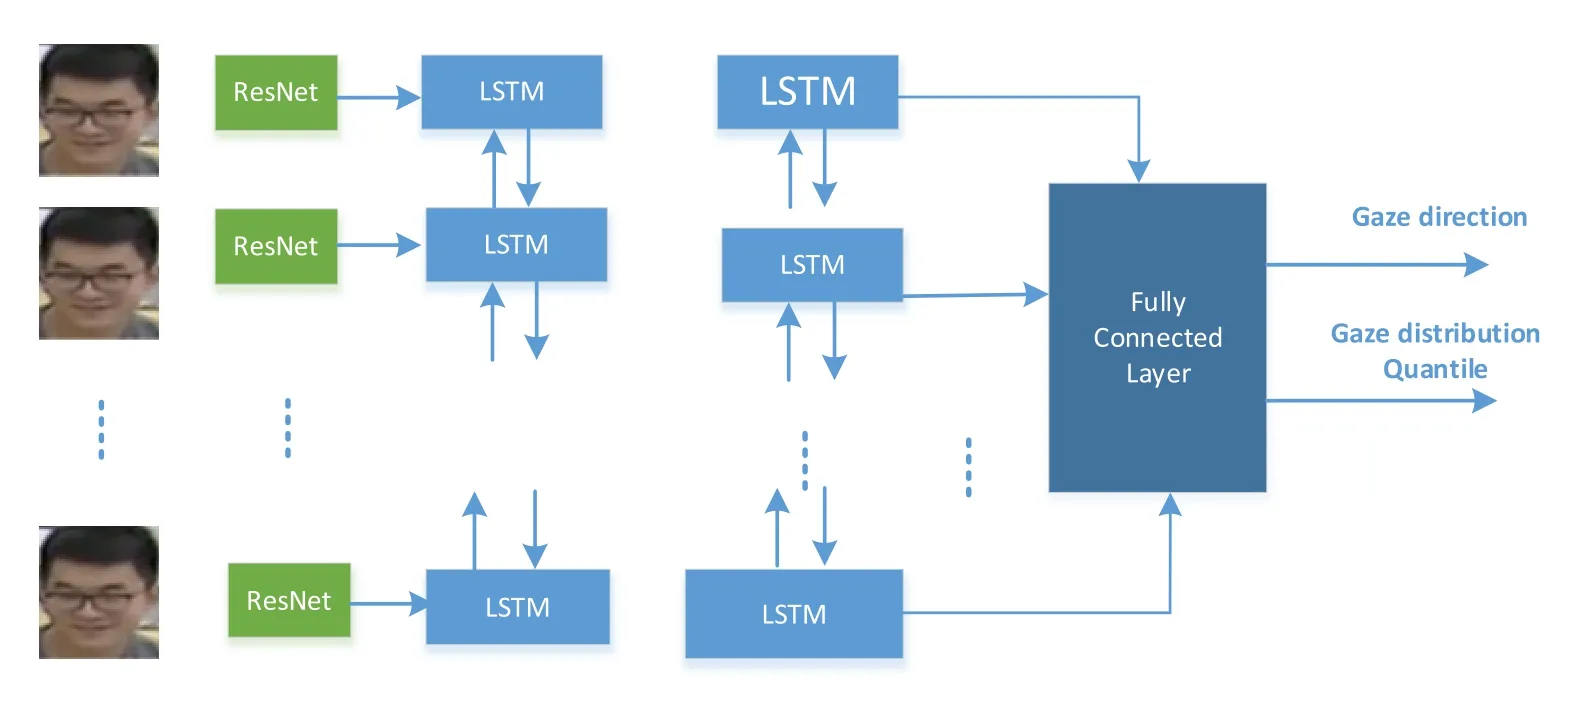
Figure 4:Gaze estimation model architecture
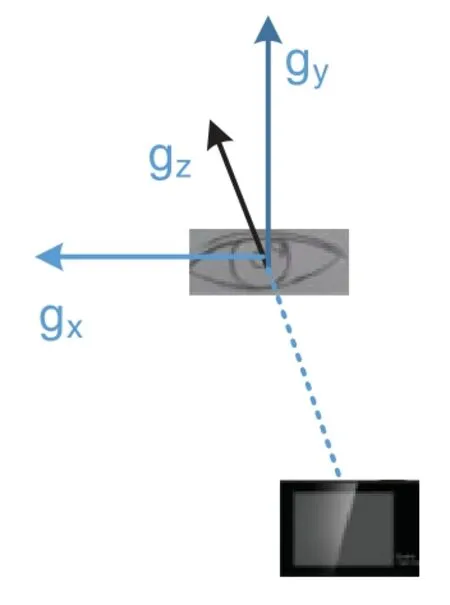
Figure 5:The coordinate system of the eye
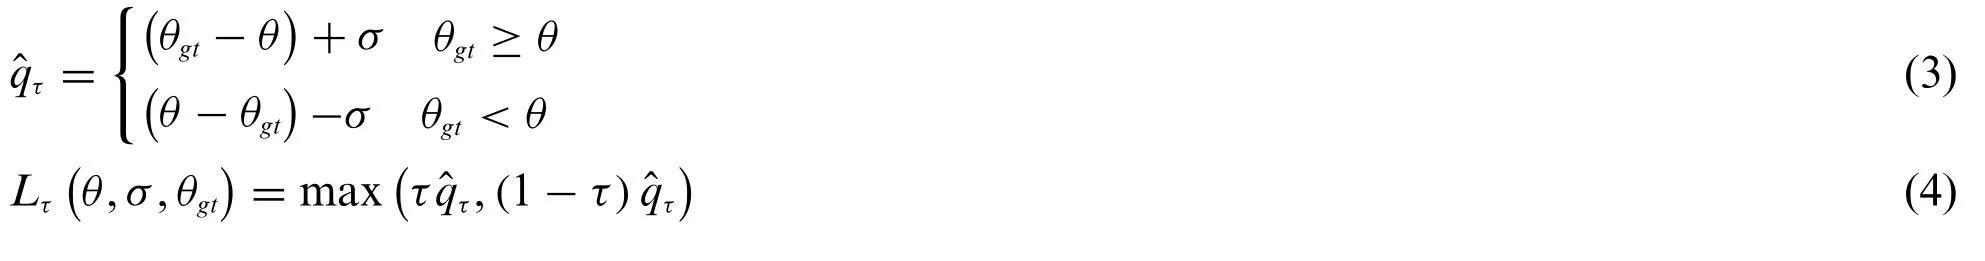
Then we use the pre-known ground-truth gaze vector in the eye coordinate system to compute the loss.σis the offset from the expected gaze with the quantileτ.Soθ+σandφ+σrepresent the 90%quantile,whileθ-σandθ-σrepresent 10%.
Ify=(θgt,φgt),the lossLτfor the quantileτcorrespondence to theθis shown as:
In the scene of collaborative learning,the position of the camera is relatively fixed to the place of the subject.For the sake of simplicity,the camera of this study is set in front of a group of students at a constant distance.Assume the faces,the notebook on the table,and the front screen as sensitive target areas in advance.By calculating the direction of the students and the relative proximity to the target,we can identify whether or not the student’s gaze is fixed on the target.The engagement of students is judged by statistics of data over some time.
4 Experiment
4.1 Experiment Setup
The subjects of this study are second-year undergraduate students in Chinese universities,with an age range of 18-20.This course is a seminar for computer science students.The experiment tool is the fixed cameras in the classroom.The classroom is equipped with 8 cameras to record the course scene from different directions.The experimental collection tool is an automatic recording system connected with the cloud platform.A 45-min video of the class is recorded.All participants gave written consent for the images or videos used for research.
4.2 The Experimental Process
In a seminar,students were grouped into 3-5 persons.They were asked to analyze a sequence of problems on the screen.One person in the group would be selected randomly by the teacher to answer questions related to the topic discussed,and the other ones’scores were graded by the person’s answers.Given this requirement,collaborative learning among group members meets everyone’s needs.
When the learner’s position was fixed,the effective targets for their gaze were:the faces of their peers, the study materials on the desk, and the two projection screens at the front of the classroom(which displayed the requirements and prompts for discussion). In the experiment, we randomly captured a representative video frame or multiple adjacent frames at time intervals and analyzed them.Using these data,we can get the direction of students’gazes,and count the frequency and duration of learners’gazes.
Fig.6 is an example of a collaborative learning setting.We found that group members spent most of their time looking at the screen to analyze the problem,or gazing at their peers’faces to discuss the problem.Fig.6a shows two members looking at one of the two-screen blackboards,the other person looking at the face of one member outside the image. Fig.6b shows two members looking at each other in discussion while the third member looked at the screen of the blackboard.
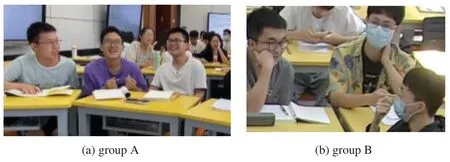
Figure 6:An example of collaborative learning
4.3 Classification of Effective Facial Expression
Since the members in Fig.6b wearing masks or occluding parts of the face,we adopted the left three members in Fig.6a for experiment illustration.
After the human face frame is detected by the MTCNN network,the corresponding face image is extracted.Then they are sent to the Facial Expression Network to detect the student expression.The experiment result is shown as follows.
Table 3 shows the emotional result of Fig.7.
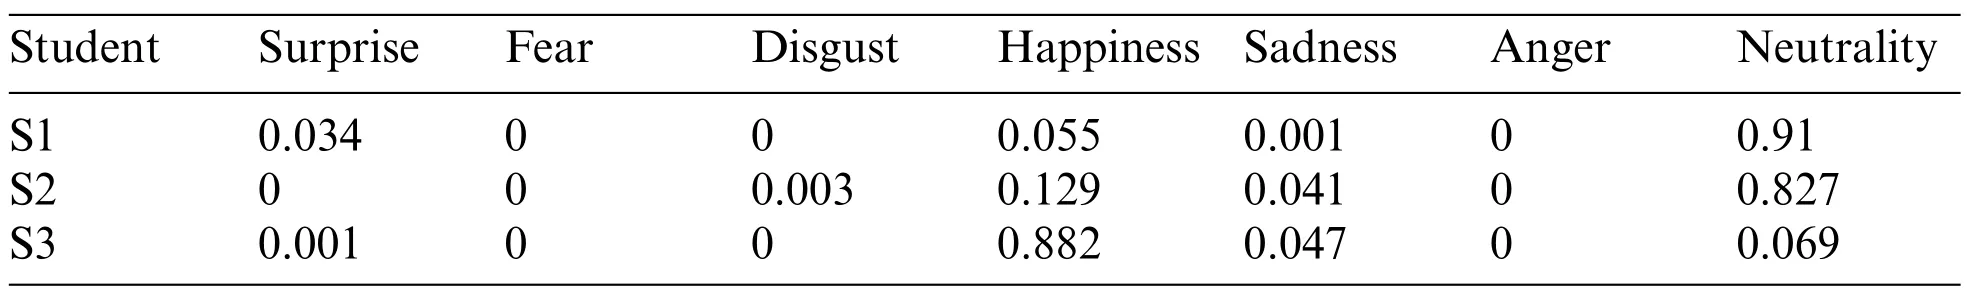
Table 3: The emotion result of Fig.7
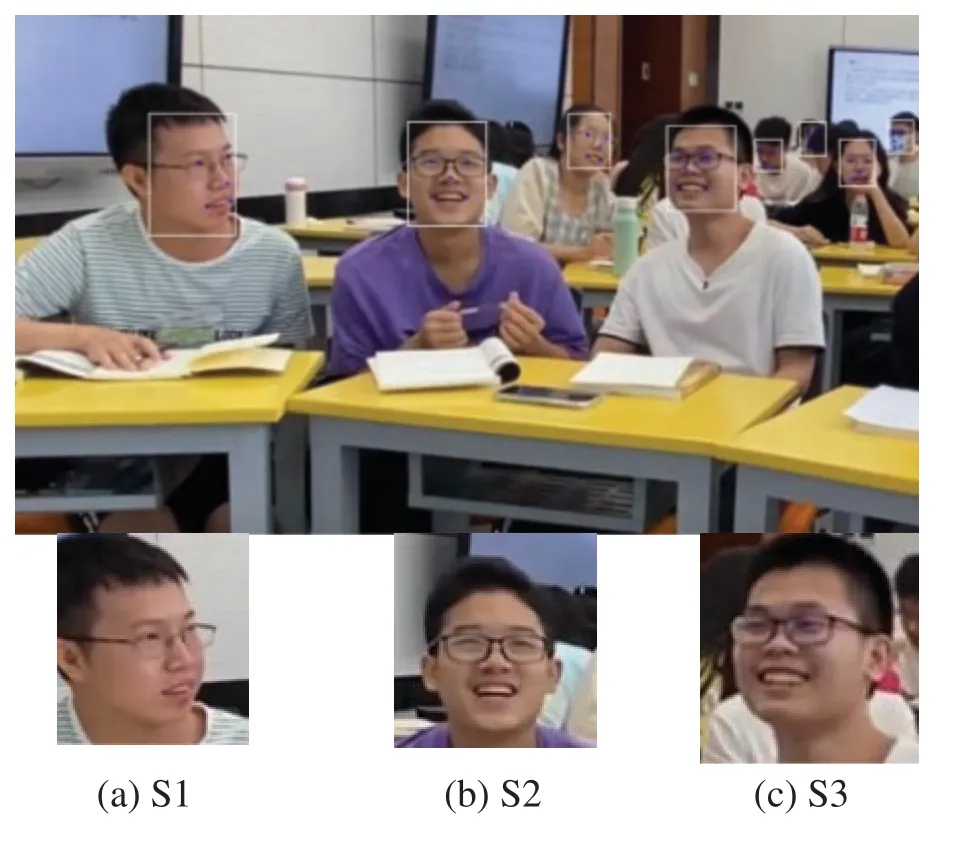
Figure 7:Face detection by the MTCNN network
4.4 Gaze Direction Estimation
This experiment gains 3-dimension rotation(yaw,pitch,and roll),so the gaze direction and gaze targets can be estimated.Fig.8 offers a result of gaze directions and the corresponding values which are given in Table 4.
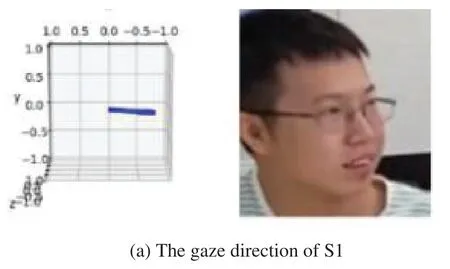
Figure 8: (Continued)
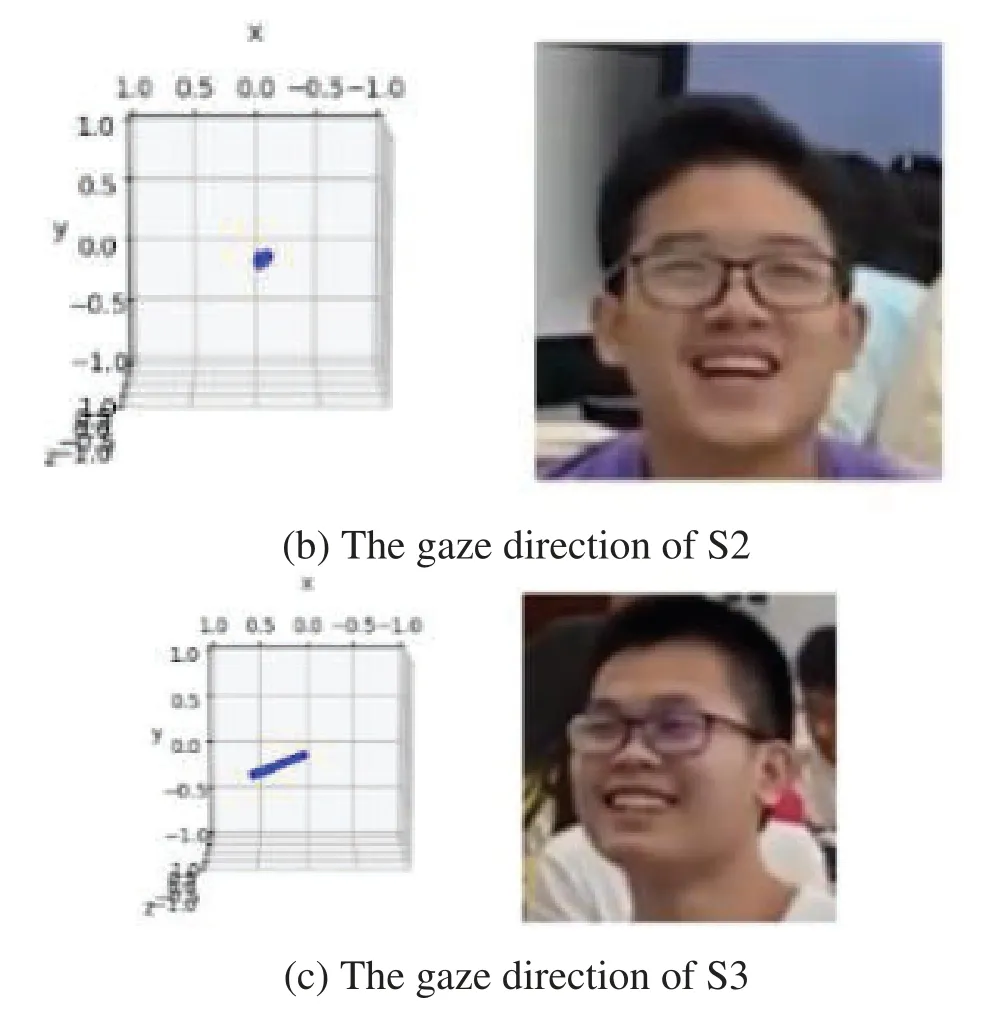
Figure 8:Gaze direction estimation of the students
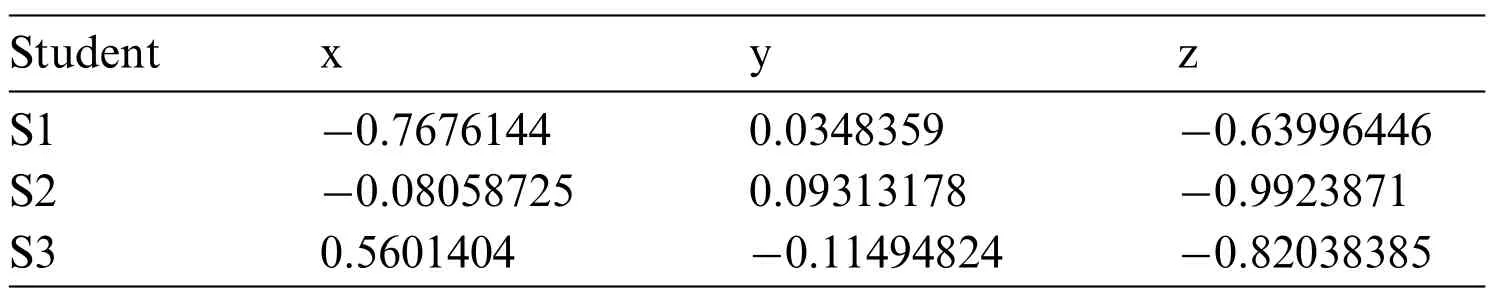
Table 4: The gaze direction of Fig.8
Fig.9 shows an example of the detection result of the gaze target.
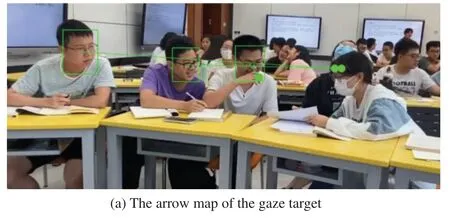
Figure 9: (Continued)
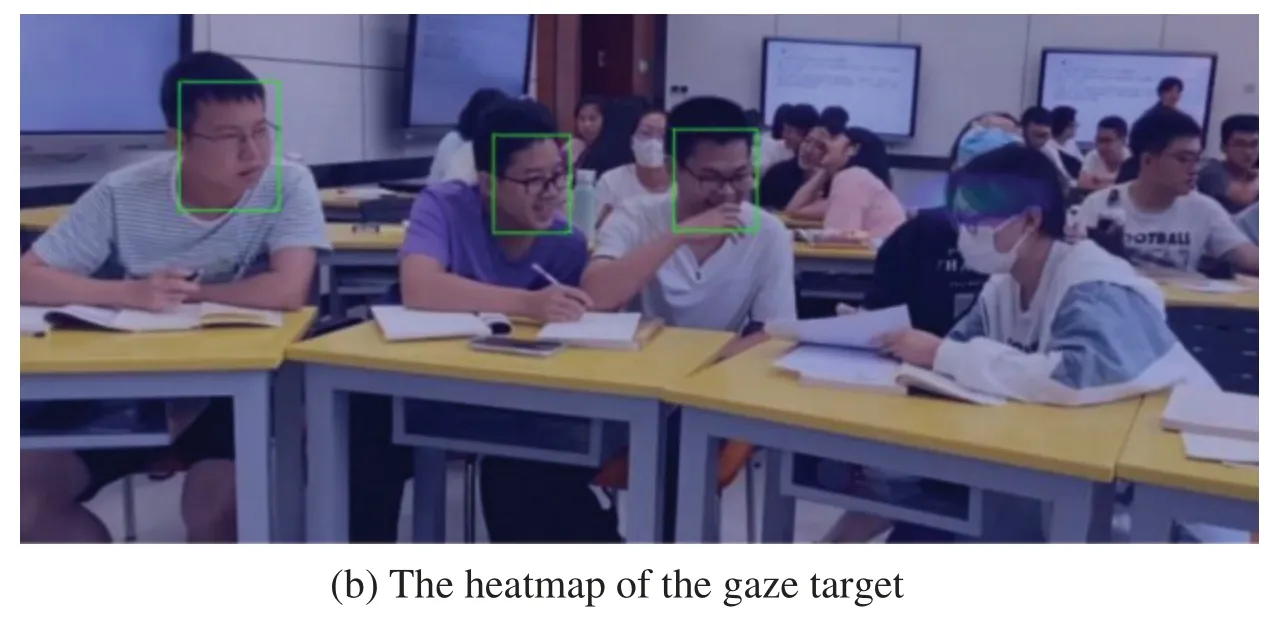
Figure 9:The gaze target prediction
4.5 Joint Facial Expression and Gaze Direction for Engagement Evaluation
Fuzzy logic refers to the way of reasoning that imitates the judgment of uncertainty and reasoning of the human brain.For the system whose model is unknown or uncertain,fuzzy sets and fuzzy rules are used for reasoning, to express qualitative experience, to simulate the way of the human brain,to implement fuzzy comprehensive judgment and reasoning to solve the regular fuzzy information problems which are difficult to deal with by conventional methods.Fuzzy logic is good at expressing qualitative knowledge and experience with unclear boundaries. Using the concept of membership function,fuzzy logic distinguishes fuzzy sets,deals with fuzzy relations,and simulates the human brain to implement regular reasoning.
We use two fuzzy logics A and B to fuse the estimates of facial expression and gaze in Fig.10.The average value of logic A was 0.74,and the Pearson value was 0.97.The average value of logic B is 0.88 and the Pearson value is 0.99,which can well describe students’final learning effectiveness.
After the multi-modal deep neural network(MDNN)is employed,the students’engagement can be predicted. To evaluate the difference between the real results. After the course is completed, the teacher gives 20 questions.The topic is very relevant to this course’s collaborative content,of which the difficulty level is average distribution.We make statistical comparisons for the average and individual scores of the whole class.
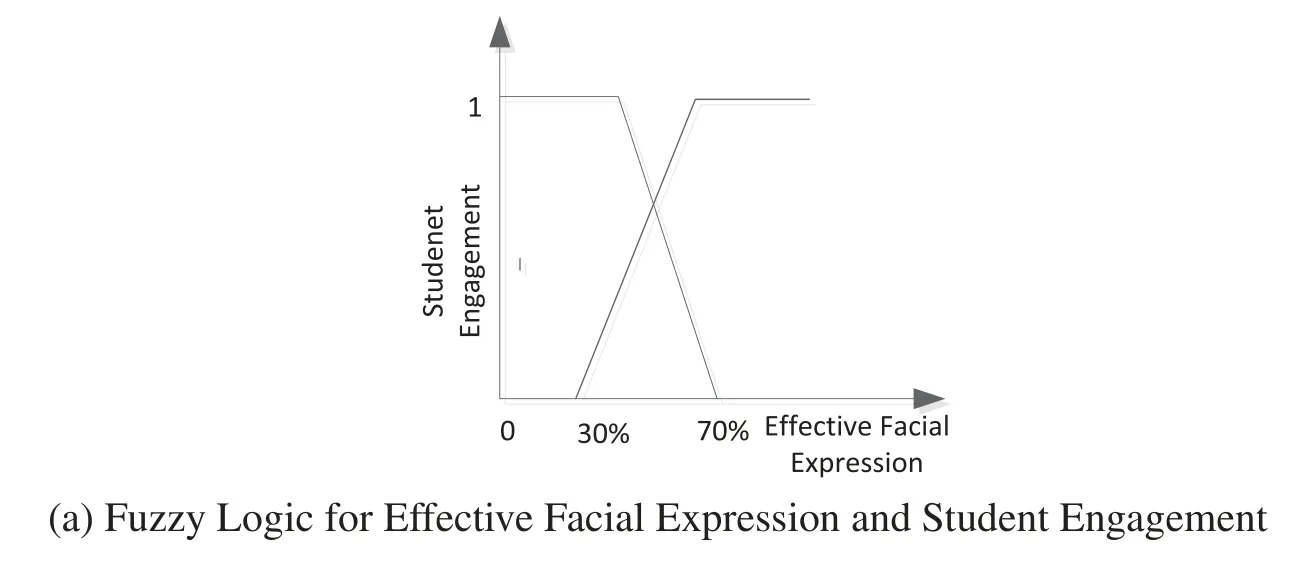
Figure 10: (Continued)
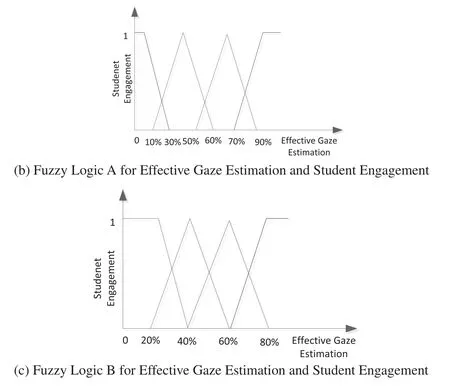
Figure 10:Fuzzy logic
The segment cross point of membership for expression recognition is 50%. The membership function boundaries of fuzzy Logic A for engagement(Low,A little Low,A little high,high)are(20%,55%,80%),and Logic B(30%,50%,70%).
The result is shown in Table 5.Our results show that fuzzy Logic B is more correlated with posttest values,which indicates that people’s gaze frequency has a concentrated distribution.
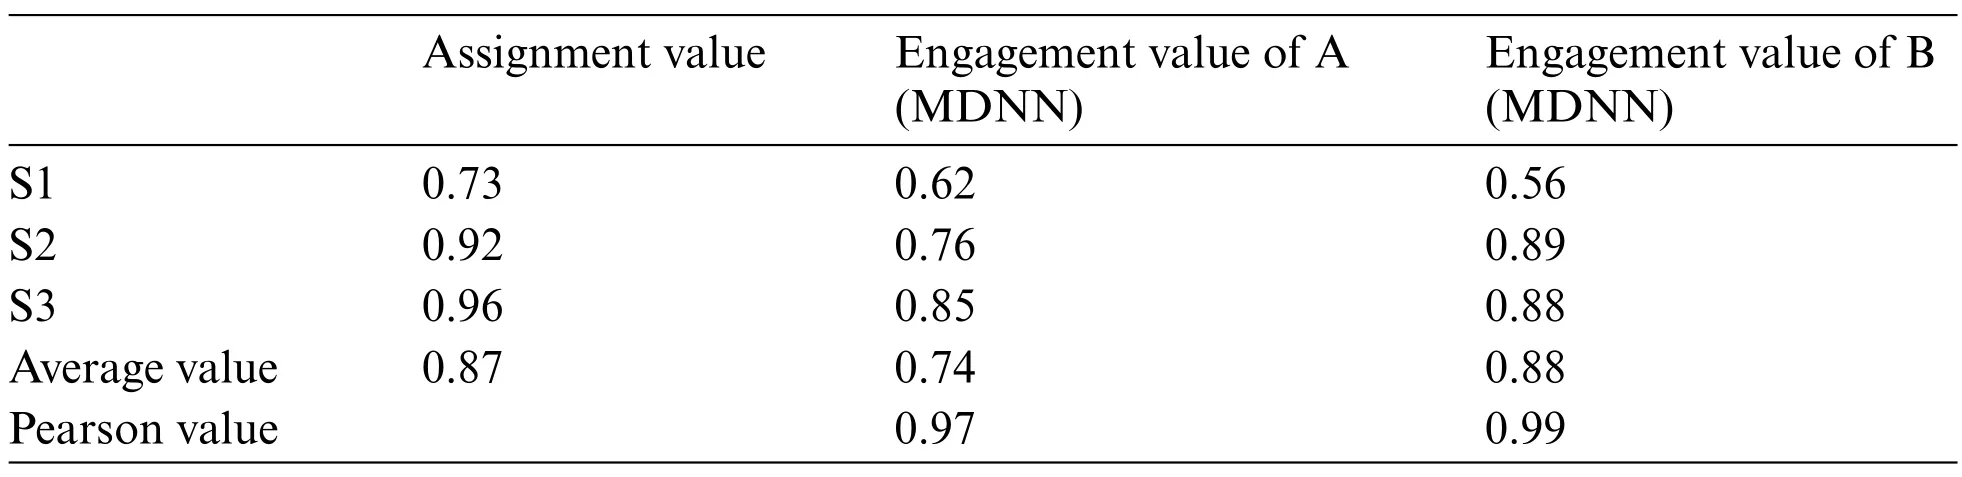
Table 5: The result of engagement
1)Comparative study
For comparing the MDNN network with other works, we took results from the following method in Table 6.It shows our results in comparison with other methods in the detection of student engagement using our class video.
Facial Expression[38]is acquired by using only facial expressions.
Liao et al.[17]directly judged engagement from students’facial expressions.
Abedi et al.[18]combines RestNet+TCN for end-to-end engagement prediction.
Gaze Only[39]uses the gaze in a frame to predict engagement.
Gaze+LSTM[39]uses the gaze in a sequence of frames to predict engagement.
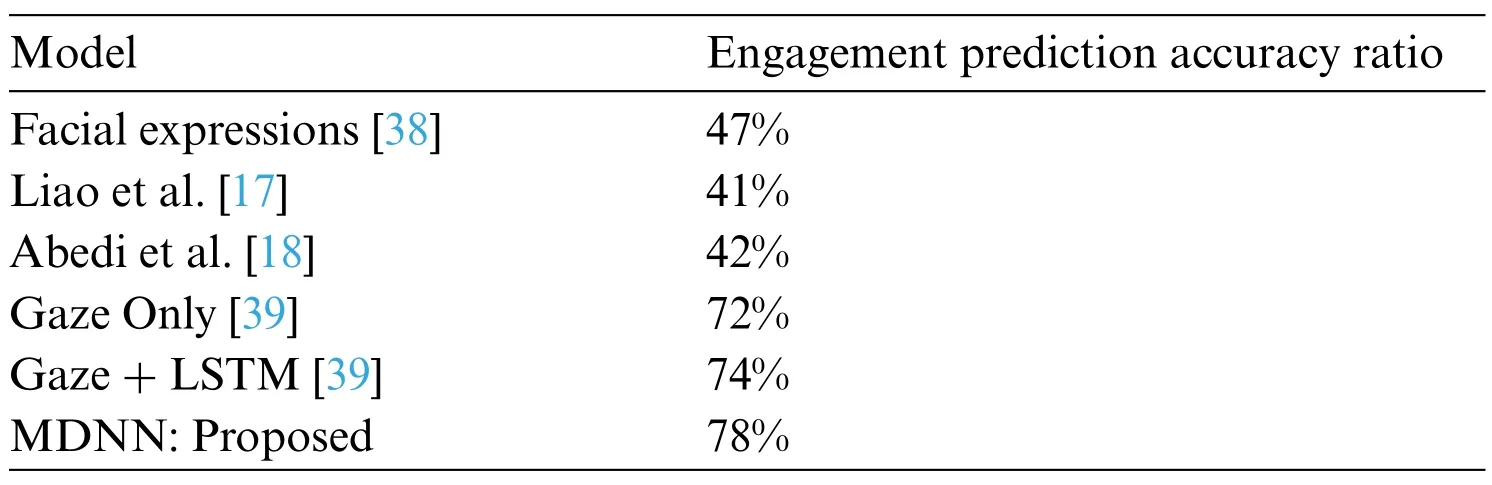
Table 6: Quantitative result over the real dataset
Although Facial Expression[38]has a relatively high accuracy rate in the data set with front faces.However,the classification effect of facial expression is not ideal when the human body turned sideways during the discussion.
Liao et al. [17] predicted engagement directly from students’facial expressions. However, the accuracy of the engagement was low because the students could not keep their faces facing the camera.
Abedi et al.[18]judged students’engagement levels mainly based on the front faces.But mistakes can occur when students look down and turn sideways to discuss such states.
Gaze Only[39]can know what the target of attention is through gaze detection.Because it cannot detect expressions,useful information contained in facial expressions like“smile”is ignored.
Gaze + LSTM [39] use the temporal information of gaze to predict the target that people are paying attention to. However, it is not possible to judge engagement through facial expressions immediately.
MDNN uses both facial expression and gaze estimation;and integrates temporal information of gaze.The results show that this method has the best effect.
2)Ablation study analysis
To prove and better understand the importance of each module in the prosed MDNN,we test the performance of the different modules of MDNN.
These constructed networks are as follows:
1)Weighted Facial Expression:only introduce different weights in the classification of emotions for different facial expressions without Gaze estimation.2)Gaze+LSTM:only use the effective gaze without facial expressions;and 3)Weighted Facial Expression+Gaze+LSTM+Fuzzy Fuse A:first use the Facial expression and gaze estimation to detect emotions and the targets being gazed, then fuse the results with Fuzzy Logic A.
We make statistics of the total number of video frames and use different modules to detect them.It can be seen from Table 7 that the detection effect is the best by integrating facial expression and gaze estimation modules.
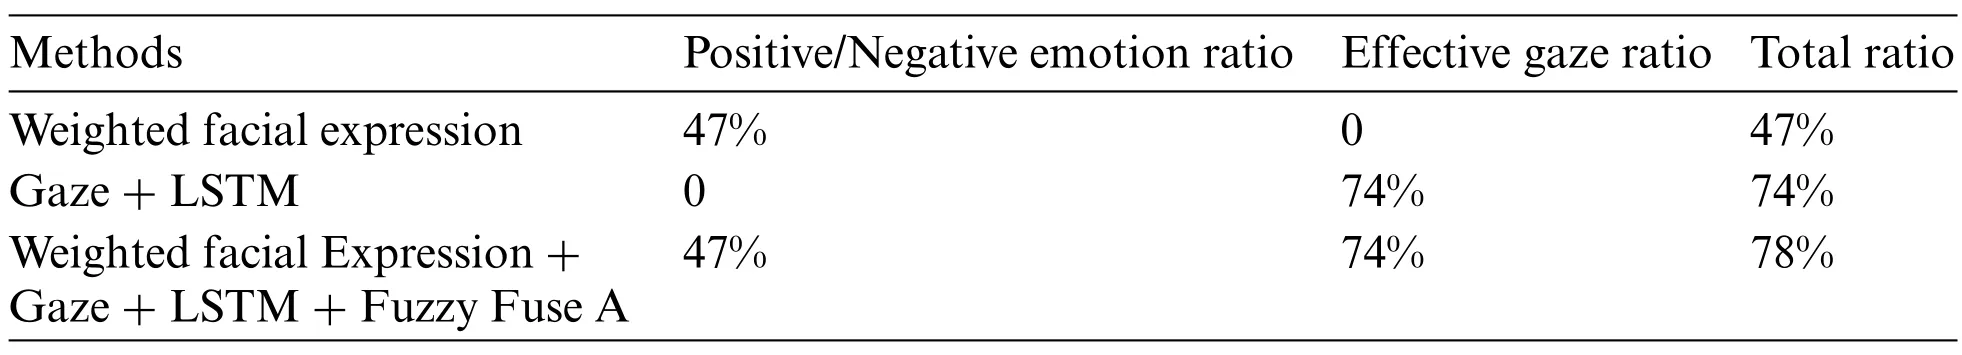
Table 7: Ablation study on collaborative learning dataset
5 Discussion
Effective gaze ratio.In collaborative learning, the target gaze ratio is defined as the Effective Gaze Ratio, which reveals valuable information about learners, such as gazing at teammates’faces,teammates’sketches,the screen in front of them,the teacher,etc.[40,41].Few studies have investigated computer vision-based approaches to better measure and apply in unconstrained scenarios such as collaborative learning. Compared with other methods using traditional high-cost eye-tracking equipment[42],our method can automatically capture effective gaze ratios through a simple camera throughout the learning process.
Targets gazed ratio and post-test scores.The study showed a significant positive linear relationship between the target gaze ratio and students’post-test scores.Students who focus on effective targets for longer periods during the learning process are more likely to score higher on post-test tests.This finding is consistent with previous research on the positive effects of gaze on learning outcomes[43,44].
6 Limitations and Future Work
There is some space for improvement in the future. 1) We only counted the gaze frequency of students on certain targets.However,due to individual differences,some students may look up to the sky while thinking,which would be identified as unengagement.How to judge the learning effect based on individual differences is a direction in the future.2)Turning the body and blocking the face caused a decrease in expression and gaze judgment accuracy. In the future, we will combine more effective AI computer vision recognition algorithms to improve facial expressions [38,45,46], and head/body posture estimation[47,48]to achieve a more comprehensive explanation of the learning process This study provides an assessment tool for collaborative learning environments based on facial and gaze information,and provides implications for the field of educational technology.
7 Conclusion
In a collaborative learning environment, students interact with each other and share aspects with their partners. Students’gaze direction and facial expression are unconscious behaviors when communicating with each other. Studying this nonverbal behavior in the classroom can provide important feedback to teachers. It is important to analyze student behavior and understand one’s focus.
In this paper, we proposed an automatic assessment method of student engagement based on computer vision. The method uses gaze and facial expression information to predict gaze objects and identify emotions. We test our proposed method by extracting gaze and facial features to assess learning achievements. The results showed that students with higher gaze ratios and positive expressions performed better on tests as determined by our automated assessment method.
Funding Statement:This work is supported by the National Natural Science Foundation of China(No. 61977031) and XPCC’s Plan for Tackling Key Scientific and Technological Problems in Key Fields(No.2021AB023-3).
Conflicts of Interest:The authors declare they have no conflicts of interest to report regarding the present study.
 Computer Modeling In Engineering&Sciences2023年7期
- Computer Modeling In Engineering&Sciences的其它文章
- Edge Intelligence with Distributed Processing of DNNs:A Survey
- Turbulent Kinetic Energy of Flow during Inhale and Exhale to Characterize the Severity of Obstructive Sleep Apnea Patient
- The Effects of the Particle Size Ratio on the Behaviors of Binary Granular Materials
- A Novel Light Weight CNN Framework Integrated with Marine Predator Optimization for the Assessment of Tear Film-Lipid Layer Patterns
- Implementation of Rapid Code Transformation Process Using Deep Learning Approaches
- A New Hybrid Hierarchical Parallel Algorithm to Enhance the Performance of Large-Scale Structural Analysis Based on Heterogeneous Multicore Clusters