
Direct field-to-pattern monolithic design of holographic metasurface via residual encoderdecoder convolutional neural network
2023-11-08 07:55RuichaoZhuJiafuWangTianshuoQiuDingkangYangBoFengZuntianChuTonghaoLiuYajuanHanHongyaChenandShaoboQu
Opto-Electronic Advances 2023年8期
Ruichao Zhu, Jiafu Wang, Tianshuo Qiu, Dingkang Yang, Bo Feng,Zuntian Chu, Tonghao Liu, Yajuan Han, Hongya Chen and Shaobo Qu
Keywords: metasurface; holography; complex amplitude; deep learning; monolithic design
Introduction
Metasurfaces, as two-dimensional metamaterials, display fascinating ability in electromagnetic (EM) modulation within a sub-wavelength scale, opening up a new way for manipulating the properties of EM wave in a plane1-3. Recently, versatile metasurfaces consisting of ingenious meta-atoms with systematic arrangement have sprung up like mushrooms for shaping the EM fields by manipulating amplitude4, phase5, wavefront6, and so on.Owing to the flexible modulation of EM wave, metasurfaces have spawned a number of enchanting applications,such as perfect absorbers7,8, cloaking devices9,10, planar meta-lens11-14and meta-hologram15-17. The emergence of metasurface exhibits extraordinary capabilities in developing and improving optical and microwave devices.
Benefitting from the advantages of metasurfaces,holograms can be generated according to the positions and local scattering characteristics of meta-atoms arranged on a plane, which can be called metasurface holography18-20. With the unprecedented ability of reconstructing wavefronts, metasurface holography has attracted a lot of interest, which is opening new frontiers for microwave and optical devices18,19. Many fascinating works are springing up, which have greatly enriched the design and application of holograms. According to the information modulation mode, metasurface holography can be roughly divided into three categories: phase-only,amplitude-only and complex-amplitude metasurface holography21-23. Phase-only hologram engineers phase information in the image plane with amplitude as a constant, in which Gerchberg-Saxton (GS) is one of the most representative algorithms24-32. Phase profiles are modulated by various mechanisms, such as propagation phase24-26, geometric phase27-29, detour phase30-32, etc.,which exhibits a flexible control strategy, thus enriching the tailoring of the image information. However, the oblivion of amplitude will compromise the imaging quality with noises that may unexpectedly appear on the presetting image. Therefore, the amplitude modulation is also introduced to engineer hologram. Similarly, amplitudeonly metasurface holography can engineer amplitude information via coding the local transmission or reflection amplitude33,34. Furthermore, combined with amplitude and phase, complex-amplitude holographic metasurfaces (CAHMs) are introduced to improve the imaging quality by carrying both phase and amplitude information35-37. The phase and amplitude profiles of metasurface can be deduced by Huygens-Fresnel theory.Rayleigh-Sommerfeld (RS) diffraction theory is a common method to design CAHMs38-40. However, the theoretical results calculated by diffraction theory are different from actual situation, which may be caused by unit coupling and unit error. Therefore, further numerical simulations are carried out to verify the hologram, thus causing a consumption of computing resources and the increased complexity of design. Fortunately, the popularity of machine learning provides an opportunity to overcome it.
Recently, machine learning has been widely used in metasurface design and applications41-43. In metasurface design, the commonest design methods are applied at the level of microstructure including forward and inverse design of meta-atoms, that is, the EM response can be directly inferred from the structure and the geometrical parameters can be deduced from the EM spectrum44-51.The applications of machine learning empowered metaatoms effectively accelerate the design efficiency of metasurfaces by superseding the simulation process. In metasurface applications, machine learning can assist the metasurface to perceive the external environment, thus making the metasurface more intelligent to approach the usage scenario52-54. Moreover, another application of machine learning-assisted design approaches has also been proposed to design the wavefront, including the prediction of far-field or near-field distributions via neural networks without numerical simulation55-59. At the level of microstructure, the meta-atoms with specified EM responses can be fast designed by machine learning. Furthermore, the optimized meta-atoms are arranged according to the specified profiles to achieve specified function, which means that coupling between units is ignored. Therefore, the design of metasurface from a macro perspective is correspondingly proposed. By analyzing the local field distributions in space, neural network can accurately explore their internal laws and reconstruct the mapping from local field to modulator.Homoplastically, the configuration of metasurface holography also has the potential to be monolithically generated by machine learning. Metasurfaces formed by diverse meta-atoms with different arrangements will synthetically affect the electric field in space. Therefore,metasurface design from a macroscopic perspective by analyzing field and pattern will further improve the design efficiency and accuracy.
In this work, we proposed a monolithic design approach for CAHMs. Different from traditional unitbased optimization and layout, the metasurface can be monolithically generated from the electric field distributions by the deep learning network. The monolithic arrangement of metasurface is directly generated by the target electric field distribution, thus reducing the coupling between elements to simplify and accelerate the hologram metasurface design. Specifically, a residual encoder-decoder convolutional neural network (REDCNN)is employed to establish the mapping between the electric field distributions and input images. Instead of traditional Huygens-Fresnel principle and numerical simulation, the given electric field distribution can be fast converted to complex-amplitude profiles via the trained REDCNN. The schematic diagram of this work is shown in Fig. 1. Firstly, RS diffraction theory is used for generating the theoretical electric field distribution with the input image. The input images are derived from MNIST,a classic dataset of handwritten numbers. The theoretical electric field distribution and input image are collected for training the REDCNN, which is preliminarily set as pretrained model. Then the metasurfaces with the theoretical complex-amplitude profiles are simulated to obtain the electric field distributions as new dataset. The pretrained model can be migrated to the new dataset by transfer learning framework, and thus only part of the input images is used to establish high-precision electric field mapping. After statistics, the normalized mean pixel error of trained REDCNN model is about 3%, meaning the high similarity between the real images and predicted images. The monolithic design method mainly focuses on the monolithic pattern of metasurface without considering the attributes of the specific elements, which will simplify the complexity of metasurface design. Also,monolithic design is to design metasurfaces at the macro level. As verification, an input image is predicted by the electric field distribution, and the corresponding metasurface is modeled. The metasurface prototypes are fabricated, simulated and measured to validate the inverse model. The reconstructed electric field of reverse-engineered metasurface exhibits high similarity to the given electric field distribution, which demonstrates the effectiveness of our model. Importantly, this work provides a monolithic design method for CAHMs, which can be easily extended to the metasurface reverse engineer of other properties.
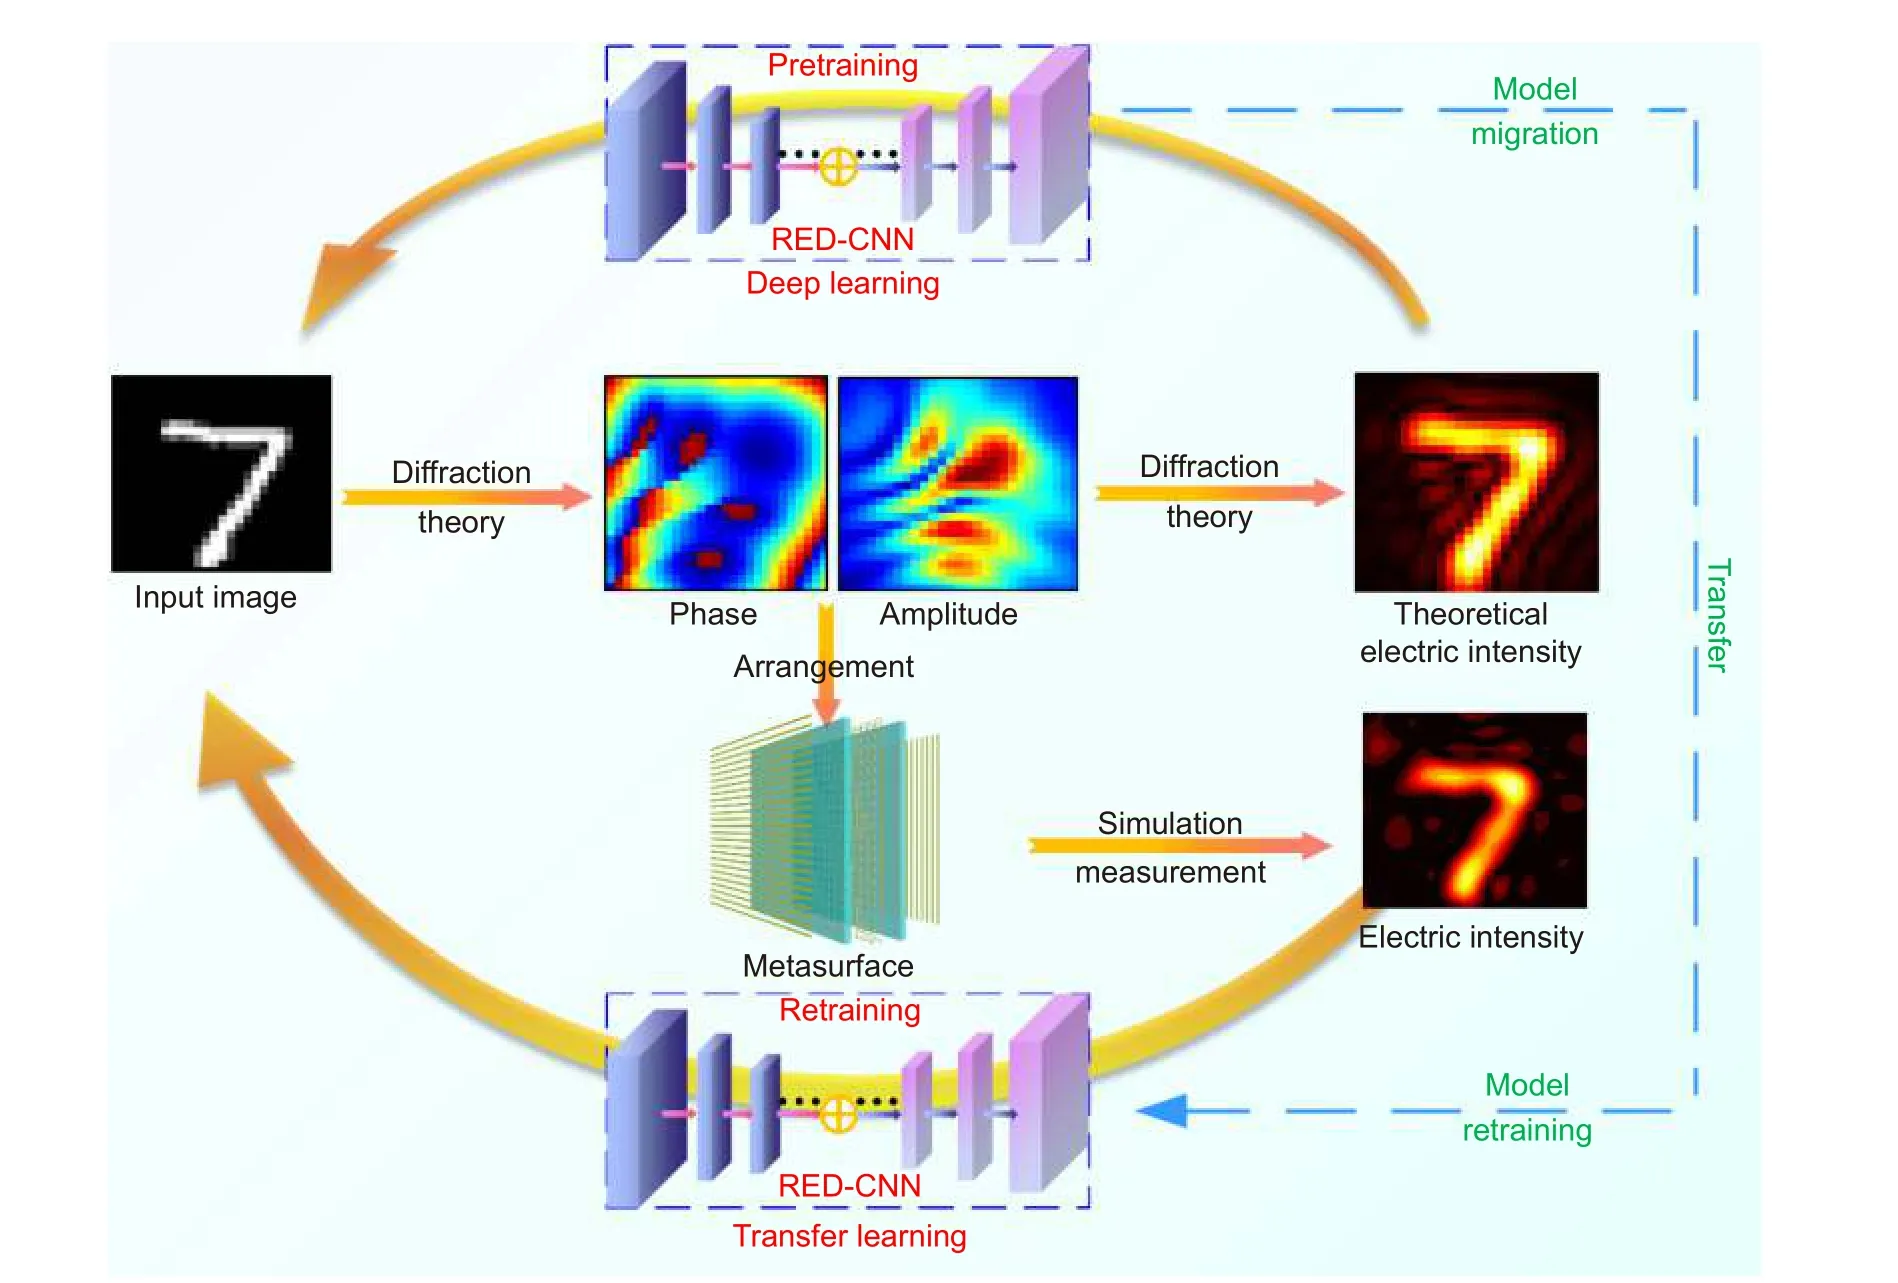
Fig. 1 | Schematic diagram of CAHM monolithic design via REDCNN model
Holography metasurface monolithic design
REDCNN design
Here, the REDCNN is employed as machine learning architecture to establish the mapping between the electric distributions and input images. As the name of the model suggests, REDCNN is based on encoder-decoder convolutional neural network with skipped residual connection. This architecture can achieve image reconstruction through feature compression and reconstruction, which has achieved certain results in medical image processing60. Owning to the image-to-image framework can be easily transplanted to another scenario, this work followed and applied this framework. The architecture of REDCNN is shown in Fig. 2(a), which includes 4 convolution down-sampling layers, 4 transposed convolution up-sampling layers, and 1 convolution full-connection layer. The electric field distribution is set as input and input image is output of REDCNN. As a down-sampling method, convolution layer can effectively extract highdimensional features of images. The schematic diagram of feature transfer in the encoder is shown in Fig. 2(d),which can be seen that different feature information is extracted from different feature channels. For example,some feature channels focus on foreground information,while others may focus on background information.Even edge, brightness and other features are extracted into different feature channels. After the compression of the first four convolution layers, the feature graph with dimension [20×20] is finally compressed. The downsampling process under convolution is shown in Fig.2(b). In the down-sampling process, batch normalization is applied to normalize the data set and average pooling layer is introduced to reduce the effect of singularities. Batch normalization can be expressed as Eq. (1).

Fig. 2 | REDCNN model design and feature extraction. (a) The architecture and dimension of REDCNN model. (b) The downsampling process of feature encoder. (c) The upsampling process of feature decoder. (d) Feature transfer of different channels in encoding process. (e) Feature transfer of different channels in decoding process
wherexandyare input and output data,U(x) andVar(x) are expectation and variance of training data,εis a constant to avoid 0 in the denominator.AandBare the weight parameters. Since it is a nonlinear mapping, Rectified Linear Unit (ReLU) is used as the activation function which is shown in Eq. (2).
in whichxis the input data.f(x) is output of neuron.Correspondingly, the up-sampling process under transposed convolution is shown in Fig. 2(c), in which this block also includes batch normalization, average pooling layer and ReLU activation function. The schematic diagram of feature transfer in the decoder is shown in Fig.2(e). After the restructuration of the four transposed convolution layers, the feature graph with dimension[28×28] is finally compressed. The last convolution layer realizes two-dimensional fully connection through 1×1 convolution kernel to adjust the output of the image.Henceforth, the input image can be reconstructed by REDCNN.
Network training
The REDCNN is trained twice here, that is, deep learning pretraining and transfer learning retraining. In this work, the images are extracted from MNIST dataset. The MNIST dataset contains the images with pixels [28 × 28]containing handwritten digits across 10 categories61.Firstly, the electric field distributions are collected by RS diffraction theory, and the initial dataset of theoretical electric field and input image is achieved. The phase and amplitude profiles calculation and electric field reconstruction can be obtained by RS diffraction theory,whose relevant equations are supplemented in Supplementary information Section 1. The collected dataset is used to train REDCNN with the training process shown in Fig. 3(a), in which the loss function value appears a downward trend. The initial MAE loss value of deep learning is 29.6, that is, 11.6% normalized mean pixel error. Mean absolute error (MAE) function is selected as the loss function which can be expressed as Eq. (3).

Fig. 3 | Training and test of the REDCNN model. (a) The variation of MAE loss value in deep learning process. (b) The variation of MAE loss value in transfer learning process. (c) The error histogram of deep learning in training set. (d) The error histogram of deep learning in test set. (e)The error histogram of transfer learning in training set. (f) The error histogram of transfer learning in test set.
in whichnis the count of data,p(xi) is the predicted value of model,yiis the true value. After training, the MAE loss of gray image pixels reached 4.6, that is, 1.8%normalized mean pixel error, which can demonstrate the model can reconstruct the image with less loss. We define the normalized mean pixel error as the relative variation in the range of pixel changes, which can be calculate by Eq. (4).
wherePerris normalized mean pixel error.MAEis the mean absolute error between the predicted value and true value.Pmaxis the max value of the range of pixel, in which the pixel value in gray image varies between [0,255]. Moreover, the histograms of error distribution in training set and test set are shown in Fig. 3(c) and 3(d),in which the pixel error of most point is close to 0. Subsequently, the trained REDCNN is set as pretrained model for transfer learning. Part of input image is selected to simulate the electric field distributions. The simulated electric field distributions are collected as new dataset. Then, the pretrained REDCNN is migrated to retrain as transfer learning framework. The input and output of new dataset are the simulated electric fields and input images. The process of transfer learning retraining is shown in Fig. 3(b), where the gray value of pixel MAE loss dropped to 7.8 from 13.9. The normalized mean pixel error finally reached to 3%. Notably, the initial loss value has already reached 13.9, normalized mean pixel error is 5.5%. Compared to the initial loss of deep learning, the initial loss value is reduced by 6.1%, which fully demonstrates the advantages of transfer learning retraining framework. The histograms of error distribution in training set and test set by transfer learning are shown in Fig. 3(e) and 3(f), where the pixel errors of most points are also close to 0. The error histograms fully demonstrate that the model can accurately predict images with less error. Moreover, the convolutional neural network(CNN) and encoder-decoder convolutional neural network (EDCNN) as control group are also trained respectively to verify the superiority of REDCNN, which are supplemented in Supplementary information Section 2. The statistical results convincingly prove the effectiveness of this framework.
Metasurface monolithic design and simulation
In order to further demonstrate the trained REDCNN, a metasurface in dataset is selected to verify our design.Firstly, the simulated electric field distribution is fed into the trained REDCNN as input. After this operation,the predicted gray image is output. Figure 4(a) illustrates the gray image of the input image, in which the real image is similar to predicted image with less error. The phase and amplitude profiles are calculated by RS diffraction theory, as shown in Fig. 4(b) and 4(c). The phase and amplitude of predicted image exhibit high similarity to real image. Figure 4(d) illustrates the theoretical electric field which is calculated by RS diffraction.The electric intensity between the real plane and predicted plane is similar. The corresponding metasurface of the predicted image is filled by meta-atoms and simulated to observe the electric field distribution. The metaatoms design is supplemented in Supplementary information Section 3. The metasurface is placed onXOYplane and the boundary conditions inX, Y, Zdirections are set to free space. The full wave simulation is carried out in CST Microwave Studio. Thex-polarized plane waves impinge on the metasurface from the +Zdirection. E-filed monitor is set to obtain the electric field distribution.TheXOYplane atZ= 50 mm is observed. The comparation of simulated results is shown in Fig. 4(e), where the similarity of electric intensity distributions demonstrated the accuracy of model. The similarity of the images is evaluated by Peak Signal-to-Noise Ratio (PSNR)and Structural SIMilarity (SSIM) respectively, which is supplemented in Supplementary information Section 4.The PSNR of the real and predicted images is 38.39 dB and the SSIM of the real and predicted images is 99.78%.According to the real and predicted images, the complex-amplitude profiles can be calculated and the metasurface can be reconstructed to generate the hologram.Furthermore, the PSNR and SSIM are also applied to evaluate the image similarity between the real data and predicted data. The PSNR of the real and predicted phase profiles, amplitude profiles, theoretical electric field distributions, and simulated electric field distributions are 25.99 dB, 44.80 dB, 44.29 dB, and 28.2861 dB, respectively. The SSIM of the real and predicted phase profiles,amplitude profiles, theoretical electric field distributions,and simulated electric field distributions are 99.97%,99.92%, 99.92%, and 94.96% respectively. Moreover, the more comparations of real and predicted images are supplemented in Supplementary information Section 5.
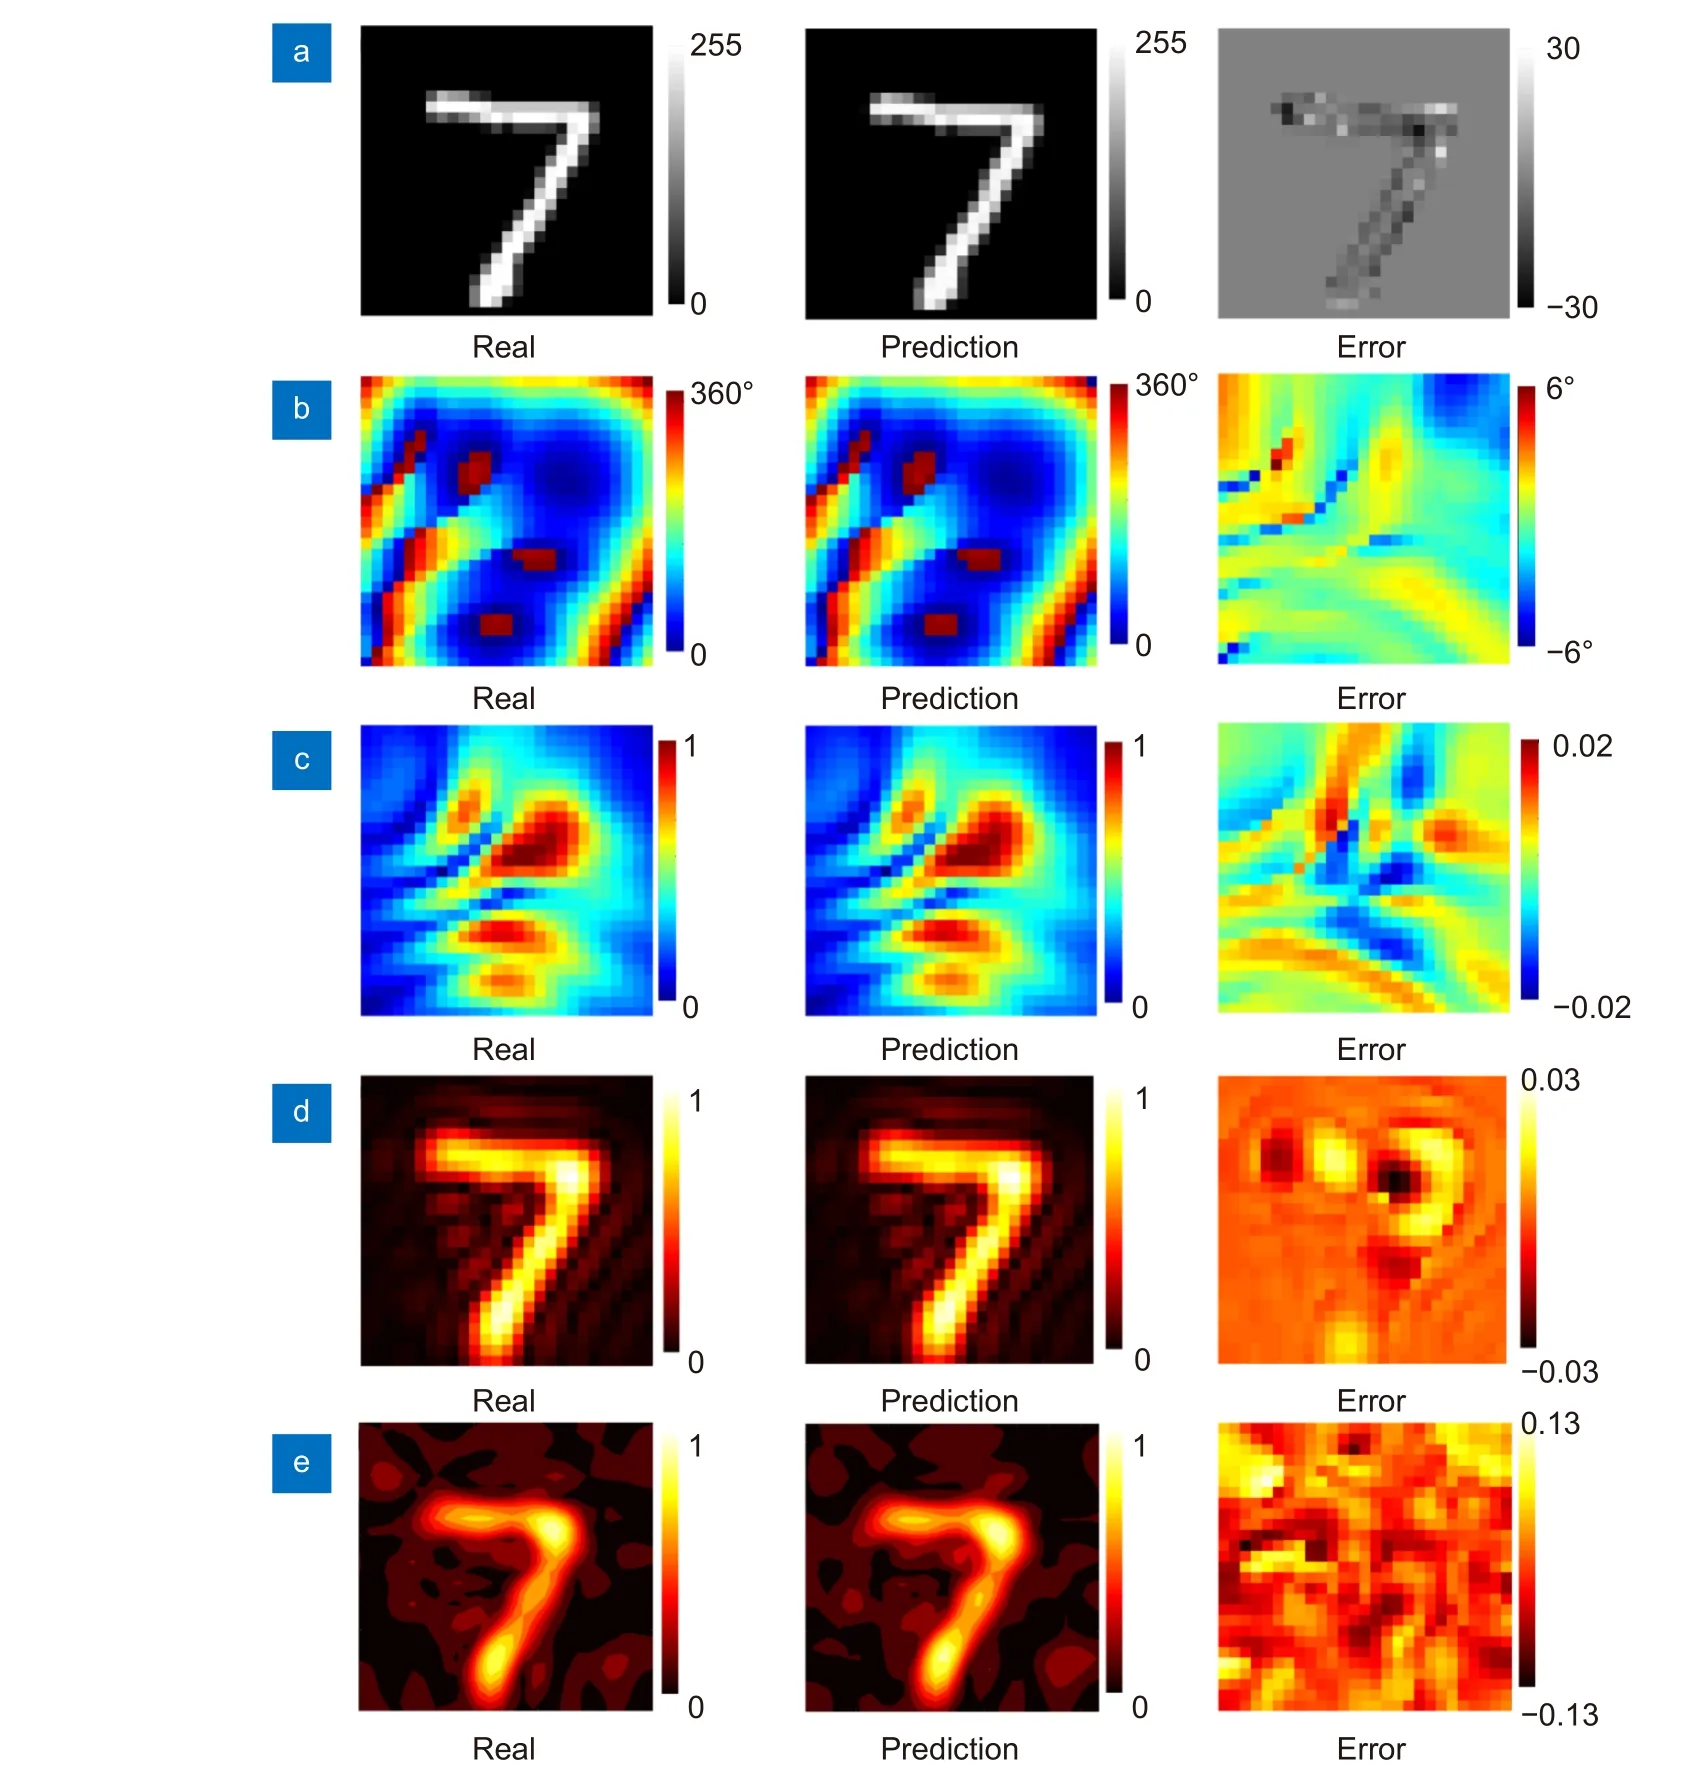
Fig. 4 | The comparison of predicted metasurface and real metasurface with error distributions. (a) Input images. (b) Phase profiles of metasurface. (c) Amplitude profiles of metasurface. (d) Theoretical electric field distributions calculated by diffraction theory. (e) Simulated electric field distributions.
Experimental verification
Furthermore, the metasurface prototypes of the real image and predicted image are fabricated and measured.Figure 5(a) shows the photographs of fabricated metasurface prototypes. The prototypes of designed metasurfaces are fabricated using Printed Circuit Board (PCB)technology. Figure 5(b) and 5(c) illustrate the photographs of the fabricated orthogonal metal gratings. The photographs of the metasurface patterns corresponding with real image and predicted image are shown in Fig.5(d) and 5(e). The images include 28×28 pixels corresponding that the metasurfaces consist of 28×28 metaatoms. Therefore, the side-length of fabricated metasurface prototype is 168 mm. All the samples are measured in microwave anechoic chamber as shown in Fig. 5(f).The sample is placed vertically on the test platform, the broadband horn antenna is vertically placed away from sample as transmitting antenna. The probe as the receiver is set to receive the EM wave and scan the electric field distribution. The polarization direction of the probe is placed orthogonal to that of the transmitting antenna.The probe driven by a stepper motor is positioned 50 mm above the sample and the scanning area is 180×180 mm. The measured results of real metasurface and predicted metasurface are shown in Fig. 5(g) and 5(h). The difference between two electric field distributions is used to detect the error between them, which is exhibited in Fig. 5(i). The error diagram between these shows a small measured error distribution, which sufficiently demonstrated our design. All the measured results verified the validity of trained REDCNN model, which can monolithically design the CAHM.

Fig. 5 | Measurement verification and comparation of the metasurfaces. (a) Photograph of fabricated metasurface prototype. (b, c) Photograph of orthogonal metal gratings. (d) Photograph of real metasurface pattern. (e) Photograph of predicted metasurface pattern. (f) Electric-field measurement environment in microwave anechoic chamber. (g) Measured electric field distribution of real metasurface. (h) Measured electric field distribution of predicted metasurface. (i) The error of measured electric field distribution between the real and predicted metasurfaces
Conclusion
In this work, we propose a monolithic design approach of CAHM via REDCNN architecture. Deep learning pretraining and transfer learning retraining frameworks are employed to establish the mapping between the electric field distributions and input images. With the trained REDCNN, the input image can be fast predicted by the electric field distributions. Owing to the unit coupling and unit error have been considered for generating electric field distribution, the prediction of input image can eliminate these effects. The training results illustrate that the normalized mean pixel error predicted by REDCNN can reach 3%, which is high accuracy for inverse design.The metasurfaces can be fast monolithically fabricated according to the input images. As verification, theory,simulation and measurement are carried out to compare the metasurfaces of real image and predicted image. All the real and predicted results exhibit a high degree of similarity, which convincedly verified our design. Here,we use REDCNN to achieve the metasurface monolithic design based on MNIST data. In the future, the data and model can be further improved performance. About data, the more images can be expanded in dataset and the more complex patterns can be calculated in monolithic design. About model, physics-based inspired machine learning will further optimize the monolithic design. Most importantly, this work provides a new way to monolithically inverse design the holography metasurface via machine learning, which can be easily extended to the other application of metasurfaces.
Acknowledgements
The authors are grateful to the supports from the National Natural Science Foundation of China under Grant Nos. 61971435, 62101588, 62101589,Natural Science Basic Research Program of Shaanxi Province (Grant No:2022JM-352, 2022JQ-335, 2023-JC-YB-069), the National Key Research and Development Program of China (Grant No.: SQ2017YFA0700201).
Author contributions
R. C. Zhu and J. F. Wang proposed the original idea and supervised the project. S. B. Qu supervised the project. T. S. Qiu and D. K. Yang carried out the simulations. Z. T. Chu, T. H. Liu fabricated the samples and performed the measurements. Y. J. Han, B. Feng and H. Y. Chen provided the calculation and measurement conditions and assisted the measurement.
Competing interests
The authors declare no competing financial interests.
Supplementary information
Supplementary information for this paper is available at https://doi.org/10.29026/oea.2023.220148
 Opto-Electronic Advances2023年8期
- Opto-Electronic Advances的其它文章
- A novel method for designing crosstalk-free achromatic full Stokes imaging polarimeter
- Cover
- Advancing nonlinear nanophotonics: harnessing membrane metasurfaces for third-harmonic generation and imaging
- Time-sequential color code division multiplexing holographic display with metasurface
- Third-harmonic generation and imaging with resonant Si membrane metasurface
- Planar peristrophic multiplexing metasurfaces