
Dynamic quantitative risk assessment of LNG bunkering SIMOPs based on Bayesian network
2023-11-30 10:42HongjunFanHosseinEnshaeiShanthaGaminiJayasinghe
Hongjun Fan ,Hossein Enshaei,Shantha Gamini Jayasinghe
Australian Maritime College (AMC), University of Tasmania, Launceston, Tas 7248, Australia
Keywords:Maritime Alternative fuel Safety LNG bunkering SIMOPs Dynamic risk
ABSTRACT Liquified natural gas (LNG) bunkering simultaneous operations (SIMOPs) refers to the operations (such as cargo operations,port activities and ship maintenance) occurring around LNG bunkering.SIMOPs pose new risks to LNG bunkering,because the operations are dynamically interlocked in which the occurrence probabilities of potential consequences change at different times due to commencement or completion of specific SIMOP events.However,traditional static risk assessment approaches are not able to take the dynamic nature of these new risks into account.This article proposes a dynamic quantitative risk assessment (DQRA) methodology based on the Bayesian network (BN) to develop better understanding of dynamic risks of LNG bunkering SIMOPs.The methodology is demonstrated and evaluated through a truck-to-ship LNG bunkering case study.The results and discussion of the case study validate the utility of the proposed methodology and demonstrate that BNs are efficient in performing the probability calculations and are flexible in conducting causal diagnosis.The main innovation of this work is realizing the quantification of risks at different times,which reflects the most essential time-changing characteristics of risks associated with LNG bunkering SIMOPs.
Abbreviations
ALARP as low as reasonably practicable
BE basic event
BLEVE boiling liquid expanding vapor explosion
BN Bayesian network
CDB cryogenic damage barrier
COA centre of area
CPT conditional probability table
C-QRA classical quantitative risk assessment
CVCE confined vapor cloud explosion
DAG directed acyclic graph
DDC dry-disconnect/connect couplings
DIB delayed ignition barrier
DORA dynamic operational risk assessment
DPB dispersion prevention barrier
DQRA dynamic quantitative risk assessment
DRA dynamic risk assessment
ESD emergency shut down
ET event tree
ETA event tree analysis
FBUTS floating bunkering unit-to-ship
FH fairly High
FL fairly Low
FMEA failure mode and effects analysis
FP fuzzy probability
FPS fuzzy possibility scores
FR failure rate
FST fuzzy set theory
FT fault tree
FTA fault tree analysis
GE gate event
GHG greenhouse gas
H high
HAZID hazard identification
HAZOP hazard and operability study
HE hazardous events
HF human factor
HREC human research ethics committee
IIB immediate ignition barrier
IMO international Maritime Organization
IR individual risk
L low
LFL lower flammability limit
LNG liquified natural gas
M medium
OTTS onshore terminal-to-ship
PCTC pure car and truck carrier
PFTS Potable fuel tanks switching
PID piping and instrumentation diagram
POD probability of death
PPE personnel protection equipment
PRA probabilistic risk assessment
QRA quantitative risk assessment
SB safety barrier
SCB surrounding condition barrier
SGMF society for gas as a marine fuel
SIMOPs simultaneous operations
SPB spill prevention barrier
SR societal risk
STS ship-to-ship
TTS truck-to-ship
VH very High
VL very Low
1.Introduction
To meet the air pollutant and greenhouse gas (GHG) emission regulations issued by the International Maritime Organization(IMO) [1,2],the maritime industry is looking for alternative fuels or energies.Liquified natural gas (LNG) is considered to be a transitional fuel for the shipping industry’s sustainable future [3,4].In 2020,about 140 LNG-fuelled ships were ordered accounting for approximately 17% of new global orders.According to the society for gas as a marine fuel (SGMF),as of October 2021,there were 218 LNG-fuelled sea-going ships in operation and another 413 on order around the world [5].
The availability of LNG bunkering is crucial to the uptake of LNG as a ship fuel.In order to optimize shipping schedules,it is recommended that LNG bunkering and the associated operations (such as cargo operations,port activities and ship maintenance) be conducted simultaneously,which is referred to as simultaneous operations (SIMOPs) [6].Scaling up LNG-fuelled ships is highly dependent on safe bunkering operations,in particular during SIMOPs.LNG bunkering SIMOPs have occurred under a number of conditions for ferries,oil tankers and containerships [7–10].However,this approach has yet to be widely accepted [11–13].One of the reasons for this reluctance to adopt LNG bunkering SIMOPs is the lack of a well-recognised risk assessment methodology.
Risk assessment results may vary depending on the methodology adopted.Khan,F.et al.classified available risk assessment methodologies as qualitative,semi-quantitative,quantitative and hybrid [14].Out of these methods,a quantitative risk assessment(QRA) methodology is able to provide a relatively accurate conclusion.Some regulations,standards and ship classification societies’rules have stipulated requirements for risk assessment for LNG bunkering SIMOPs.A static classical quantitative risk assessment(C-QRA) method which is unique method was recommended by all existing regulations,standards and rules [6]._ENREF_130 However,The risks associated with LNG bunkering SIMOPs have timedependent dynamic characteristics.During a specific LNG bunkering process,individual SIMOP events commence and terminate at different times.These variations in the timing of activities result in changes to the risk profiles occurring across the process.However,the existing C-QRA method for LNG bunkering tends to draw static conclusions without considering time-dependent SIMOP events.Therefore,it is unable to reflect dynamic changes to risk.To overcome this limitation,the present work attempts to develop a dynamic quantitative risk assessment (DQRA) that could provide a framework for capturing the dynamic risks during LNG bunkering SIMOPs by quantifying the time-dependent elements and their interactions.
Since the world’s first LNG-fuelled ship entered into operation in 2000 in Norway [15],a number of research studies have been conducted regarding the safety of LNG bunkering.These have mainly focused on the following three aspects: (i) safety zone assessment [7,16-20],(ii) risk assessment approach [21–23],and (iii)emergency evacuation [24].While both qualitative and quantitative analysis have been used in these studies,none has depicted the dynamic risks.
Over the past few years,some DQRA related papers have been published.For instance,in chemical and petroleum engineering,Kalantarnia,M.et al.proposed a dynamic risk assessment (DRA)method based on the Bayesian theorem.They used near misses and incident data to predict accident likelihood [25].Yang,X.,and Sam Mannan,M.proposed a dynamic operational risk assessment(DORA) methodology for operational risk analysis [26].Similarly,Haugen,S.,and Edwin,N.J.proposed a DRA methodology using the data and activities that change during operation of oil and gas installations [27].Khakzad,N.et al.focused on using a Bowtie model in DRA.In their work,the failure probabilities could be periodically updated using the Bayesian theorem [28].Similarly,Abimbola,M.et al.presented a DRA approach based on the Bowtie model and real-time failure probability assessment [29].Furthermore,Khakzad,N.et al.used a Bayesian network (BN) mapped from a Bowtie model to conduct a DRA of a process system [30].Mamudu,A.et al.presented a DRA strategy for a hydrocarbon sub-surface production system,an integrated approach comprising a multilayer perceptron,an artificial neural network model and a BN technique [31].In nuclear engineering,Xing,J.et al.proposed a DRA framework with condition monitoring data and inspection data for use in a nuclear power plant.In this work,a BN model was developed to integrate the two data sources [32].Kim,J.et al.proposed a probabilistic mapping method using a BN for use in dynamic probabilistic risk assessment (PRA) [33].In ocean engineering,Yeo,C.et al.developed a DRA using a BN to conduct a dynamic safety analysis for offshore loading processes of an LNG carrier [34].Qian,H.described DRA of the natural environment of key parts in the Arctic Northwest Passage using dynamic BN [35].
From the abovementioned literature,it can be seen that BN models have been adopted as an approach for DRA.In fact,BN models are a widely used approach for depicting uncertain knowledge in artificial intelligence,machine learning,and risk and reliability analyses [ 30,36-38 ].BNs are useful for DRA are they effectively handle causal relationships between risk factors and generate highly accurate time-dependent results using real-time evidence to update the models.
Even though the previous studies have significantly promoted the progress of DRA,until now there has been no detailed investigation of applying BN in a DRA for LNG bunkering.This research attempts to fill this gap.
Motivated by the abovementioned considerations,this paper aims to present a BN based dynamic quantitative risk analysis(DQRA) methodology for LNG bunkering SIMOPs and validate it through a case study.
2.Methodology
Fig.1 provides an overview of the proposed DQRA methodology which can be implemented to an LNG bunkering SIMOPs project in five steps:
Step 1: SIMOP events identification.This step identifies all possible SIMOP events.
Step 2: Bowtie modeling.Based on identified hazardous events(HEs),the Bowtie model is built for each HE to identify the causes and the potential consequences via safety barriers(SBs).
Step 3: Bayesian network modeling.This step translates the established Bowtie models into basic BNs.Next,human errors which are hard to include in Bowtie models are introduced into the basic BNs to form the final BNs.
Step 4: Fuzzy probabilities analysis.Based on data acquisition and fuzzy set theory (FST),this step quantifies the probabilities of basic events (BEs).
Step 5: Dynamic risk evaluation and mitigation.This step calculates the dynamic risk values on the timeline of LNG bunkering SIMOPs.Risk mitigation measures are proposed for a specific scenario according to the sensitivity analysis of SIMOP events to the total risks
2.1.SIMOP events identification
LNG bunkering modes could be ship-to-ship (STS);floating bunkering unit-to-ship (FBUTS);onshore terminal-to-ship (OTTS);truck-to-ship (TTS);or portable fuel tanks switching (PFTS) [6]Fig.2.presents a category framework which is used to identify the SIMOP events.The framework consists of three categories for STS at anchorage and FBUTS,and four categories for the other modes

Fig.2. Category framework for identifying SIMOPs events.
2.2..Bowtie modeling
The first step in Bowtie modeling is to identify the HEs.Then,Bowtie models are built to identify the causes of each HE,and the consequences of each HE via SBs.
2.2.1.HEs identification
The HE is defined as a node at which containment of the LNG or natural gas is lost.This step is based on the well-recognized hazard identification methods such as HAZID,HAZOP and FMEA.HEs may occur through innumerable scenarios,however,a limited number of representative scenarios are recommended to be chosen.Once the HEs are identified,the representative leak sizes for HEs are defined.
2.2.2.Bowtie model
A Bowtie model depicts the relationships between an identified HE,its causes and consequences,and the SBs that are implemented to reduce the occurrence probabilities for consequences Fig.3.presents a typical Bowtie diagram.The BEs are identified to build a fault tree analysis (FTA) model on the left side of the HE.An event tree analysis (ETA) model on the right side of the HE is built based on SBs to identify the potential consequences (Ci).The FTA approach is also adopted on the top side of the SBs to conduct the probability analysis for a specific SB.
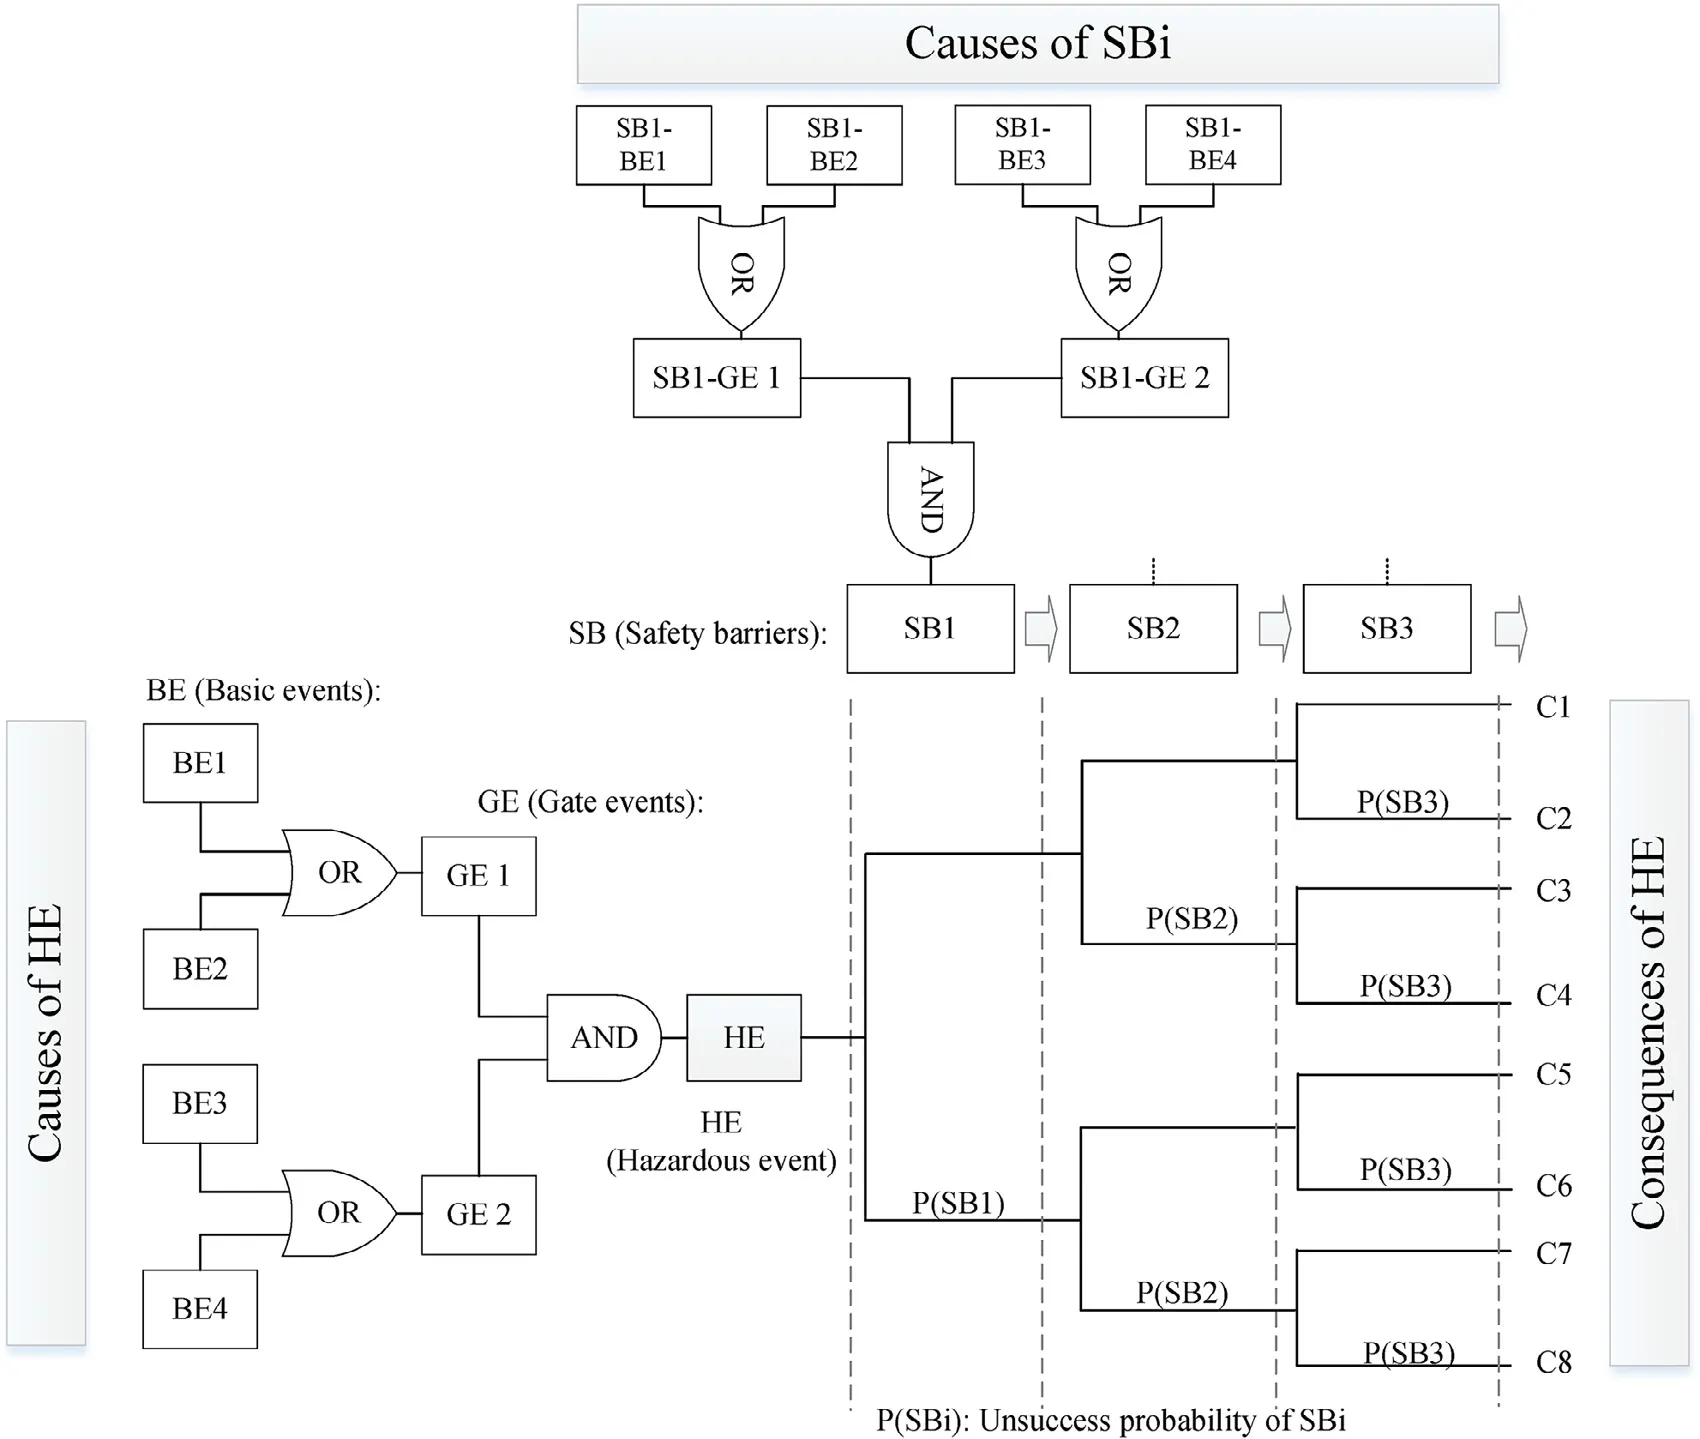
Fig.3. A typical BT diagram for the proposed DRA method.
2.2.3.Safety barriers model
Fig.4 presents the proposed SBs model for the ETA of LNG bunkering SIMOPs based on the Swiss cheese model [39].The descriptions of the SBs are given below.

Fig.4. SBs model for LNG bunkering SIMOPs.
SB1: Spill prevention barrier (SPB): Generally,the HE is identified as LNG leakage.Leaks may further deteriorate into large spills.The reliability of flammable gas detection and an emergency shut down (ESD) system could be specific measures for preventing spill.
SB2: Cryogenic damage barrier (CDB): An LNG spill on the surface of non-cryogenic proof steel could potentially lead to metal embrittlement [40].The cryogenic damage could be protected by passive (e.g.,drip trays) and active (e.g.,water curtain spray system) barriers.There is potential cryogenic burns or injury for workers if LNG comes into contact with skin.Thus,wearing personnel protection equipment (PPE) is an effective barrier to fully protect workers.
SB3: Immediate ignition barrier (IIB): Immediate ignition of LNG could be through auto-ignition,or an ignition caused by the accident which causes the release.When the IIB fails,it may lead to a jet or pool fire.Immediate ignition probability is a function of the size of the release and the position and energy of the ignition source.Alternatively,the probability could be determined based on both historical data and professional engineering judgment.
SB4: Dispersion prevention barrier (DPB): The DPB is to prevent the spread of evaporated gas,in order to limit the extent and/or duration of potential consequences.An extensive dispersion could be protected against by passive (e.g.,walls) and active (e.g.,water curtain spray system [41],high expansion foam [42]) barriers.The FTA is used to analyse the failure probability of DPB.
SB5: Delayed ignition barrier (DIB): Delayed ignition refers to the ignition of a gas cloud by a source far from the source of release [43].Once delayed ignition occurs,and provided that the cloud is unconfined,the LNG vapours will burn in the form of a flash fire.The flash fire could burn back to the LNG pool and create a pool fire.If the cloud is confined,a confined vapor cloud explosion (CVCE) will happen [44].Cox,A.W.et al.suggested a correlation for the delayed ignition probability based on mass flow rate[45,46].However,this simplified method cannot take into account the actual situation around the source of release.Therefore,it is recommended to use the FTA to analyse the probability of delayed ignition.
SB6: Surrounding condition barrier (SCB): As mentioned in SB5,a CVCE might happen.The probability of occurrence of CVCE depends upon the degree of confinement of the surroundings.When in a well-ventilated open area,the failure probability of SB6 is regarded as zero.
2.3.Bayesian network modeling
BN is a directed acyclic graph (DAG),in which the nodes represent variables,arcs represent causal relationships between the linked variables and their conditional dependencies are represented through the conditional probability tables (CPTs) assigned to the nodes.The joint probability distribution P(U) of variables U={A1,...,An} included in the BN is expressed by Eq.(1).
WherePa(Ai) is the parent set ofAi[47].
In the BN,the Bayes theorem is used to update the prior probabilities for events given evidence,thus yielding the posterior probability which is expressed by Eq.(2).The evidence will be available during the LNG bunkering process,such as SIMOP events commencing or terminating at different times.The severity of consequences may generate new evidence,such as the relationship between the boundary of gas cloud and the position of an ignition source.
Where P(U|E) represents the posterior probability of the U given the evidenceE;P(U,E) means the probability of U andEhappening together;P(E) represents the occurrence probability of evidenceE.
2.3.1.Translating a Bowtie model into a BN
The process of translating a Bowtie model into a BN comprises three steps.Step 1 is to translate the fault trees (FTs) into the BNs according to the translation rules for the GEs [37].Step 2 is to translate the event trees (ETs) (including the FTs for SBs)into the BNs.In terms of translating an ET into a BN,each SB is denoted by a node with two states,success and unsuccess.If,an arc is linked from the HE to the SBi.A consequence node with multi-states is added.Step 3 is to connect the two BNs generated from the two steps described above to construct an integrated BN via HE as a pivot node.
2.3.2.Human factors in BN model
The BEs in the translated BN model are all technical factors,because they are from a Bowtie model which can only take technical factors into account due to its logical gates.However,there might be human factors (HFs) involved in the LNG bunkering SIMOPs which can directly influence the occurrence probabilities of events.Therefore,it is necessary to introduce HFs into the BN.Some BEs and SBs in the basic BN might be directly influenced by HFs,and some HFs could be common causes for some events.
2.4.Data and fuzzy probabilities analysis
The prior probabilities of BEs in the BN are a necessary inclusion.However,as the LNG bunkering industry is in its infancy,the crisp probabilities of most of the BEs cannot be found in existing databases [48–51].In addition,only two LNG bunkering accidents have been documented [12] ;thus,it is challenging to estimate the crisp probabilities of BEs due to high uncertainty.As an alternative,experts’ qualitative judgements (expressed in linguistic terms)on the possibilities of BEs are used to assess the occurrence probabilities of BEs.Then,based on the FST [52],the linguistic terms are converted into fuzzy numbers which are further converted into fuzzy probabilities.
2.4.1.Obtaining experts’ qualitative judgements
Experts are invited to complete questionnaire about the possibilities of BEs.A seven-point Likert scale,anchored by Very Low and Very High,is used to represent the possibilities of BEs occurring.Two main reasons for selecting seven descriptors are: (1)using seven descriptors to express the possibilities is in line with the common practice of the experts in the maritime industry [53] ;(2) Miller,G.A.concluded that humans’ unidimensional judgment span is usually seven plus or minus two (i.e.,five to nine) [54].
2.4.2.Converting the experts’ qualitative judgements into fuzzy corresponding numbers
In this study,the trapezoidal fuzzy numbers whose membership functions are defined as Eq.(3) are used.
The conversion scale,which includes seven linguistic terms,is adopted for estimating the possibilities of BEs as shown in Fig.5 [55].This maps an expert’s judgment to a quantitative level.
The next step is to aggregate subjective expressions on the identified BEs from multiple experts into a single expression.
2.4.3.Aggregating the fuzzy corresponding numbers into a fuzzy number
Based on the linear opinion pool method [56],the aggregated fuzzy numberPjcan be expressed by Eq.(4).
WhereWiis the weight given to theith expert,and;Pijis a linguistic value obtained from expertiabout eventj;nis the total number of experts whilemis the total number of BEs.
The weighting criterion of experts is designed in Table 1.The weights of experts are calculated using the Eq.(5) [57].

Table 1 Weighting criteria of experts.
WhereWSiis the weight score of theith expert,WSi=PPSi+STSi+ELSi,PPSi,STSiandEL Sirepresent the professional position score,the service time score and the education level score of theith expert respectively.
The next step is to convert the aggregated fuzzy numbers into the fuzzy possibility scores,i.e.,the defuzzification.
2.4.4.Converting aggregated fuzzy numbers into fuzzy possibility scores (FPS)
The centre of area (COA) method of defuzzification is used.Let a fuzzy set=[a,b,c,d],then defuzzification of the trapezoidal fuzzy numberis given by Eq.(6) [58].
Therefore,FPS=X∗,whereFPSis the fuzzy possibility score.
2.4.5.Converting fuzzy possibility scores (FPS) into fuzzy rate (FR)per operation
A function developed by Onisawa is used for converting FPS to FR [59].The FR can be expressed by Eqs.(7)-(9).
Where K is a constant value,PSCis the rate which implies a safety criterion [60].In this paper,PSCis taken as 5×10⁻³,therefore,=2.301.
2.4.6.Converting fuzzy failure rate (FR) per operation into fuzzy probability (FP) per year
It is required to use numerical risk criteria in performing quantitative risk evaluation.The existing numerical risk criteria uses“per year” as a unit,therefore,in order to convert FR per operation into FP per year,the hours per LNG bunkering operation and the number of LNG bunkering operations in a year should be estimated for a specific project.Then,with exponential distributions expressed by Eq.(10),the annual probability of occurrence for a BE is calculated.Finally,theFPsobtained are used as prior probabilities of the BEs in the developed BN.
whereFPis the annual probability of occurrence,λis failure rate per hour,t=operational hours in a year.
2.5.Dynamic risk assessment and mitigation
The dynamic risks can be assessed by the losses of asset,human life,and environmental and reputational damage.Human life is considered to be the top priority among various factors;thus,this study takes human fatality as an indicator.
2.5.1.Dynamic probabilities for consequences
Some SIMOP events commence or terminate at different times during LNG bunkering.This means evidence is observed which generates posterior probabilities at different times in the BN.Then,dynamic probabilities for consequences on the timeline of an LNG bunkering process are obtained.
2.5.2.Severity of consequences
Table 2 presents the approaches for calculating the probabilities of human death (POD) for potential consequences,where the socalled “probit analysis approach” is used to analyse the impact on people due to jet and pool fire [48].
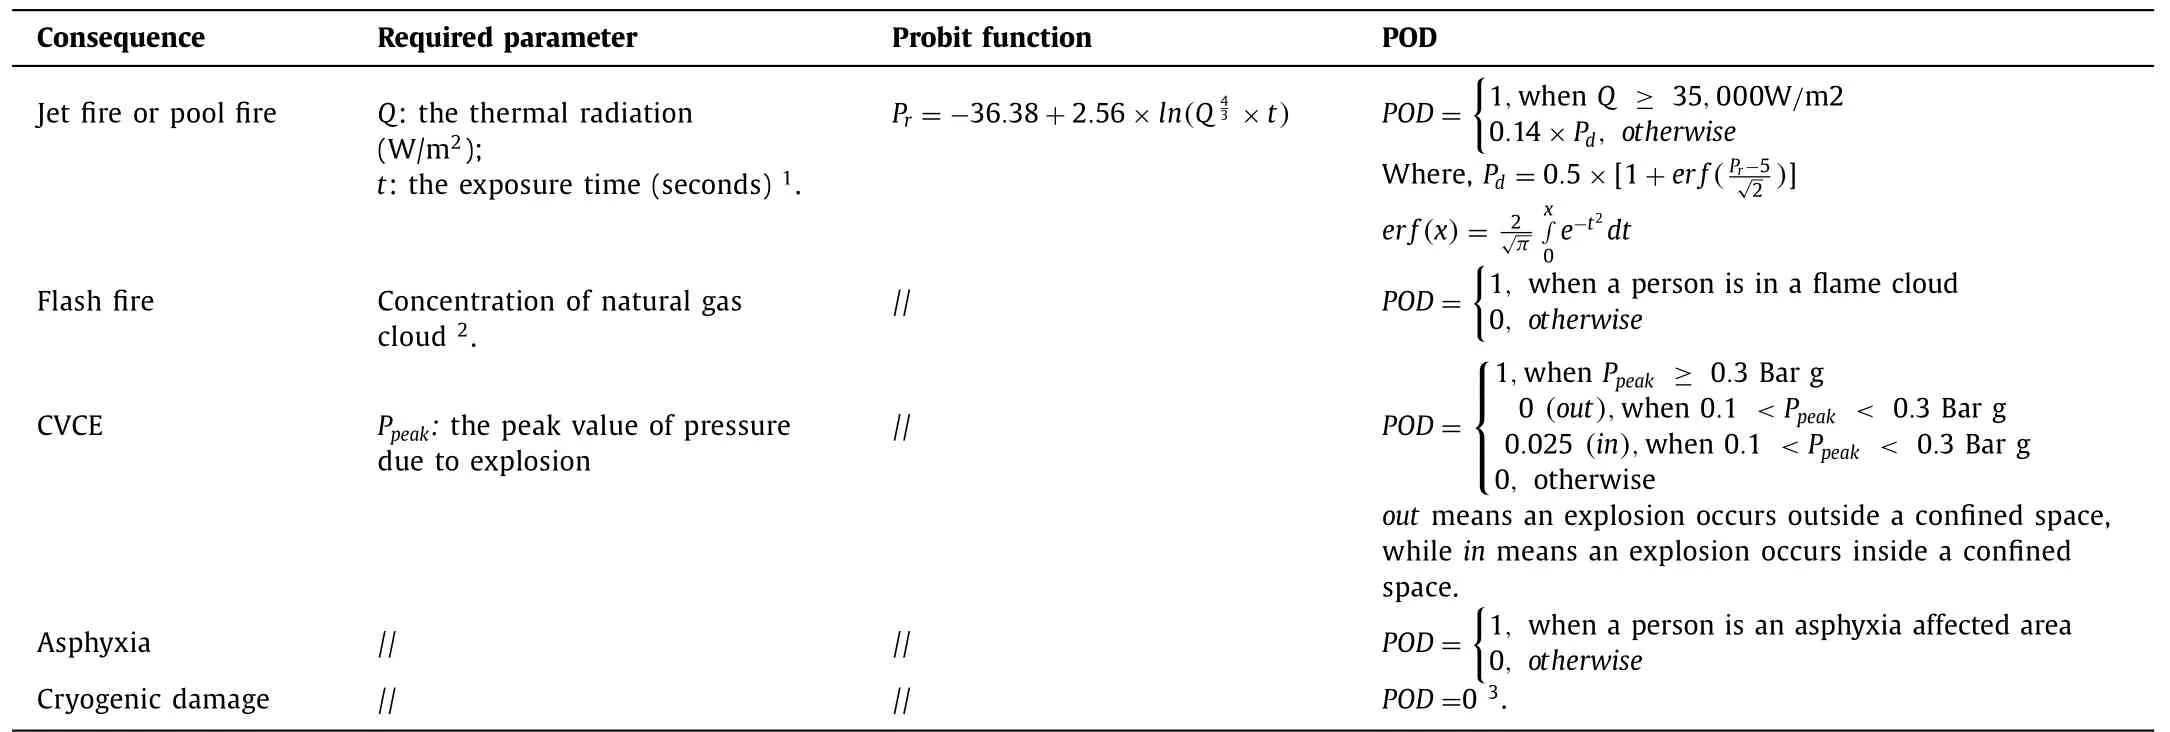
Table 2 Calculation approaches for PODs.
2.5.3.Risk evaluation criteria
Risk criterion to humans are classified into Individual risk (IR)and Societal risk (SR) [61].The IR is the risk that a hypothetical person faces during a specific time period.The SR is a combination of IR levels and the number of people at risk.The purpose of SR criteria is to limit the risks from operations to local communities.Utilizing these two person-risk metrics can comprehensively support risk decision making.
2.5.4.Risk mitigation
If the calculated risk value does not meet the risk criteria,risk mitigation measures should be proposed.The sensitivity of the SBs to the probability of occurrence for each consequence can be diagnosed using BN in order to assist in the identification of risk mitigation measures.
3.Case study
In this study,a truck-to-ship LNG bunkering case is used to demonstrate and evaluate the proposed methodology.A Chinese shipowner plans to build an LNG-fuelled pure car/truck carrier(PCTC).The ship’s home port will be the Shanghai port,with routes to Tianjin,Dalian,and Guangzhou ports in China.The ship will call Shanghai Port twice a month and fuel bunkering will be conducted at this port Fig.6.shows the layout of the LNG bunkering site.The bunkering plan is briefly described as follows:

Fig.6. Layout of the LNG bunkering site.
•Approximately 200 m3of LNG will be transferred on each call.24 operations will be conducted annually.
•The LNG bunkering site will be located at berth.Two LNG trailers will provide bunkering simultaneously.The storage capacity for each trailer is around 55 m3.The total bunkering is equivalent to four loads of LNG trailers.
•The bunkering operation will be carried out simultaneously with the roll-on of the cars through the quarter ramp (cargo loading).
•The bunkering operation will be carried out during the day.
•The number of bunkering operators will be 5 persons.
Fig.7 shows a simplified piping and instrumentation diagram(PID) including safety devices and means of connection described as follow:
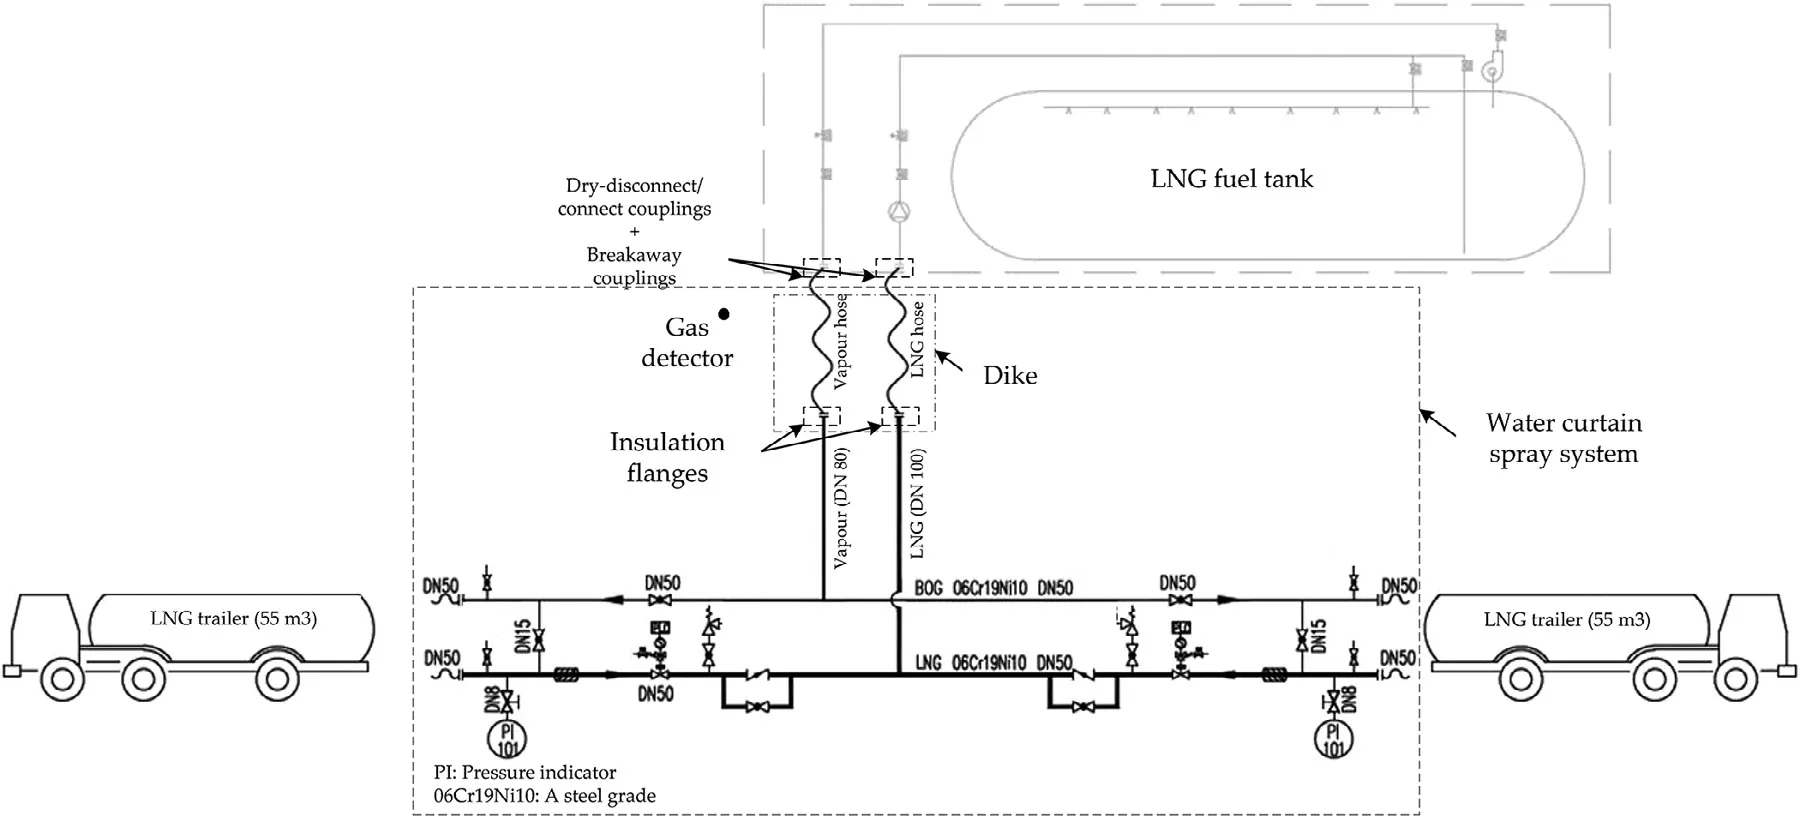
Fig.7. Piping and instrumentation diagram (including safety devices).
•Breakaway couplings which are the weakest links will be installed in the hoses.If the equipment is subjected to inadvertent and strong tensile loads,for example,due to drifting of the ship,the coupling will separate and instantly seal the two open ends automatically.
•Dry-disconnect/connect couplings (DDCs) will be used in the hoses.A set of DDCs permits quick connection and disconnection of a hose bunkering system [62].
•A dike which is 4.5 m long,4.5 m wide and 1.0 m deep is used to contain any possible leakage or spilled LNG.
•A gas detector will be installed near the LNG transfer hose.
•A trailer/ship ESD system will be activated if flammable gas is detected.
•A water curtain spray system,covering the specific area shown in Figs.6 and 7,will be used as a means of DPB [41].
The main reason for using TTS as a demonstration case is due to inherent more risk points than other modes.The volume of each LNG trailer is limited (about 55 m3),and the amount of LNG required by an LNG-fuelled ship is much larger.It is thus necessary to have number of the trailers to complete one LNG bunkering.On one hand,replacing trailers results in multiple connections between the trailers and the ship which adds more risk points.Onthe other hand,during LNG bunkering,the driving of the replacement trailers adds new ignition sources,hence increasing the risk points.Therefore,considering TTS as a case can demonstrate the application of the proposed methodology more in detail.
3.1.SIMOP events identification
Based on the bunkering operation manual,the SIMOP events were identified using Fig.3.The symbolOijis used to indicate the identified events,irepresents the number of a category,jrepresents the number of an event Table 3.shows the identified three SIMOP events (O11,O21andO31).

Table 3 Identified SIMOP events.
Fig.8 presents the timeline of the LNG bunkering SIMOPs.The entire process will take five hours and ten minutes.The commencing time and terminating time of each event (operation) is shown.

Fig.8. Planed timeline of the LNG bunkering SIMOPs.
3.2.Bowtie modeling
This subsection presents the Bowtie models.
3.2.1.HEs identification
Based on a HAZID study,LNG releasing in the bunkering hose or associated joints (including DDC and flanges) was identified as an HE.The gas release in the vapour return hose was ignored as the gas flow rate in the vapour return line does not exceed 0.1 kg/s which leads to an insignificant impact [63].
Usually,leak sizes are classified into two (leak and rupture) or three (small,medium,and large) categories [48,64].In addition,a full-bore rupture scenario was considered,because it is an important scenario and omission of it can lead to misjudgement in the risk decision-making process [65].Consequently,four HEs were defined as per leak sizes:
•HE1: Small leak
•HE2: Medium leak
•HE3: Large leak
•HE4: Rupture of the LNG hose
This case study used leak rate as the criterion to define leak size,as suggested by the literature [65].Three leak rates of 0.1 kg/s,10 kg/s and 20 kg/s were used as boundaries among four HEs Table 4.shows leak size categories and representative hole diameters for each HE.The range of diameters of leak hole were calculated using the Bernoulli Eq [66]..
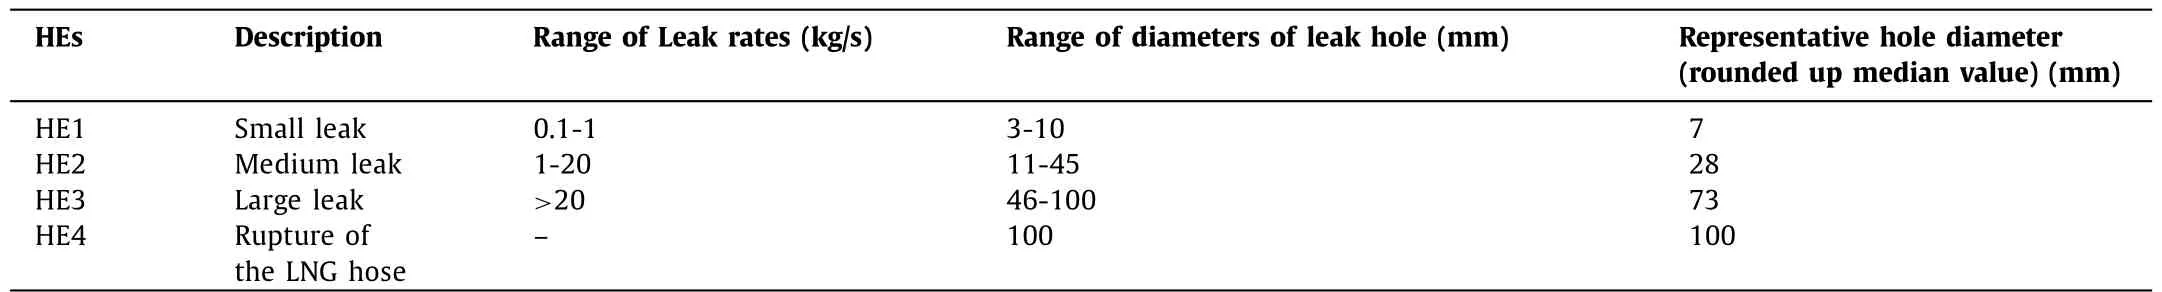
Table 4 Descriptions of HEs.
3.2.2.Bowtie model
The FTs were built for the HEs in Fig.9.The leak in the hose caused by material deterioration of a hose was not considered because stringent regular inspection regulations will be implemented.Whereas the regular visual inspection is not able to cover the DDC or the gasket of the flange;therefore,failures in couplings were identified as BEs for HE1.Because of its configuration,failure of the DDC would not lead to a medium leak [62] ;consequently,it was removed from the BEs of HE2.The BEs for HE3 and HE4 are both caused by external loads.
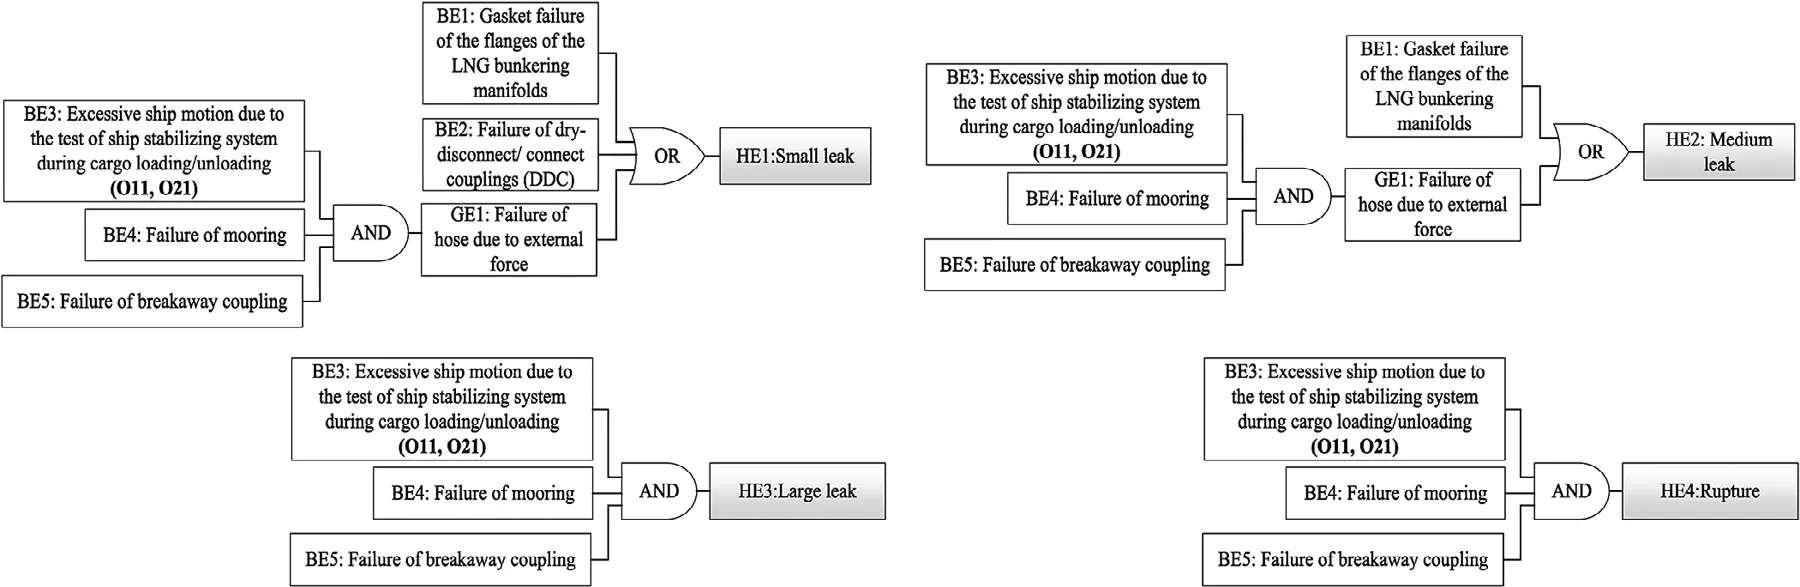
Fig.9. FT models for HE1,HE2,HE3 and HE4.
The EET model for HEs is shown in Fig.10.A total of 15 potential consequences were identified including “Safe”,“SB1_S_C1–C7”and “SB1_U_C1–C7”.The BEs for SBs were identified as per the design scheme.Then,the Bowtie models were obtained by combining the FTs and EETs.
3.3.Bayesian network modeling
This subsection presents the BN modeling.
3.3.1.Human factors
In this project,if other safety means fail to activate the trailer/ship ESD system,manual operation becomes the last barrier to prevent LNG spillage [12].Therefore,the “HF1: human error” was identified as a cause of the unsuccess of SB1.Due to the low likelihood of emergency events,operators have little practical experience with the emergency response,which results in an increased likelihood of human error in these circumstances.According to the literature [67],the probability of human error for rule-based actions by control room personnel after diagnosis of an abnormal event is 0.05.Thus,0.05 was taken as the probability of failure of the human operation in this case study.However,it is noteworthy that this data is directly quoted from a report in the nuclear industry [68],and its applicability in the field of LNG bunkering is an arguable question which is needed to be answered by further studies.
3.3.2.BN models
A software named Netica was used to build the BNs [69] Fig.11.shows the BN for HE1,as an example.An empirical immediate ignition probability of 0.001 was used [43].As the bunkering operations will be in open area,the failure probability of SB6 was regarded as zero.

Fig.11. BN model for HE1.
3.4.Data and fuzzy probabilities analysis
This subsection presents the data acquisition,data analysis and fuzzy probabilities analysis.
3.4.1.Data acquisition
Data for analysing the fuzzy probabilities for the BEs were acquired through an online questionnaire survey.The ethics application was approved by the University of Tasmania’s Social Sciences Human Research Ethics Committee (HREC) on the 9th of February 2021 (Project ID:23903).The online survey was distributed in China and a total of 137 experts’ responses were received (14 were from shipping companies;33 from energy companies;6 from maritime safety administrations;6 from port authorities;20 from classification societies;20 from ship design companies;8 from shipyards;13 from equipment manufacturers;11 from academia;6 from other backgrounds).The information related to a selection of experts is shown in Table 5.The criterion for the selection of experts was set to have LNG bunkering related knowledge or experience.Since LNG bunkering is an emerging industry,it is conservatively estimated that there are about 500 qualified experts in China.Using the formula for the sample size in the literature[70],the sample size of 82 is recommended and therefore,137 responses are considered sufficient in this study.In the calculation,the population size is taken as 500,the margin of error is taken as 5%,the confidence level is taken as 90%,and the sample proportion is taken as 90%.
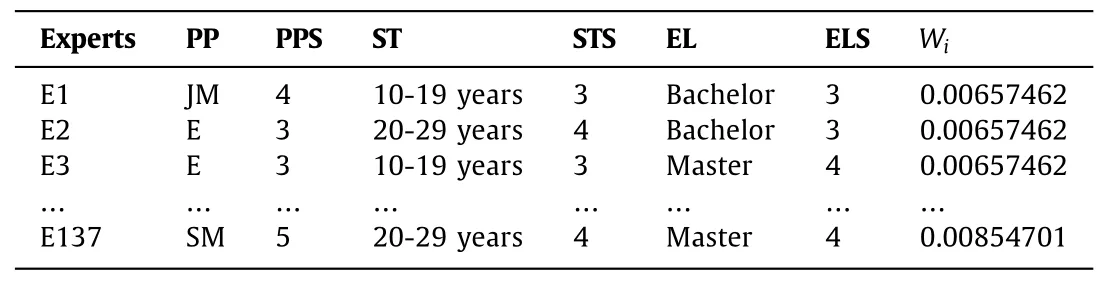
Table 5 Information of the experts and the associate weights.
3.4.2.Data analysis
Table 6 shows the experts’ judgements,aggregation of fuzzy numbers,FPS and FP values.

Table 6 The fuzzy probability obtained from experts’ judgement.
This subsection presents the risk evaluation including the analysis of dynamic probabilities for,and severity of consequences.
3.5.1.Dynamic probabilities for consequences
Table 7 presents the evidence for BNs of HE2,HE3 and HE4 at different times.For HE1,the farthest distance (20m) between the LFL isopleth of gas cloud and the source of release is less than the distance (45 m) between the edge of the quarter ramp and the source of release.Therefore,the O11 event was not regarded as an ignition source.This provides additional evidence for the BN of HE1 compared with the evidence for BNs of HE2,HE3 and HE4.Taking HE1 as an example,the probabilities of each consequence at different times according to the time plan given in Fig.8 are shown in Fig.12.
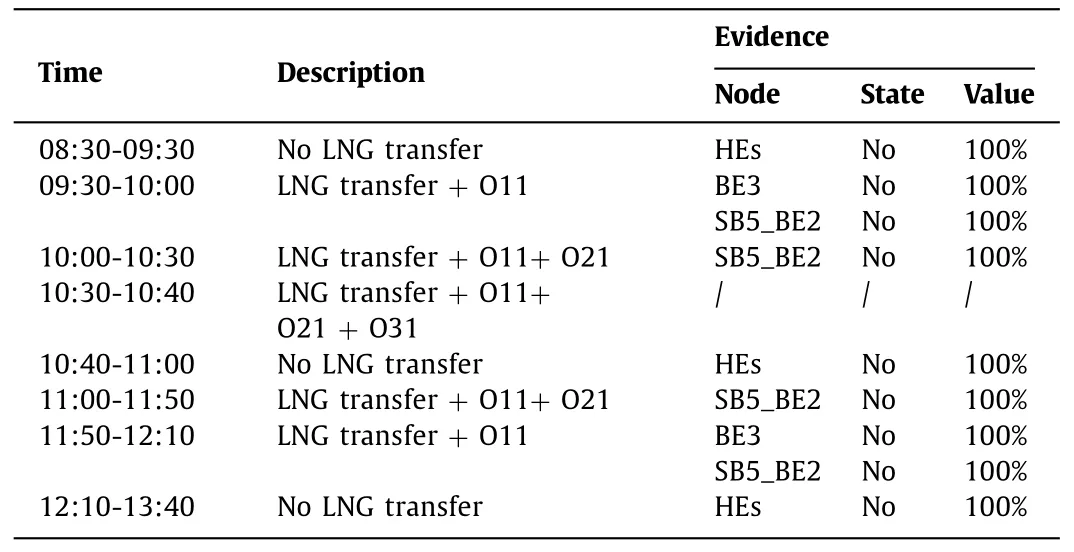
Table 7 Evidence for BNs of HE2,HE3 and HE4 at different times.

Fig.12. Probabilities of each consequence throughout the operation for HE1 at different times.
3.5.2.Severity of consequences
As LNG bunkering will be carried out in an open area,the probability of failure of SB6 was regarded as zero;therefore,CVCE and asphyxia won’t happen.The cryogenic danger for humans was not considered due to mandatory requirement of PPE that operators wear.Therefore,in terms of the severity analysis related to human life,this study only focused on the POD due to fires (i.e.,flash and pool fires).
The severity analysis of potential consequences was based on the representative leak size categories Table 8.presents the LNG release scenarios for HEs.The duration of release has two scenarios.If SB1 is successful,it is conservatively assumed that the duration of release is 60 s considering gas detection time and ESDresponse time.If SB1 is unsuccessful,the duration of release is assumed as 90 s because LNG clouds are clearly visible when a large spill occurs.In this scenario,the release would be detected and shut down by the bunkering operators or crews at an early stage.

Table 8 LNG release scenarios for HEs.
A software named ALOHA was used to model the severity of consequences such as gas dispersions and fire thermal radiations.ALOHA is widely used due to its fast computational time and reasonable accuracy [71].It uses the Gaussian model and the Heavy Gas model to predict how gas will disperse in the atmosphere.In this study,the LFL (5%,the volumetric concentration of fuel in air) isopleth of methane was considered as the border of the flammable cloud.ALOHA employs the solid flame models to compute thermal radiation hazards from jet and pool fires [72].
LNG bunkering operations are not allowed under extreme weather conditions;average weather conditions were recommended as the weather criteria Table 9.presents the meteorological data that are needed for modeling the severity.

Table 9 Meteorological data of the proposed bunkering site.
Working under the most unfavourable principle,the wind direction was considered to be from the northwest (in Fig.6).Gas disperses the farthest in this wind direction as there are almost no obstacles.In addition,the potential ignition sources,roll-on cars,are in the downwind direction.These factors make wind blowing from northwest the most dangerous.
Using the data presented in Tables 8 and 9,the gas dispersions and thermal radiations for HEs were used to calculate the PODs.Conservatively,the influence range of the POD was considered to be a circle,with the source of release as the centre Fig.13.presents the POD along the distance from the source of release for each HE when the wind is from the northwest.It is clear that HE1 has the slightest consequences,whereas HE4 has the most serious consequences.
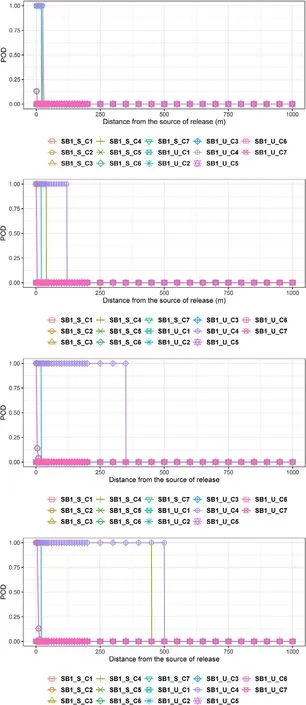
Fig.13. POD along the distance from the source of release for each HE.
3.5.3.Domino effect
Three sequential events in this case constitute a domino model;pool fire,boiling liquid expanding vapor explosion (BLEVE) of LNG trailers,and accident caused by the BLEVE.The pool fire has the potential to impact upon LNG trailers.If a pressurised LNG tank is exposed to fire,a BLEVE could occur [73].A value of 37.5 kW/m2is widely used as the threshold for the damage to process equipment [74].The positions of the LNG trailers are 20 m away from the boundary of the dike.As per the calculation,at 20 m distance from the source of release,even in HE4 scenario the pool fire generates 7.53 kW/m2thermal radiation to the LNG trailers which is much less than 37.5 kW/m2.In addition,the trailers will be moved to a safe place in case of fire.Therefore,the Domino effect was not considered.
3.5.4.Risk criteria
The IMO has recommended IR criteria that defines an intolerable risk for three types of hypothetical persons (crew members,passengers and the public ashore) as well as negligible risk shown in Table 10 [53,75].In this study,persons in a circular area with the source of release from the center with a radius of 100 m were defined as “crew members”;whereas persons in an annular area with the source of release from the center,and an inner radiusof 100 m and an outer radius of 1000 m were defined as “public ashore” in Table 10.
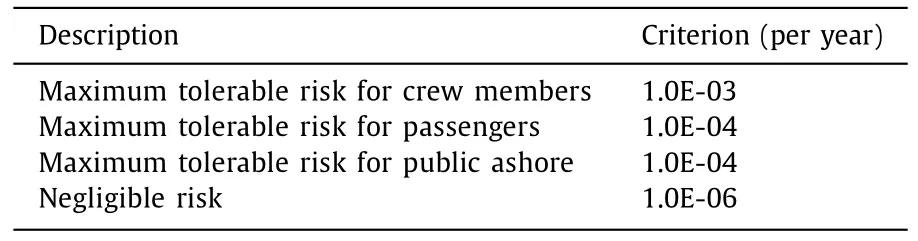
Table 10 IR criterion.
In terms of SR criteria,the population density distribution around the source of release needs to be explained first Fig.14.shows the population distribution within a circle with a radius of 1000 m from the source of release.Assuming that the population is evenly distributed in each area,the population density is expressed by the number of people per linear meter.

Fig.14. Population density distribution around the source of release.
The IMO has recommended SR criteria for different ship types(i.e.,tankers,bulk and ore carriers and passenger roll on-roll off ferries) [53,76].The criteria for roll on-roll off ferry which is similar to the PCTC was used in this study.
3.5.5.Dynamic risk values on timeline
The IR values were calculated using Eq.(11) at a specific distance point and a specific time period,for example,the calculation of IR value for 30 m at 10:30am-10:40am IR30m@1030-1040is expressed by Eq.(12).
Whereirepresents the number of the consequences,Cirepresents theith consequence,PCi(t) represents the probability of the Ciat timet,S Cirepresents the severity of the Ci.
Fig.15 shows the change of IR as the distance from the source of release increases at different times.Within the water curtain spray covered area (20 m),maximum IR occurred during 10:30-10:40 and reached 2.30E-02.Since the operation rules state that personnel are strictly prohibited from entering this area during LNG transfer,the IR within the water curtain spray covered area is acceptable.Outside this area,the values of IR reduced significantly.Between 20 m and 40 m,maximum IR occurred during 10:30-10:40 and reached 2.15E-04,even at other time period,maximum IR reached 2.14E-04.These values are within acceptable IR(1.0E-03) for the crew associated with the bunkering operation.Between 40 m and 120 m,maximum IR occurred during 10:30-10:40 reached 1.37E-06,during 10:00-10:30 and 11:00-11:50,maximum IR reached 1.03E-06.These values exceed negligible IR (1.0E-06)but meet the acceptable IR (1.0E-04) for the public ashore.Between 120 m and 450 m,maximum IR occurred during 10:30-10:40 and 11:00-11:50,reached 5.89E-07 which meet the acceptable IR (1.0E-04) and the negligible IR (1.0E-06).
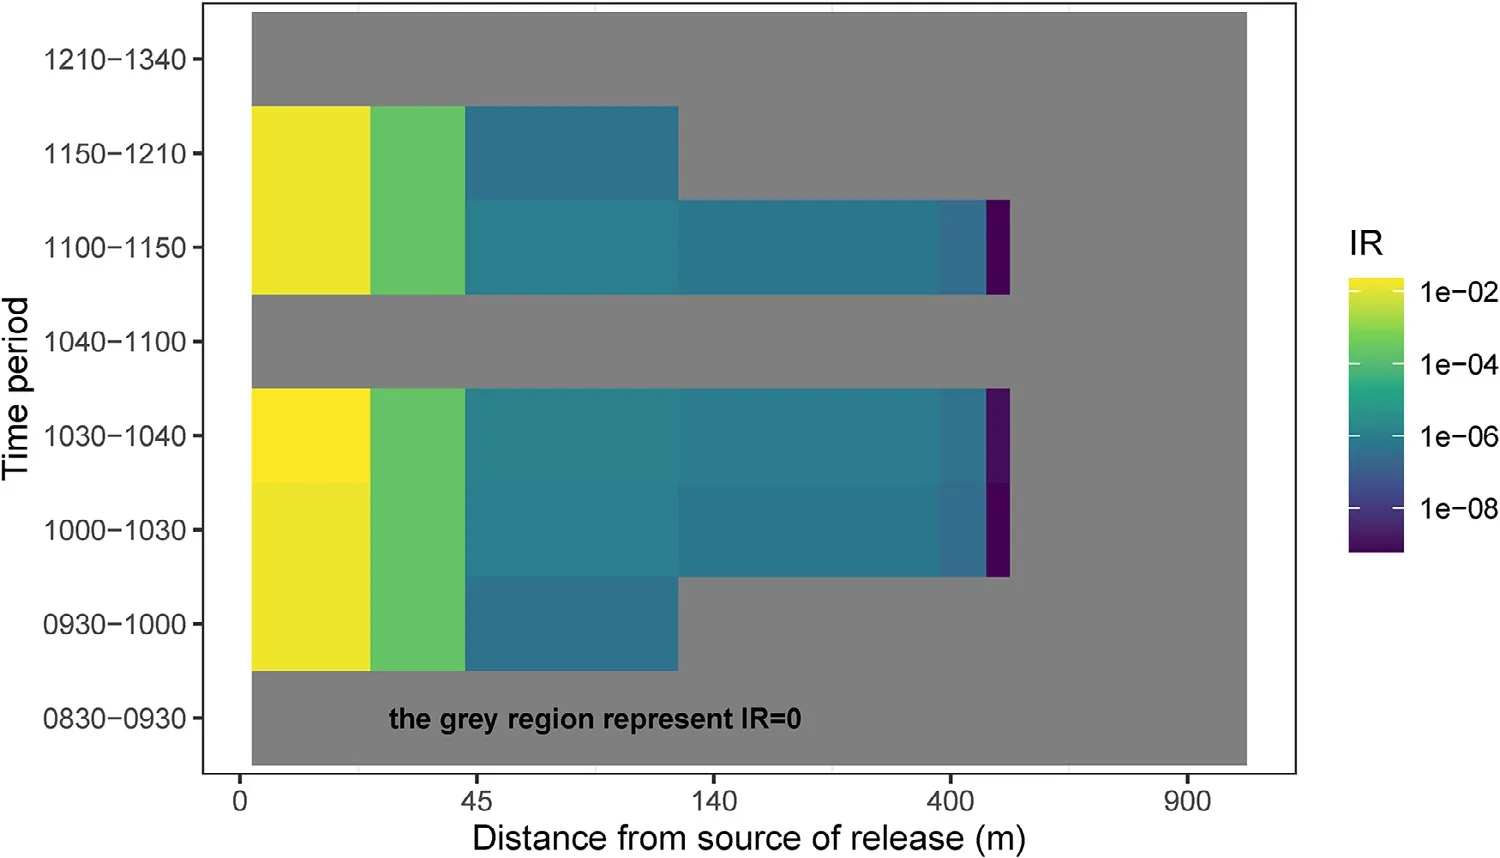
Fig.15. Change of IR as the distance from the source of release increases at different times.
In this paper,conservatively,the boundary was considered as a circle with the source of release from the centre and the distance as the radius for the IR contour.From these results,it is obvious that IR values meet the IMO IR criterion.
Fig.16 shows the change of SR (F-N curves) at different times.The x-axis represents the number of fatalities (N) and the y-axis represents the frequency (F) of N or more fatalities.The F-N curves are categorized into three regions: acceptable,as low as reasonably practicable (ALARP),and unacceptable.Obviously,the F-N curves reflect the dynamics of SR risk.The times associated with high to low risk are ranked as: 10:30-10:40,10:00-10:30,11:00-11:50,09:30-10:00 and 11:50-12:10.Since the F-N curves fall into ALARP region,risk mitigation measures should be taken.

Fig.16. F-N curves at different time periods throughout the operation.
3.6.Sensitivity of SBs
It is apparent from Eq.(12) that HE2 make a major contribution to the total IR.Thus,the BN for HE2 was used to diagnose the sensitivity of SBs to the consequences.The diagnostic analysis function of the BN model was utilized to analyze the sensitivity of SBs to the occurrence probability of SB1_S_C4 which has the highest occurrence probability in all consequences.As illustrated in Fig.17,SB4 and SB5 are highly sensitive to “SB1_S_C4”.

Fig.17. Sensitivity of SBs to the probability of occurrence for SB1_S_C4.
3.7.Risk mitigation
The BN verifies that improving the reliability of SB4 or SB5 can reduce the probability of both flash and pool fire significantly.For this case,it is more feasible to improve the reliability of SB5,because O11 and O31 are involved in SB5.Therefore,as shown in Fig.18,de-activating O11 (SB5_BE1) and O31(SB5_BE2) during 09:30-10:30 and 11:00-12:10 can improve the reliability of SB5.As the number of persons (bunkering operators) at site are reduced from five to two at these times,the probability of ignition can be reduced from 0.05 to 0.02.
Accordingly,the BNs were refined.Taking HE1 as an example,the refined BN is shown in Fig.19 Table 11.shows the improvement of the reliability of SB5 after these refinements.
The refined BNs models were used to re-evaluate the risks of this case Fig.20.shows the change of IR as the distance from the source of release increases at different times.Apparently,the IR values meet the IMO IR criterion Fig.21.shows the SR (F-N curves)where the F-N curves fall into acceptable region at any time.
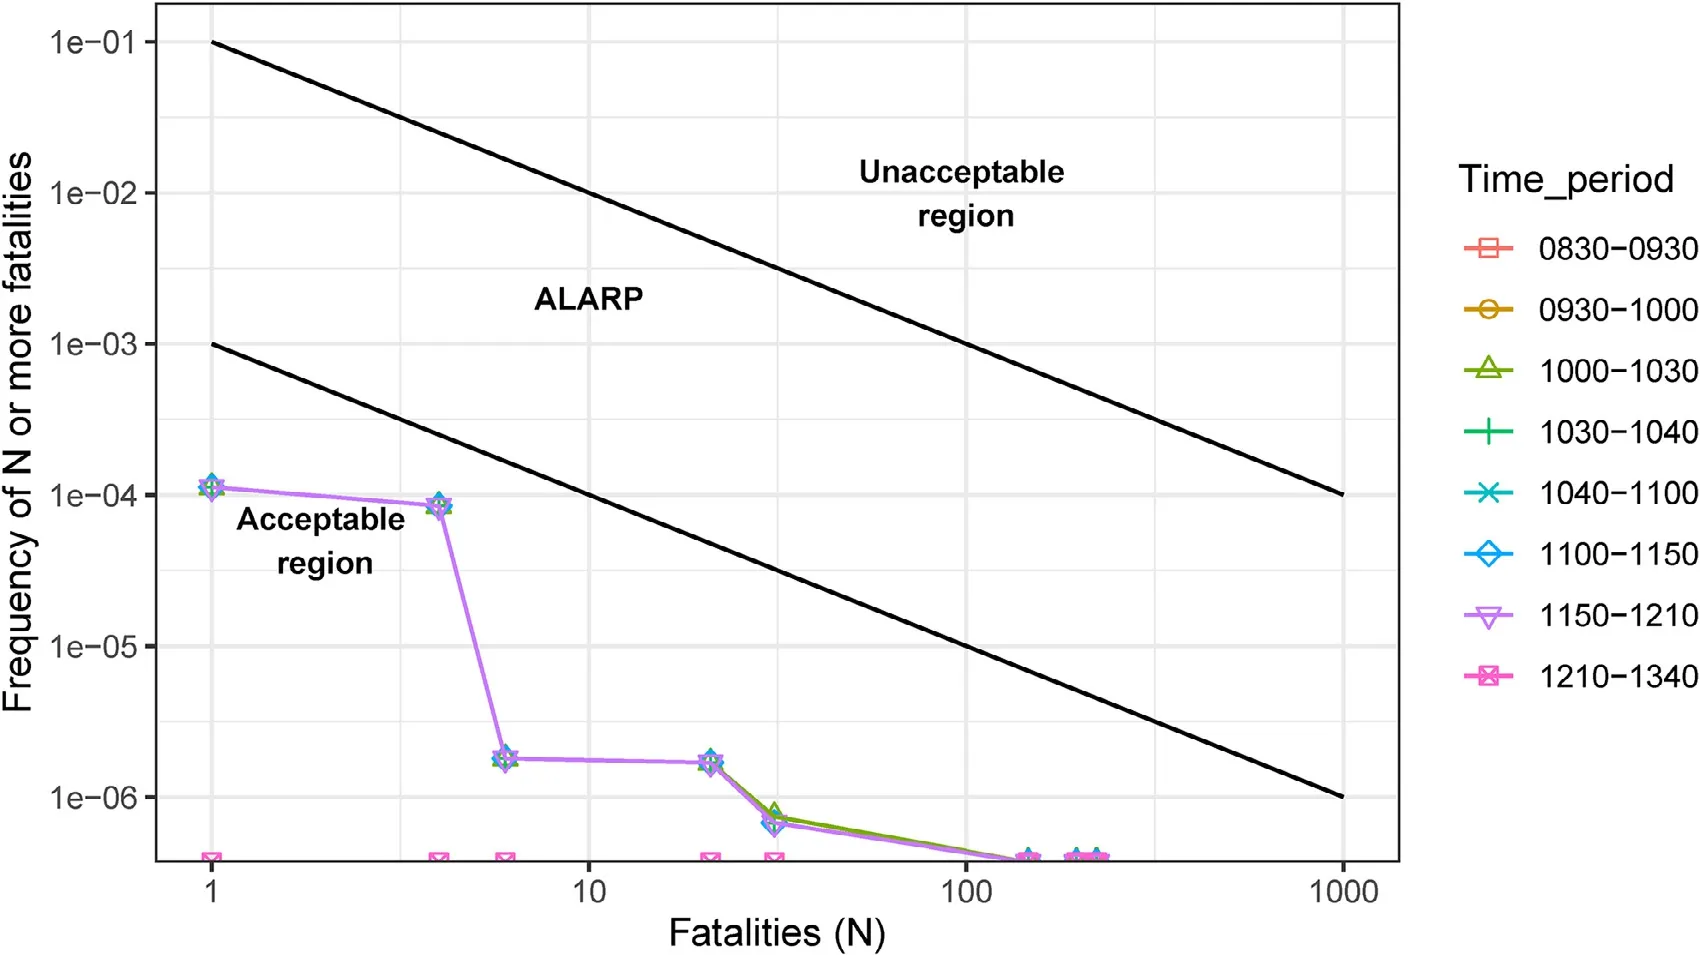
Fig.21. F-N curves at different times given the risk mitigation measures taken.
3.8.Limitations
The generalizability of the results for the case study in this paper is subject to certain limitations.For instance,in calculating the severity of consequences,this research used a two-dimensional type of software which cannot consider the three-dimensional layout of the ship and surroundings,and therefore,the results obtained might be conservative.In terms of human error,this case study used the existing data extracted from nuclear industry.The main reason is no human error date available for the LNG bunkering industry.
Further research could be undertaken by utilizing the proposed BN-based DQRA methodology to explore the consequential impacts by using three-dimensional computational fluid dynamics methods[77].The human error analysis model could be explored as well.
4.Discussion
As demonstrated in the case study,the BN has the following advantages when compared with the Bowtie model which is not suitable to handle the dynamic risks of LNG bunkering SIMOPs: (1)The logical relationships between events in an EET are encoded in CPTs which makes the graphical causal relationships more concise and has higher computational efficiency;(2) The contributions of the SBs to the probability of occurrence for a certain consequence can be diagnosed using the BN;and (3) When a SIMOP event commences or terminates,the BN can easily activate or deactivate the related nodes based on identified evidence.
Compared with the Bowtie model,the BN has more capacity to handle complicated risk models,for example: (1) The binary AND/OR gates in FTA can be overcome by employing probabilistic gates;(2) The binary events (working/not working) states in FTA can be overcome by introducing multi-state events in BN;(3)The common-cause-failure dependencies which cannot be considered in FTA and ETA can be taken into account in BN;and (4) The learning function of a risk analysis model can be realized in the BN.Therefore,BN can be used as a predictive tool to evaluate the risk in future by generating posterior probabilities based on evidence,for example,the incidents,near misses or the improvement of safety philosophy for relevant parties (such as port authority,LNG supplier or shipping company).
5.Conclusions
This article has the following significant findings:
•The proposed DQRA methodology can consider activations or deactivations of SIMOP events at different times to establish a dynamic risk analysis model,thus making the model closer to the reality of LNG bunkering SIMOPs.
•The proposed DQRA methodology can apply existing IMO risk criterion.This doesn’t need to change the customary practices of risk analysts in the maritime industry.However,IR and SR should be used simultaneously,as they deal with different aspects and should not be considered to completely overlap.
•The FST based expert’s knowledge data acquisition approach addressed the problem of lacking data at the early stage of LNG bunkering industry.
•Contribution of individual SIMOP event to the total risk can be diagnosed in the DQRA,accordingly,more targeted risk mitigation measures can be proposed based on diagnosis results.
•The proposed DQRA methodology can reduce the uncertainty of the results of risk assessment because the safety measures at the LNG bunkering site can be reflected in the risk analysis model.For instance,in the case study,the probability of delayed ignition is determined by the actual SIMOP events.
The risk results obtained by the proposed methodology may be utilized by (1) designer of LNG bunkering process to design an LNG bunkering SIMOPs timetable;(2) the LNG bunkering superintendent to determine which SIMOP events on the site should be carried out simultaneously with LNG fuel transfer.The results obtained through the proposed model can improve the real-time situational awareness among the operators and/or crews.
Availability of data and materials
The data that support the findings of this study are available from the corresponding author upon reasonable request..
Declaration of Competing Interest
The authors declare that they have no known competing financial interests or personal relationships that could have appeared to influence the work reported in this paper.
CRediT authorship contribution statement
Hongjun Fan:Conceptualization,Methodology,Validation,Formal analysis,Resources,Data curation,Writing–original draft,Project administration.Hossein Enshaei:Conceptualization,Validation,Resources,Data curation,Writing–review &editing,Project administration.Shantha Gamini Jayasinghe:Validation,Writing–review &editing.
Acknowledgment
The authors would like to express their gratitude to the experts who participated in the online questionnaire survey.
 Journal of Ocean Engineering and Science2023年5期
- Journal of Ocean Engineering and Science的其它文章
- New solitary waves and exact solutions for the fifth-order nonlinear wave equation using two integration techniques
- Numerical treatment of temporal-fractional porous medium model occurring in fractured media
- Optimal Kalman-like filter for a class of nonlinear stochastic systems
- New soliton wave solutions of a (2+1)-dimensional Sawada-Kotera equation
- Review of enhancement for ocean thermal energy conversion system
- Prediction of residual tensile strength of glass fiber reinforced polymer bars in harsh alkaline concrete environment using fuzzy metaheuristic models