
Click chemistry-based enrichment strategy for tracing cellular fatty acid metabolism by LC-MS/MS
2023-12-14 08:31RuJieYangJianZouJiaYueLiuJiangKunDaiJianBoWan
Journal of Pharmaceutical Analysis 2023年10期
Ru-Jie Yang,Jian Zou,Jia-Yue Liu,Jiang-Kun Dai,Jian-Bo Wan
State Key Laboratory of Quality Research in Chinese Medicine, Institute of Chinese Medical Sciences, University of Macau, Macao SAR, 999078, China
Keywords:Click chemistry-based enrichment EPA metabolism Terminal alkyne-labeled EPA Azide-modified resin LC-MS/MS
ABSTRACT Fatty acids (FAs),which were initially recognized as energy sources and essential building blocks of biomembranes,serve as the precursors of important signaling molecules.Tracing FA metabolism is essential to understanding the biochemical activity and role of FAs in physiological and pathological events.Inspired by the advances in click chemistry for protein enrichment,we herein established a click chemistry-based enrichment(CCBE)strategy for tracing the cellular metabolism of eicosapentaenoic acid(EPA,20:5 n-3) in neural cells.Terminal alkyne-labeled EPA (EPAA) used as a surrogate was incubated with N2a,mouse neuroblastoma cells,and alkyne-labeled metabolites(ALMs)were selectively captured by an azide-modified resin via a Cu(I)-catalyzed azide-alkyne cycloaddition reaction for enrichment.After removing unlabeled metabolites,ALMs containing a triazole moiety were cleaved from solid-phase resins and subjected to liquid chromatography mass spectrometry (LC-MS) analysis.The proposed CCBE strategy is highly selective for capturing and enriching alkyne-labeled metabolites from the complicated matrices.In addition,this method can overcome current detection limits by enhancing MS sensitivity of targets,improving the chromatographic separation of sn-position glycerophospholipid regioisomers,facilitating structural characterization of ALMs by a specific MS/MS fragmentation signature,and providing versatile fluorescence detection of ALMs for cellular distribution.This CCBE strategy might be expanded to trace the metabolism of other FAs,small molecules,or drugs.
1.Introduction
Fatty acids (FAs) were initially recognized as an energy source and the essential building block of biomembranes in living organisms.FAs also serve as precursors of intra-and inter-cellular signaling molecules,which are implied in multiple physiological processes[1].An increasing number of studies have indicated that aberrations in FA metabolism are associated with the pathogenesis of numerous diseases,such as metabolic disorders,cardiovascular diseases [2],carcinomas [3],and neurological diseases [4].Thus,tracing FA metabolism is essential to understanding its biochemical activity and the role in physiological and pathological events.
To detect metabolites of interest,a metabolic tracer must be metabolically indistinguishable from naturally occurring FAs in the body but also distinct in specific physicochemical properties [5].Radioactive [6] and stable [5,7,8] isotope-labeled FAs have been widely used to trace FA metabolism due to their identical physicochemical properties and metabolic fate with native FAs.However,the handling radioactive materials requires special laboratory facilities and official permissions.More importantly,the3H or14C isotope FAs have low or moderate specific activities,leading to the limited sensitivity of the method [9].Labeling with stable isotopes (2H or13C) has become a gold-standard method to reveal the metabolic fates of FAs by mass spectrometry (MS) [10,11].Polyunsaturated FAs (PUFAs),including eicosapentaenoic acid(EPA) and docosahexaenoic acid (DHA),can be metabolized into diverse classes of eicosanoids under enzymatic or nonenzymatic catalysis [12,13].These eicosanoids serve as the critical signaling molecules in a variety of biochemical processes.MS analysis of eicosanoids is currently challenged by their low abundance in biologically complex matrices and the low detection sensitivity resulting from poor electrospray ionization efficiency [14-16].To resolve these problems,several chemical derivatization reagents targeting the carboxyl group,including dimethylaminophenacyl bromides [17,18],2-dimethylam-ino-ethylamine [19],and 5-(dimethylamino) naphthalene-1-sulfonyl piperazine/5-(diethylamino) naphthalene-1-sulfonyl piperazine [16],have been developed to determine eicosanoids in biological samples with enhanced MS sensitivity and improved chromatographic performance.However,FAs can also be metabolized to produce triglycerides and phospholipids,and these incorporated lipids without carboxyl groups cannot react with the above chemical derivatization reagents.
To our knowledge,α,β carbons [20],carboxyl group [21],or carbon-carbon double bonds [16,22] of naturally occurring FAs principally involve FA metabolism in living organisms without changing the ethyl group in the omega terminus.Thus,substituting of terminal ethyl groups with alkyne groups generates a promising probe to systematically trace FA metabolism since alkyne-labeled FA is absent in organisms,and its corresponding metabolites can be specifically conjugated to azidocontaining compounds by click chemistry,known as the Cu(I)-catalyzed azide-alkyne cycloaddition (CuAAC) reaction [23].This click chemistry-based strategy has been widely used to probe the biological processes of small biogenic molecules,including cholesterol [24,25],dopamine [26],sphingolipids [27],and ascarosides [28],due to its bioorthogonal reaction conditions,high specificity,high efficiency,and broad substrate scope[29].In recent years,clickable lipid analogs,such as alkyne FAs,have been extensively applied to investigate FA metabolism and lipidprotein interactions [9,11,30,31].However,the targeted qualitative profiling of biogenic FA-derived metabolites is still challenged by the great structural diversity and broad magnitude of concentrations ranging from femtomolar to micromolar.Additionally,these studies cannot capture and enrich the metabolites of interest from the highly complicated matrix.
Long-chainn-3 PUFAs,such as EPA(20:5n-3)and DHA (22:6n-3),are termed essential FAs,and they are not biosynthesized de novo in mammals [32].n-3 PUFAs have been well documented to exert obvious health benefits on multiple chronic diseases,including neurological diseases [33],cardiovascular diseases [34],liver injury[32,35],and inflammation-associated disorders[36].The EPA level in the brain is over 250-fold lower than that of DHA,compared to 4-and 5-fold lower levels of EPA vs.DHA in plasma and erythrocytes,respectively,whereas EPA and DHA enter the brain at similar rates[37].Accumulated evidence has demonstrated that EPA,but not DHA,is responsible for the clinical benefits of depressive disorder[38,39].Thus,it is essential to clarify EPA metabolism in the brain to explain the considerable differences in concentration and efficacy.In the present study,therefore,we aim to develop a click chemistrybased enrichment (CCBE) strategy for tracing cellular EPA metabolism by liquid chromatography mass spectrometry (LC-MS).This strategy was accomplished by alkyne-labeled EPA followed by incubation with neural cells,and enrichment of labeled metabolites by azide-modified resin via click chemistry.
2.Materials and methods
2.1.Chemicals and materials
Terminal alkyne-labeled EPA (EPAA),terminal alkyne-labeled DHA (DHAA),and their native FAs (i.e.,EPA and DHA) were purchased from Cayman Chemical Company (Ann Arbor,MI,USA).Acetonitrile (ACN),methanol,CHCl3,N,N-dimethylformamide(DMF),trifluoroacetic acid (TFA),triisopropyl silane (TIPS),ascorbic acid (AA),2-(4-(20)-1H-1,2,3-triazol-1-yl)acetic acid (BTTAA),5-azidopentanoic acid,and NovaPEG Rink Amide resin were obtained from Sigma-Aldrich (St.Louis,MO,USA).Tetramethylrhodamine azide (TAMRA-N3,Fig.S1) was purchased from Guangzhou Kefan Biotechnology Co.,Ltd.(Guangzhou,China).Ultra-pure water was prepared using a Millipore water purification system(Bedford,MA,USA).
2.2.Azide-modified resin synthesis
Azide-modified resins were synthesized by a one-step acylation reaction as described previously [28].NovaPEG Rink Amide resin HYR (Sigma-Aldrich) was weighed out into a dried vial with a loading capacity of 0.35 mmol/g(50 mg,0.0175 mmol),and 3 mL of DMF was added.Valeric acid azide (3.8 mg,0.027 mmol),N,Ndiisopropylethylamine (9 μL,0.053 mmol),and 2-(1H-benzotriazole-1-yl)-1,1,3,3-tetramethylammonium tetrafluoroborate(16.9 mg,0.053 mmol) were sequentially added.The reaction was placed on a magnetic stirrer at room temperature for 0.5 h.A Kaiser test was used to determine whether the reaction was completed.The reaction mixture was transferred to a fresh 20-mL vial and washed with 10 mL ofN-methyl-2-pyrrolidone(NMP),water,NMP,and dichloromethane.After air-drying,the resins were dissolved in NMP at a concentration of 10 mg/mL and stored at 4°C.
2.3.Cell culture, cell viability assay, and labeling with EPAA
Neuro2a cells(N2a cells),a mouse neuroblastoma cell line,were maintained in Dulbecco's Modified Eagle Medium (DMEM) supplemented with 10%(V/V)fetal bovine serum(FBS),penicillin(100 U/mL),and streptomycin(100 μg/mL)and maintained in a humified atmosphere of 5%CO2at 37°C.The effects of EPA and EPAA on cell viability were assessed by cell counting kit-8 (CCK-8) colorimetric assay.Briefly,N2a cells were seeded onto 96-well culture plates at a density of 6.0×10³cells/well.EPAA and EPA were added into each well at different concentrations.After incubation for 24 h,10 μL of CCK-8 solution was added to each well and incubated for another 2 h at 37°C.Cell viability was calculated as the percentage absorbance relative to the control groups.For labeling with EPAA,N2a cells were seeded at a density of 1.0 × 10⁶cells/well in 6-well plates.After incubation for 24 h,N2a cells were labeled by supplementation with EPAA or EPA at a final concentration of 20 μM for another 24 h at 37°C.
2.4.Lipid extraction and click-chemistry-based enrichment
The total lipids of N2a cells were extracted by liquid-liquid extraction as described previously [11].Briefly,the cells on a 6-well plate were washed with ice-cold phosphate-buffered saline(PBS) twice.The cellular lipids were extracted with 500 μL of methanol:CHCl3solution (5:1,V/V).The resulting extract was collected and centrifuged at 20,000gfor 5 min.The supernatant was transferred into a new 1.5-mL microcentrifuge tube and evaporated to dryness under nitrogen gas.Subsequently,the residue was redissolved in 10 μL of CHCl3for a click reaction.
The click reaction was performed as described previously with slight modification [28].The extracted lipid solution was added to 500 μL of click reaction mix (7.5 μL of 100 mM BTTAA,40 μL of 50 mM CuSO4,and 50 μL of 1 M AA,dissolved in DMF),and 50 μL of 10 mg/mL synthesized resin slurry in DMF.The reactions were performed by incubating the mixture on a vibrator (1,000 rpm) at room temperature for 8 h.The resin-bound metabolites were washed with DMF:water (1:3 (V/V),1 mL),DMF:water (1:1 (V/V),1 mL),DMF (1 mL),and CHCl3(0.3 mL) and then evaporated to dryness under a nitrogen stream.The reagent mixture of TFA:water:TIPS (95:2.5:2.5 (V/V/V),50 μL) was used to cleave the metabolites from the resin,and the cleavage reaction was conducted at 1,000 rpm for 0.5 h.The supernatant was collected,and the resin was washed thrice(3×0.3 mL).The supernatant and washes were combined into a fresh tube and evaporated under a nitrogen stream.The residue was dissolved in 100 μL of ACN and centrifuged at 14,800 rpm for 10 min before LC-MS analysis.
2.5.LC-MS analysis
LC-MS analysis was performed on an ACQUITYTMultraperformance liquid chromatography (UPLC) coupled with a Waters SYNAPT G2-Si Q-TOF high-definition mass spectrometer equipped with an electrospray ionization (ESI) source (Waters Corp.,Manchester,UK).Chromatographic separation was achieved on an ACQUITY BEH C18column(100 mm×2.1 mm i.d.,1.7 μm)at 45°C.The binary mobile phase composed of 0.1%(V/V)formic acid solution (phase A,pH 2.6) and acetonitrile containing 0.1% (V/V)formic acid(phase B)at a flow rate of 0.3 mL/min was used with the following gradient elution program:isocratic 5%B(0-1 min),linear gradient from 5%to 95%B(1-16 min),isocratic 95%B for 4 min,and then back to 5%B for 5 min.The sample injection volume was 3 μL,and the sample injector was maintained at 6°C.
The high-resolution mass spectrometer was operated in positive ion mode with the following parameters:40 kV of sample cone voltage,2.5 kV of capillary voltage,150°C of source temperature,450°C of desolvation temperature,900 L/h of nitrogen gas flow,and 10 L/h of cone gas flow.MS data were acquired in continuum mode fromm/z50 to 1200 in MSEmode with an acquisition rate of 0.15 s/scan.The collision energy was operated from 15 to 45 V,and a leucine-enkephalin calibrant solution (400 pg/mL) was continuously infused into the MS at a flow rate of 10 μL/min during MS analysis.
2.6.Identification of sn-position phospholipid regioisomers
Thesn-position phospholipid regioisomers were identified by phospholipase A2 (PLA2) digestion as described previously with slight modification[40].Briefly,10 μL of PLA2 enzyme(P9279,≥600 U/mg;Sigma-Aldrich) and 50 μL of CaCl2solution (100 mM) were added to EPAA-treated N2a cell lysates,and then incubated at 37°C for 4 h.The total lipids were extracted and analyzed by LC-MS as described above.
2.7.Immunoblot assay and fluorescence detection by confocal microscopy
The effects of EPA and EPAA on protein expression were measured by immunoblot assay as standard protocol.Briefly,1.0×106cells/well were seeded in 6-well plates overnight and then treated with 20 μM EPA or EPAA for 24 h.Total proteins were extracted using radioimmunoprecipitation assay(RIPA)lysis buffer.Immunoblot analysis was conducted according to standard protocol.The primary antibodies used were as follows: G proteincoupled receptor 120 (GPR120) (Bioworld Technology,Saint Paul,MN,USA),CYP2E1(Cell Signaling Technology,MA,USA),and anti-ELOVL5 (Abcam,Cambridge,MA,USA).The secondary antibody was horseradish peroxidase(HRP)-conjugated goat anti-rabbit IgG(Cell Signaling Technology).
For fluorescence detection,N2a cells,SH-SY5Y neuroblastoma cells(SY5Y cells),or HepG2 cells were treated with 20 μM EPAA or EPA for 24 h.After washing with PBS three times,the cells were fixed with 4% (V/V) paraformaldehyde for 10 min.Subsequently,500 μL of click reaction mix (7.5 μL of 100 mM BTTAA,40 μL of 50 mM CuSO4,and 50 μL of 1 M AA,dissolved in PBS) supplemented with 1 mM TAMRA-N3was added to react with the alkynelabeled metabolites at room temperature for 1 h.After washing with phosphate buffer saline with 0.05% Tween-20 (PBST) three times,the cells were mounted with 4′,6-diamidino-2-phenylindole(DAPI) and examined by a Leica TCS SP8 confocal laser scanning microscope (Leica Microsystems,Wetzlar,Germany).
3.Results and discussion
3.1.Chemical and biological characterization of EPAA
Although several terminal alkyne-labeled FAs,including oleic acid alkyne,palmitic acid alkyne,stearic acid alkyne,and arachidonic acid alkyne,have been widely used to reveal FA metabolism and lipid-protein interactions [9,11,30,31],this is the first study that used EPAA as a surrogate to investigate the cellular activities of EPA.Next,the chemical and biological characterization of EPAA and EPA were explored and compared.The molecular similarity between EPAA and EPA was assessed by SwissADME software(http://www.swissadme.ch/index.php),a free web tool to evaluate the physicochemical properties of small molecules.As shown in Fig.1A,a high degree of similarity in the two molecular radar maps was observed.EPAA and EPA have identical topological polar surface area values (37.30),defined as the surface sum over all polar atoms or molecules.Furthermore,the molar refractivity(97.66 and 95.82),a measure of the total molecular polarizability,and the log (P-value)(5.99 and 5.30),an index of hydrophobicity,of EPAA and EPA,respectively,showed the same tendency.Chemical similarities between EPAA and EPA suggest that EPAA might mimic the physiological bioactivity of EPA in biological systems.To further compare the biological characterization of EPAA and EPA,their effects on cell viability,the protein expressions ofn-3 PUFA-specific receptors,and the related metabolic enzymes in N2a and SY5Y cells were assessed.EPAA at the concentrations ranging from 0 to 100 μM showed no significant inhibition of cell proliferation in both N2a and SY5Y cells,compared to that of the EPA-treated group or control group,as detected by CCK-8 colorimetric assay(Fig.1B).GPR120 functions as a receptor for long-chainn-3 PUFAs,including EPA.It has a critical role in versatile physiological processes,including anti-inflammation,adipogenesis,and insulin sensitization [32,41].The possibility of receptor activation by EPAA was assessed by examining GPR120 expression in neural cells.As shown in Figs.1C and D,treatment with EPAA or EPA significantly induced the cellular protein expression of GPR120 in both N2a cells and SY5Y cells,compared to that of the control group.However,no significant difference was observed between the EPAA-and EPA-treated groups.A similar tendency was observed in the cellular protein expression of the main metabolic enzymes,including CYP2E1 and ELVOL5[42,43].
Additionally,to assess the possible difference in binding energy between EPAA/EPA with these proteins,we adopted AutoDock Vina 1.2.2 software to perform protein-ligand molecular docking.As shown in Fig.S2,EPA bound well to the GPR120,CYP2E1,and ELVOL5 proteins due to hydrophobic interactions (such as Pi-Pi stacking and Pi-alkyl stacking).Due to bearing a carboxylic group,EPA formed one hydrogen bond with amino acid residue ASP-190 of the CYP2E1 protein and HIS-147 of the ELVOL5 protein.With these hydrophobic interaction forces,the binding energies of GPR120,CYP2E1,and ELVOL5 between EPA were -5.1,-5.1,and -4.0 kcal/mol,respectively.Interestingly,EPAA shared very similar binding poses and interactions with these proteins.Moreover,EPAA could form one hydrogen bond with the amino acid residue ASP-190 of the CYP2E1 protein and ASP-126 of the ELVOL5 protein.The binding energies of GPR120,CYP2E1,and ELVOL5 between EPAA were-5.7,-4.6,and-4.1 kcal/mol,respectively.These data indicate that EPAA/EPA could spontaneously and stably bind with these proteins with similar binding energies.
Collectively,these data illustrate that EPAA exhibits similar chemical and biological properties to EPA.Thus,EPAA can serve as a promising surrogate to characterize the metabolism of native EPA.
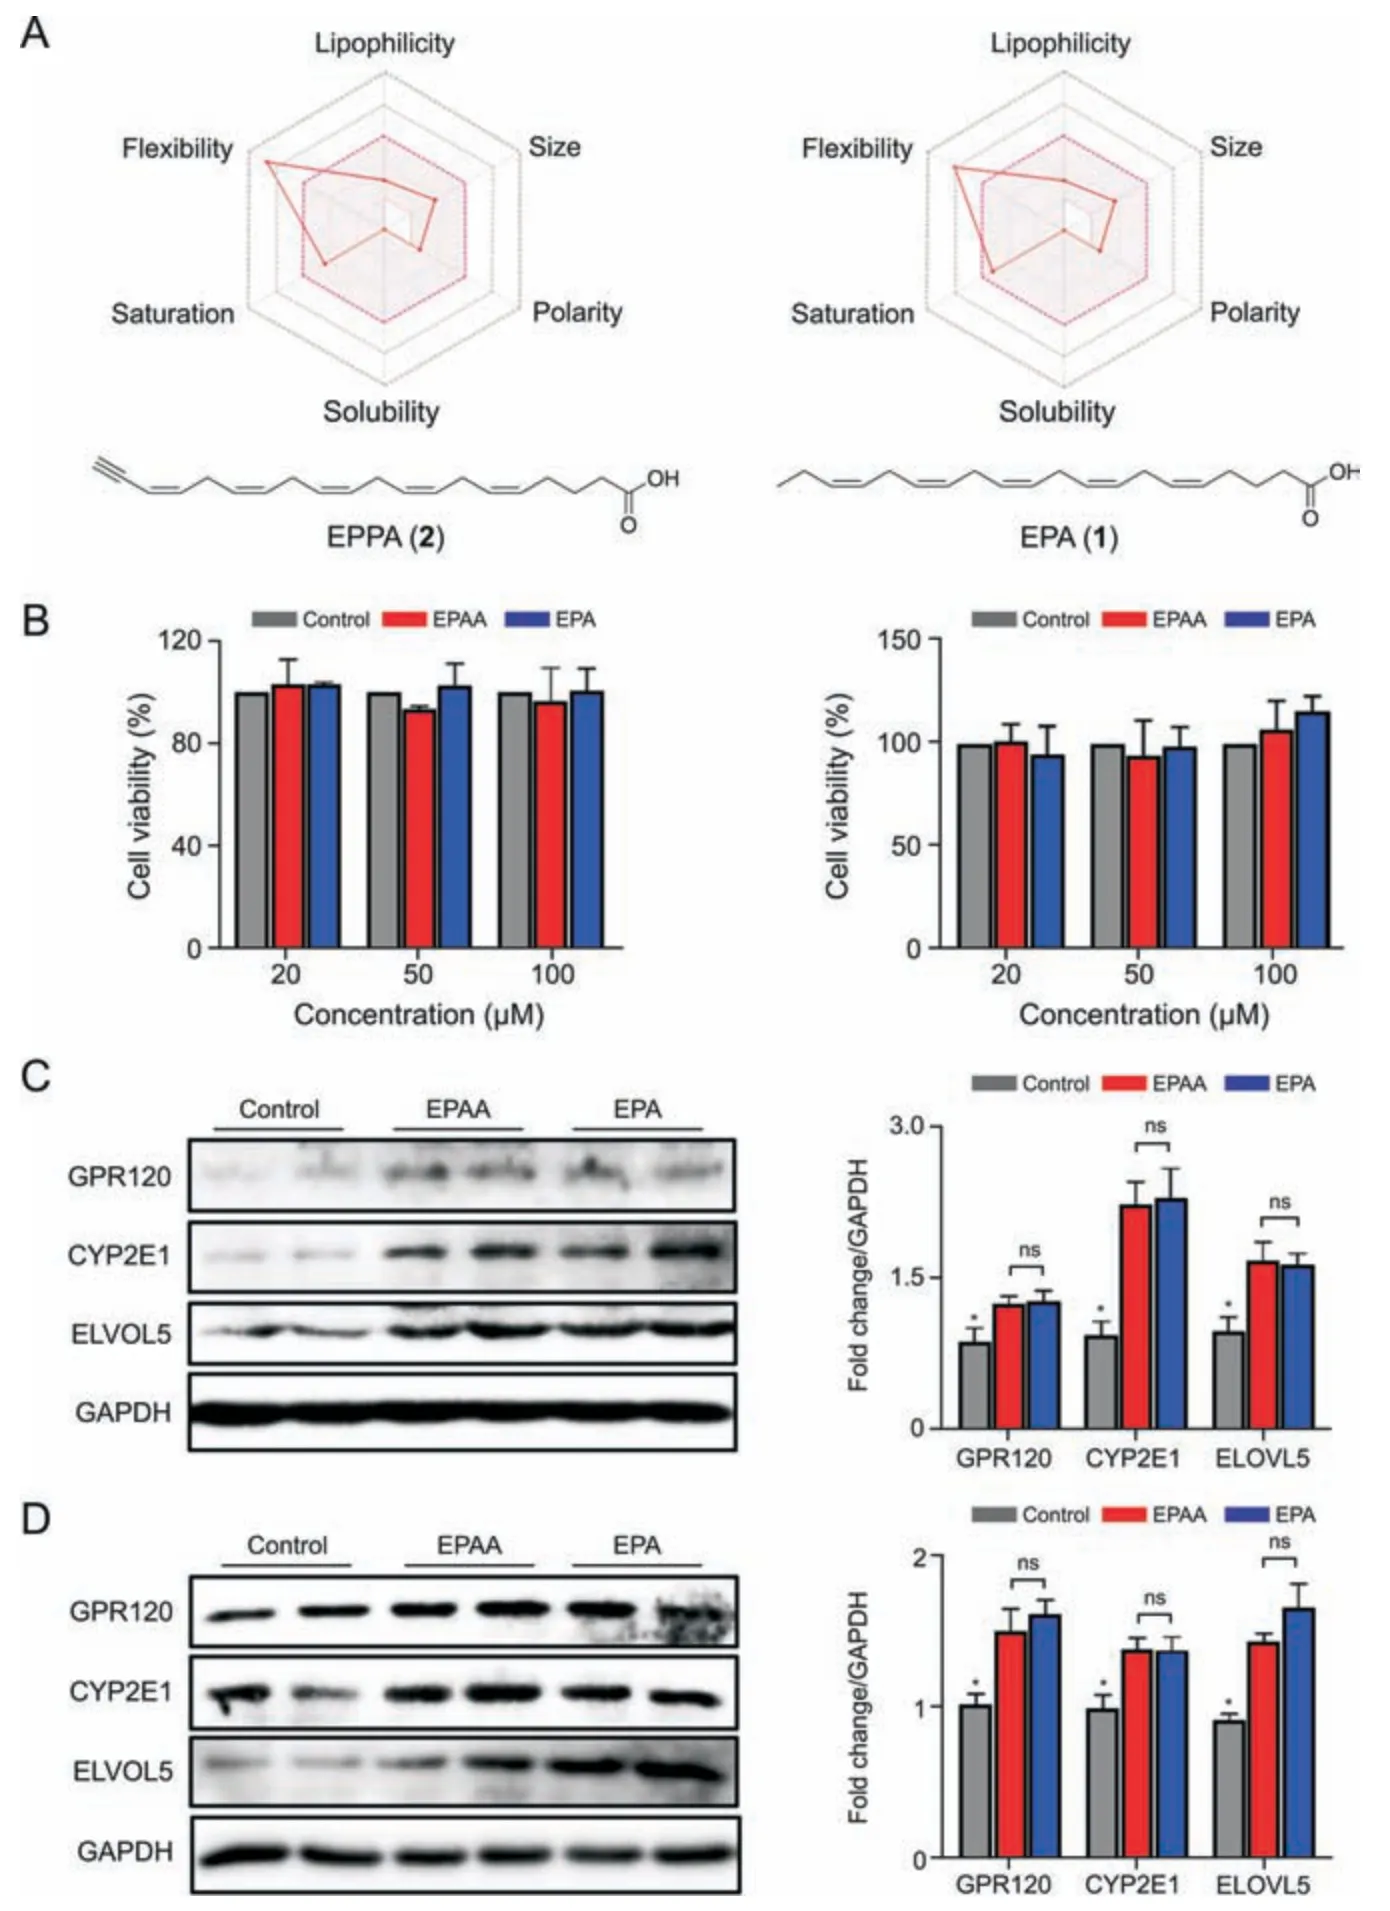
Fig.1.Chemical and biological characterization of terminal alkyne-labeled EPA(EPAA).(A)The bioavailability radar maps of EPAA(left)and eicosapentaenoic acid(EPA,right)were constructed by SwissADME.(B)Cell viability of EPAA-and EPA-treated Neuro2a(N2a)cells(left)and SH-SY5Y neuroblastoma(SY5Y)cells(right).Immunoblot images(left)and the corresponding densitometry analysis (right) of the specific receptor (G protein-coupled receptor 120 (GPR120)) and related metabolic enzymes (CYP2E1 and ELVOL5) in (C) N2a cells and(D)SY5Y cells after treatment of EPAA or EPA.ns:not significant.*P <0.05 vs.EPAA-or EPA-treated group.The cell viability assay and immunoblot analysis were repeated at least three times.GAPDH: glyceraldehyde-3-phosphate dehydrogenase.
3.2.CCBE strategy
To understand the biochemical activity and metabolic characteristics of FAs,it is essential to develop a sensitive and specific approach for detecting FA-derived metabolites with a broad coverage.In this study,we aimed to develop a click chemistrybased strategy to enrich and trace cellular EPA metabolites by LC-MS.EPAA (2) was incubated with N2a cells,and the alkynelabeled metabolites (ALMs) were selectively captured by an azide-modified resin via a CuAAC reaction for enrichment.After removing unlabeled metabolites by washing resin-bound ALMs,ALMs containing a triazole moiety were cleaved from the solidphase resins and subjected to LC-MS analysis (Fig.2A).Azidemodified resins were synthesized by NovaPEG Rink-amide resin with valeric acid azide via an acylation reaction (Fig.S3).The cleaved ALMs with a linker moiety installed by a modified Rinkamide resin can produce a reporter-ion (m/z100.0749) in the positive ion mode,which provides an exclusive MS/MS fragmentation signature,facilitating the structural recognition of ALMs (Fig.2B).
3.3.Optimization of CuAAC reaction conditions
To achieve best enrichment performance of CCBE,the CuAAC reaction conditions,including BTTAA (0.1-2 mM),CuSO4concentration (2-10 mM),reaction time (2-10 h),and ALM cleavage reaction time (0.5-2.5 h),were optimized by a single factor experiment and evaluated using EPAA (2) standard.The resulting linker-modified EPAA-LNK(3)was monitored by LC-MS.As a result,1.5 mM BTTAA,4 mM CuSO4,8 h CuAAC reaction time,and 0.5 h cleavage reaction time were selected for the subsequent experiment (Fig.S4).
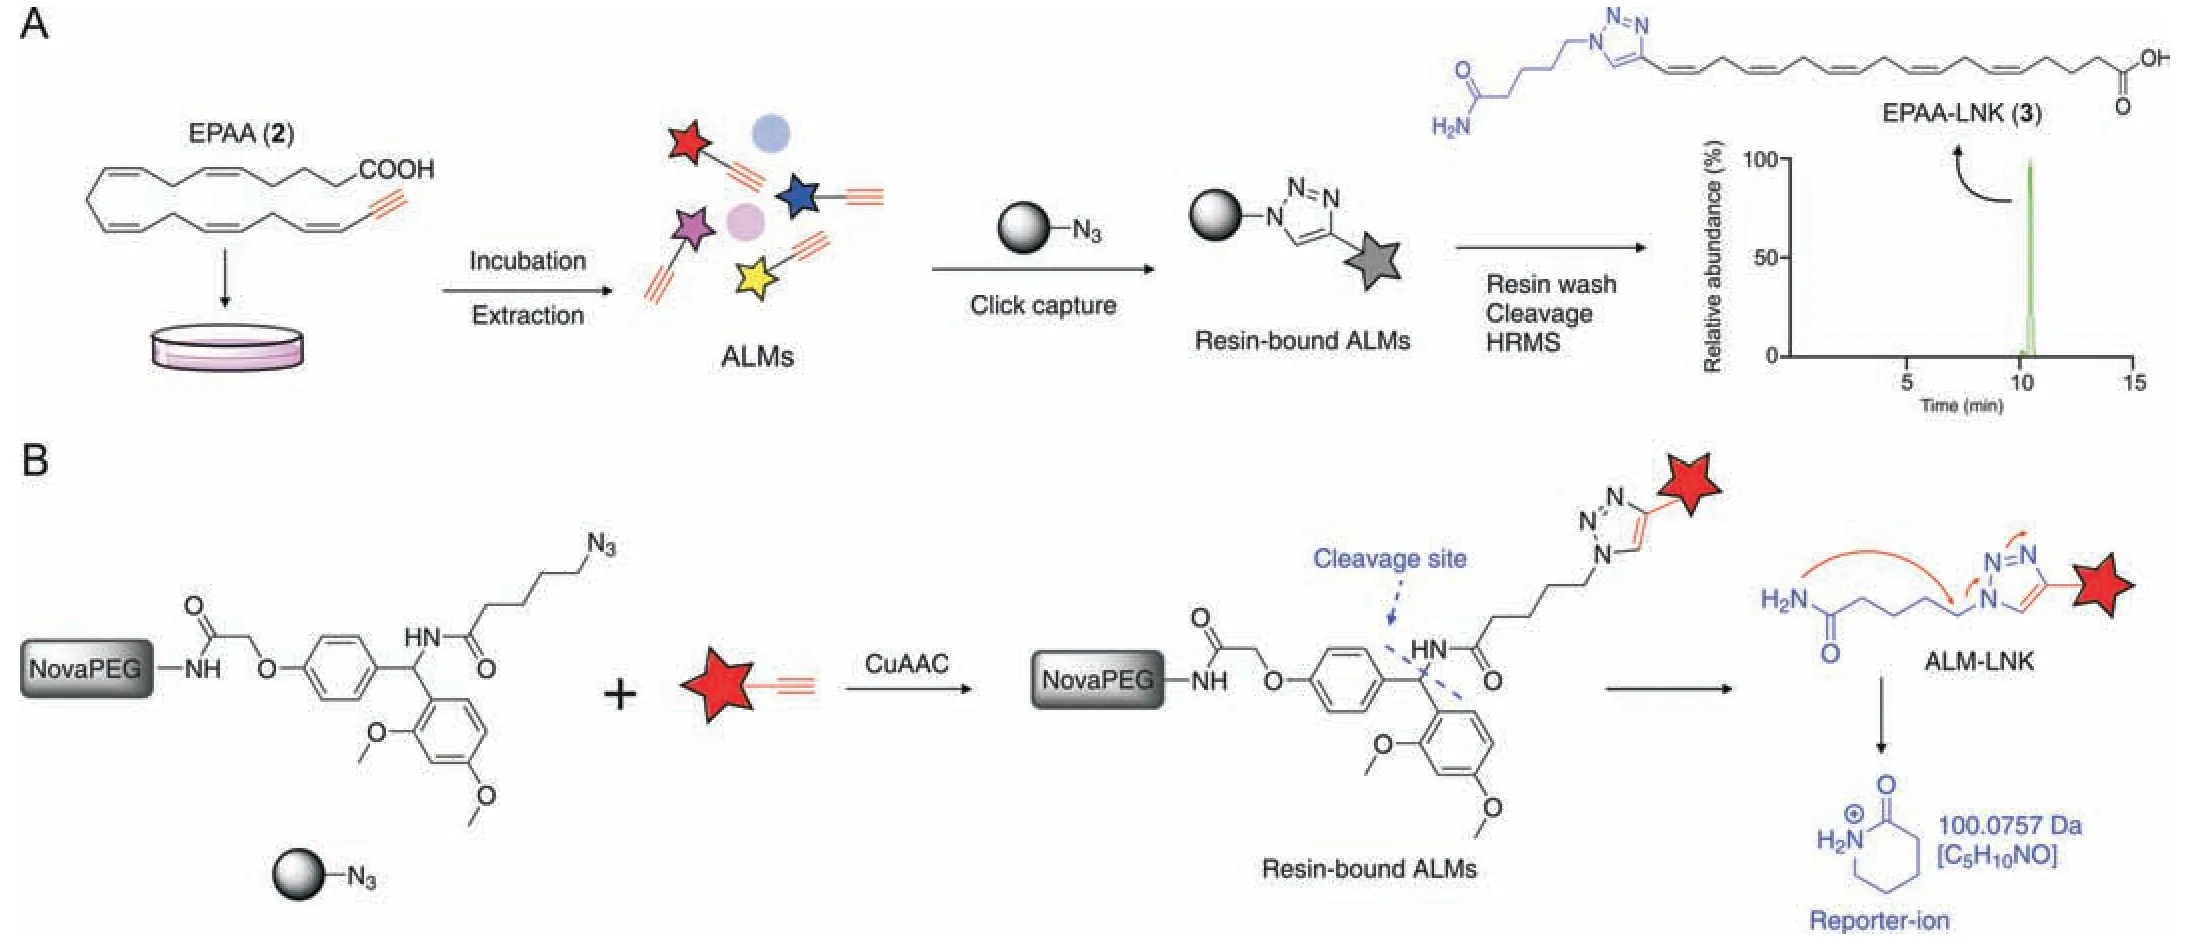
Fig.2.Schematic representation of the click chemistry-based strategy for enrichment and profiling of cellular metabolites.(A) Terminal alkyne-labeled eicosapentaenoic acid(EPAA)was incubated with the cells and metabolized to alkyne-labeled metabolites(ALMs).ALMs were selectively captured by an azide-modified resin via a Cu(I)-catalyzed azidealkyne cycloaddition (CuAAC) reaction.After removing unlabeled metabolites,ALMs containing a linker moiety were cleaved and subjected to liquid chromatography mass spectrometry (LC-MS) analysis.(B) CuAAC reaction between azide-modified resin and ALMs,and the cleaved ALMs with a linker moiety installed by a modified Rink-amide resin(ALM-LNKs)produces a reporter-ion(m/z 100.0749)in positive ion mode,facilitating the structural recognition of ALMs.HRMS:high resolution mass spectrometry.NovaPEG:Nova polyethylene glycol.
3.4.Evaluation of the performance of the CCBE method
Under the optimized enrichment conditions,the sensitivity and dynamic range of the CCBE method were first evaluated using terminal alkyne-labeled standards (i.e.,EPAA and its primary metabolite,DHAA).A mixed solution containing EPAA,DHAA,EPA,and DHA at a concentration of 20 μM was analyzed by LC-MS before and after CCBE treatment.Due to bearing a carboxyl group,native FAs (EPA and DHA) and alkyne-labeled FAs (EPAA and DHAA) were detected in negative ion mode with higher MS sensitivity than that in the positive ion mode.After CCBE,EPAA/DHAA in their linker-modified form (EPAA/DHAA-LNKs) was released from the resins and detected by LC-MS in positive ion mode.As shown in Fig.3A,before CCBE,these four standards were detectable by LC-MS in negative ion mode,and the MS intensities of EPAA and DHAA were lower than those of native EPA and DHA,respectively.After enrichment by CCBE,the MS sensitivities of EPAA-LNK (3) and DHAA-LNK (4) were dramatically enhanced,as evidenced by both an 8.3-fold decrease in their limit of detection(LOD) (Fig.3B),12.5 and 15.0-fold decreases in limit of quantitation (LOQ) (Fig.S5) compared to EPA and DHA,respectively.However,native FAs were no longer detected in negative mode.Due to bearing a triazole group,the ionization efficiency of the linker-modified EPAA-LNK (3) and DHAA-LNK (4) was greatly enhanced,resulting in increased MS sensitivity.These results indicate that this click chemistry-based enrichment method can substantially enhance the MS sensitivity of target analytes.Furthermore,the MS/MS spectra of EPAA-LNK (3) and DHAA-LNK(4) showed a high diagnostic reporter-ion with am/zof 100.0749 in positive ion mode(Fig.3C),facilitating the recognition of EPAAderived metabolites.Native EPA and DHA did not exhibit this superiority (Fig.S6).We also observed good linear relationships between mass signals and the concentrations of alkyne-labeled FAs,including EPA and DHA (0-10 μM,Rvalues >0.98;Fig.3D),indicating that a wide dynamic range of alkyne-labeled metabolites can be enriched by the proposed CCBE.
Next,we assessed the selectivity and enrichment performance of the CCBE method using a given standard mixture and EPAAprobed cell metabolomes.First,seven endogenous small molecules without terminal alkyne groups,including dopamine,phenylalanine,cholic acid,leukotriene B3,16-HETE,DHA,and palmitic acid (Table S1),were added to EPAA and DHAA standard solutions,yielding a given standard mixture.After treatment by CCBE,the post enrichment solution and washing eluent were subjected to LC-MS analysis.As shown in Fig.4A,the peaks of seven small molecules without terminal alkyne groups (nontargeted standards,S1-S7) detected in the pre-enrichment solution are absent following enrichment by CCBE but remain in the washing eluent.EPAA/DHAA in their linker-modified form (EPAA-/DHAALNKs)was exclusively detected in post enrichment solution.Similar results were observed in EPAA-probed N2a cells.After CCBE enrichment,several representative nontargeted metabolites(N1-N5) detected in cell lysis sample were absent in the post enrichment solution but remained in the washing eluent (Fig.4B).EPAA-LNK (3),a linker-modified form of EPAA (2),was clearly visible with increased MS intensity after enrichment;trace amount of EPAA were still detected in the washing eluent.Based on the peak areas of EPAA detected in the pre-enrichment and washed samples,more than 99% of the added EPAA was captured by the azidemodified resins (99.13% ± 0.15%,n= 3).Additionally,several typical target metabolites before and after enrichment were monitored and compared.As shown in Fig.4C,after CCBE,most target metabolites exhibited higher detection sensitivities with good peak shapes,except the metabolites containing groups with good ionization efficiencies,such as phosphatidylcholine (PC) and LysoPC.Collectively,these results indicate that the developed CCBE method is highly selective for capturing and releasing metabolites containing terminal alkynes.
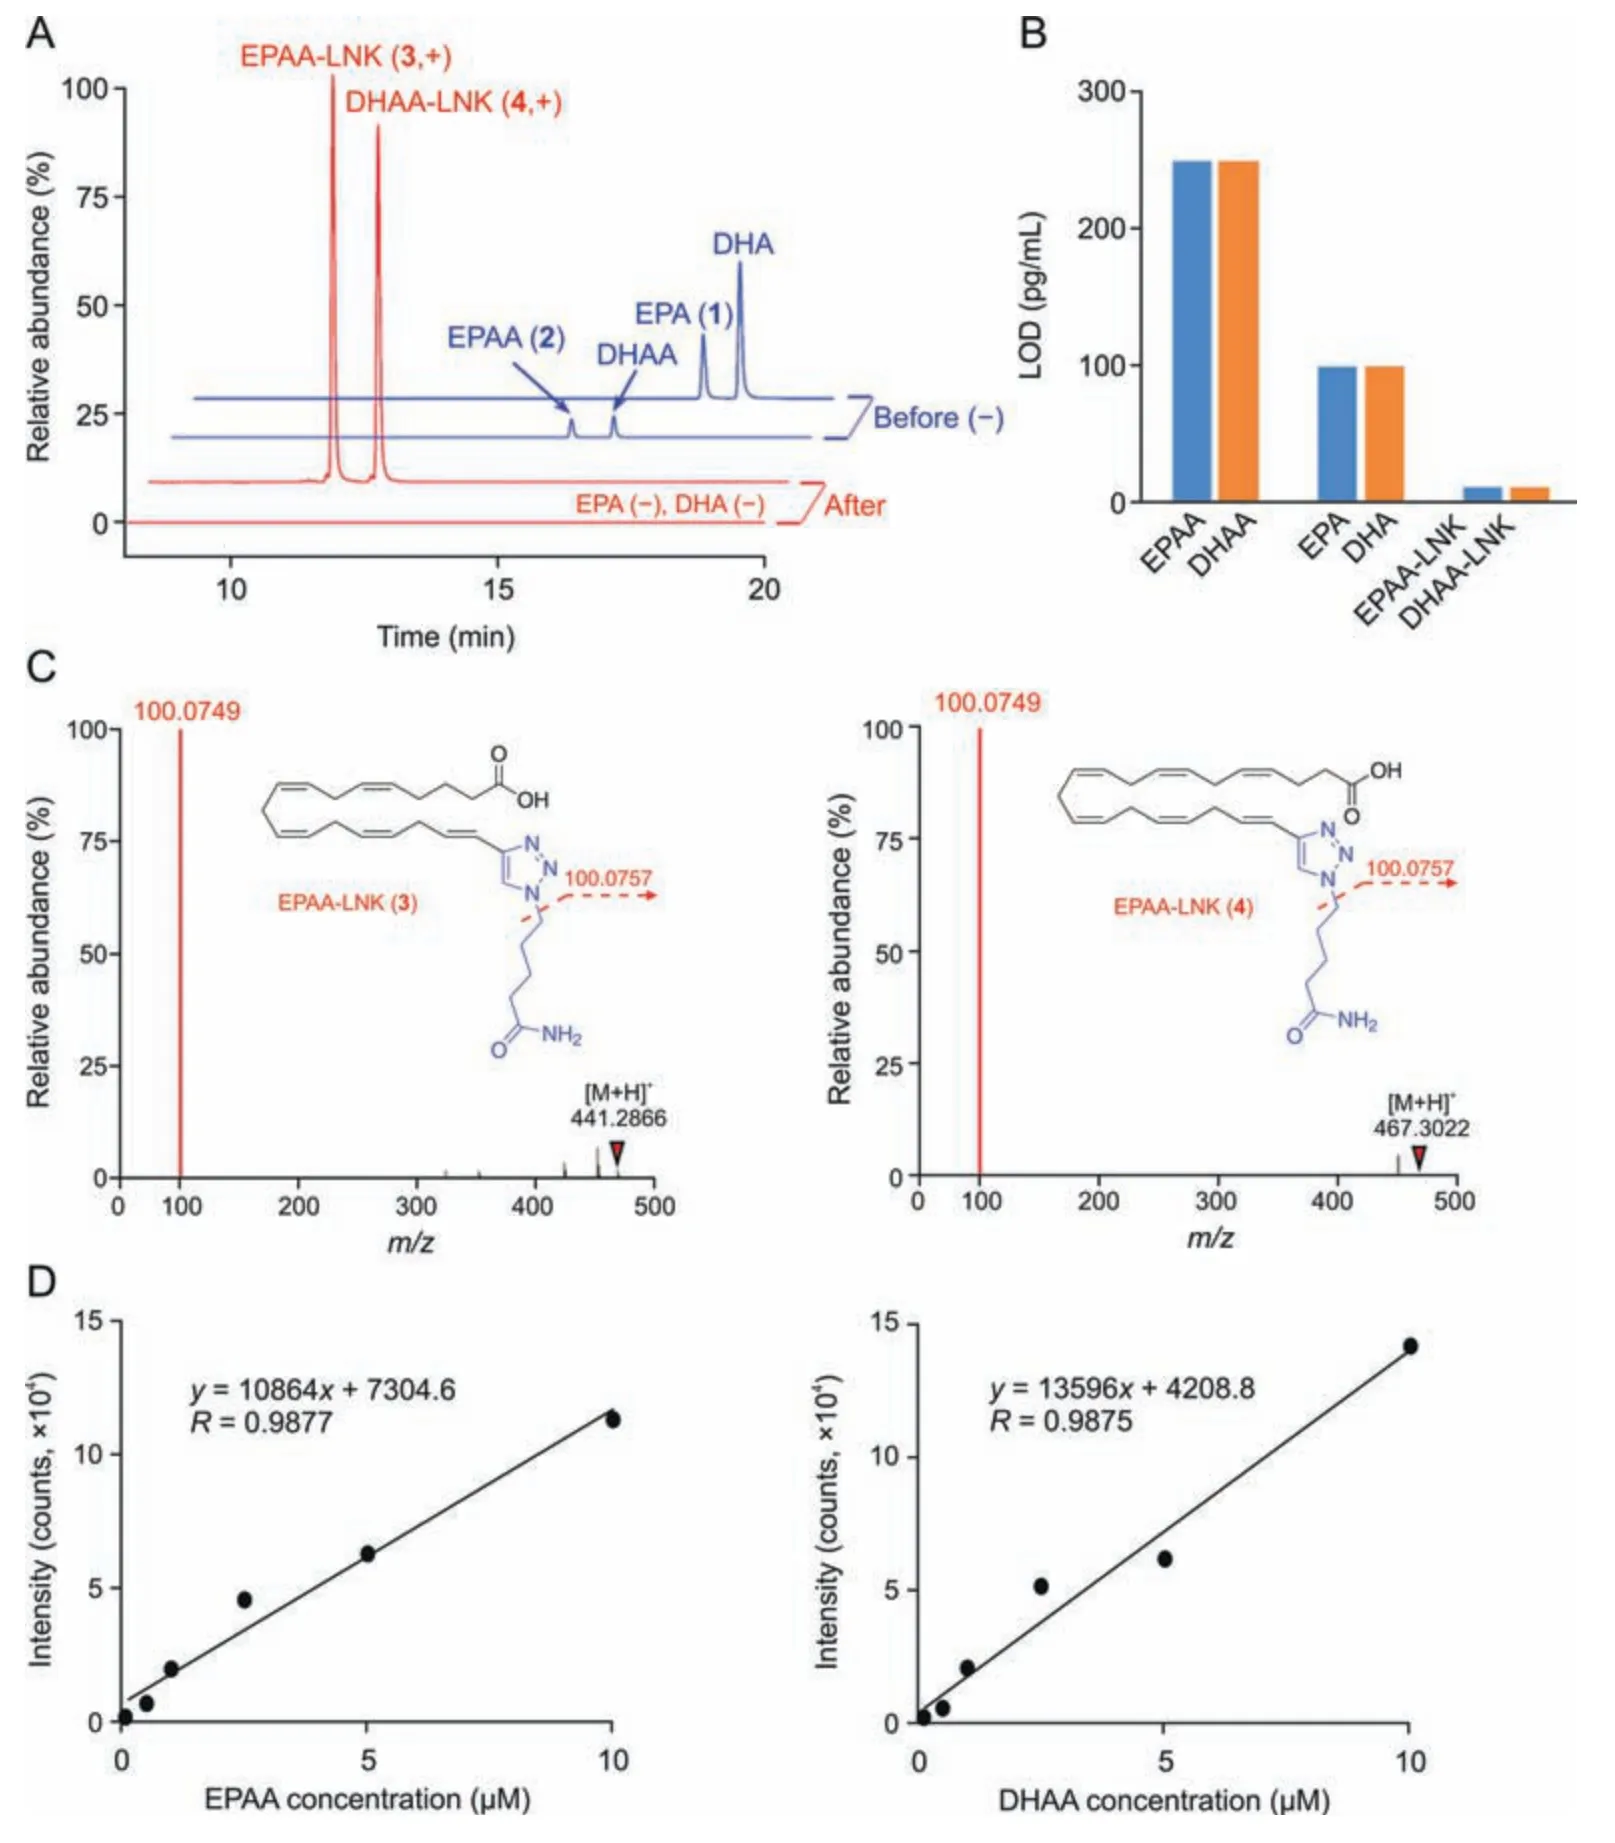
Fig.3.Liquid chromatography mass spectrometry (LC-MS) performance of click chemistry-based enrichment (CCBE) with standards.(A) Extracted ion chromatograms (EICs) of eicosapentaenoic acid (EPA),docosahexaenoic acid (DHA),and terminal alkyne-modified fatty acids (FAs) (terminal alkyne-labeled EPA (EPAA) and terminal alkyne-labeled DHA(DHAA))before(blue)and after(red)CCBE treatment.The FAs before CCBE were determined in the negative(-)ion mode,and alkyne-labeled FAs after CCBE were detected as the corresponding linker-modified forms(EPAA-LNK and DHAA-LNK)in positive(+)ion mode.(B)Comparison of their limit of detection(LOD).(C)Tandem mass spectrometry(MS/MS)spectra of EPAA-LNK (left) and DHAA-LNK (right) in the positive ion mode.(D) Dynamic range of EPAA (left) and DHAA (right) using the CCBE method.
3.5.Improvement in separation performance of sn-position glycerophospholipid regioisomers upon CCBE
Thesn-position glycerophospholipid(GPL)regioisomers,which are the relative position of fatty acyl esterified on the glycerol backbone,are challenging to separate well with conventional reversed-phase liquid chromatography (RPLC) [14,44],which greatly affects their characterization and quantification.As shown in Fig.5A,the representativesn-position GPL regioisomers(Fig.S7),including monoglyceride (MG),lysophosphatidic acid,lysophosphatidylethanolamine (LPE),and lysophosphatidylcholine (LPC),detected in EPA-treated cellular samples severely overlapped and showed a single peak under current chromatographic conditions.GPLs incorporated by EPAA or its metabolites can react with azide-modified resins via CuAAC.Due to the introduction of a polar 1,2,3-triazole-3-valeramide group,the polarity of linker-modified GPLs increased,leading to a decreased retention time on a C18column.Furthermore,sn-position isomers of linker-modified GPLs achieved baseline separation with good peak shape.
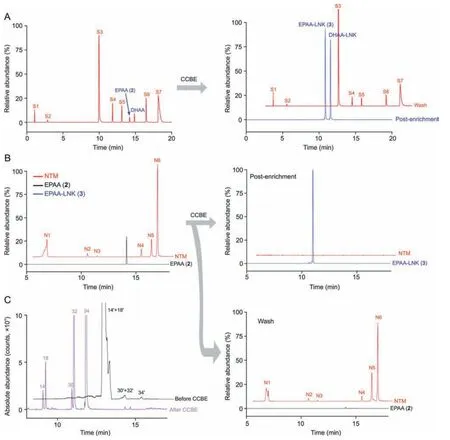
Fig.4. Selectivity and enrichment performance of click chemistry-based enrichment(CCBE)strategy.Chromatograms for enrichment experiments with(A)given mixed standards and (B) Neuro2a (N2a) cellular metabolomes.Peaks of nontarget standards without terminal alkyne (S1-S7) and nontargeted metabolites (NTM,N1-N6) detected in the preenrichment solution are absent following enrichment by CCBE but remain in the washing eluent.The mixed standards are composed of terminal alkyne-labeled EPA (EPAA)and terminal alkyne-labeled DHA (DHAA) and seven endogenous metabolites,including dopamine (S1);phenylalanine (S2);cholic acid (S3);leukotriene B3 (S4);16-hydroxyeicosatetraenoic acid (16-HETE) (S5);docosahexaenoic acid (DHA) (S6);and palmitic acid (S7).Their chemical structures are shown in Table S1. N1: tR 6.03 min, m/z 309.1130; N2: tR 10.14 min, m/z 387.179; N3: tR 10.81 min, m/z 376.262; N4: tR 14.64 min, m/z 524.374; N5: tR 15.85 min, m/z 282.282;and N6: tR 16.37 min, m/z 920.688.(C)Extracted ion chromatograms(EICs)of representative target metabolites in terminal alkyne-labeled EPA(EPAA)-treated cell samples before(black)and after(lilac)CCBE.The target metabolites before and after CCBE were detected as the forms of alkyne-labeled metabolites (ALMs, n') and their linker-modified forms (ALM-LNKs, n),respectively. 14: lysophosphatidylcholine(LPC,0:0/22:5);18:LPC(22:5/0:0);30:monoglyceride(MG,0:0/22:5);32:MG(22:5/0:0);and 34:docosapentaenoic acid(DPA,22:5).Detailed information on the peak assignments is listed in Tables S2 and S3.
To further characterize the precise structures ofsn-position GPL regioisomers,a phospholipase A2(PLA2)digestion experiment was conducted.EPAA-treated N2a cell lysates were incubated with PLA2 enzyme,and the resulting lipids were extracted and subjected to LC-MS analysis.PLA2 enzyme can specifically catalyze the hydrolysis ofsn-2 ester bond,generating a free FA and the corresponding lysoglycerophospholipid species.Taking LPC (22:5) as an example(Fig.5B),treatment with PLA2,sn-2 LPC (22:5),but not thesn-1 isomer,can hydrolyze thesn-2 acyl chain,yielding choline glycerophosphate and docosapentaenoic acid(DPA).As shown in Fig.5C,our CCBE method was found to well separatesn-position isomers of LPC (22:5) and show two separate peaks (retention time(RT) =9.09 min and RT =9.26 min) in the chromatogram.After treatment with PLA2,the first peak (RT = 9.09 min) almost completely disappeared without changing the intensity of the second peak (RT =9.26 min),and the abundance of the corresponding digestion product DPA was greatly increased,indicating that the first and the second peaks correspond tosn-2 andsn-1 LPC(22:5),respectively.The elution order ofsn-position isomers in the reverse-phase column was consistent with previous studies[45,46].By means of PLA2 digestion,the precise structures of LPC(20:5) and LPE (22:5) were characterized (Fig.S8),and othersnposition GPL regioisomers were identified as shown in Table S2.These results clearly indicate that the CCBE method could improve the separation ofsn-position GPL isomers,facilitating their quantification and structural characterization.
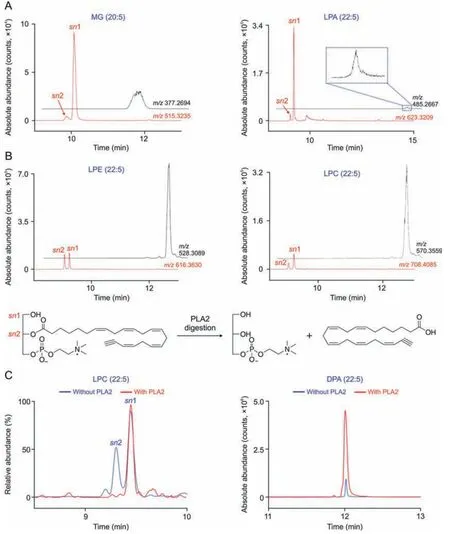
Fig.5.Chromatographic performance of representative sn-position glycerophospholipid (GPL) regioisomers.(A)Extracted ion chromatograms(EICs) of representative sn-position GPL isomers detected in terminal alkyne-labeled EPA(EPAA)-treated Neuro2a(N2a)cells by click chemistry-based enrichment(CCBE)(red)and eicosapentaenoic acid(EPA)-treated cells (black),including monoglyceride (MG,20:5),lysophosphatidic acid (LPA,22:5),lysophosphatidylethanolamine (LPE,22:5),and lysophosphatidylcholine (LPC,22:5).The regioisomers in EPAA-treated N2a cells were detected as their corresponding linker-modified forms.(B)Biochemical reaction of lysophosphatidylcholine(LPC,0:0/22:5) catalyzed by phospholipase A2(PLA2),an enzyme hydrolyzing the sn-2 position acyl chain to yield choline glycerophosphate and docosapentaenoic acid(DPA).(C)EICs of LPC(22:5,left)and DPA (right) in EPAA-treated N2a cells with or without PLA2 reaction,which was followed by CCBE and detected as the forms of alkyne-labeled metabolites (ALM)-LNKs.
3.6.Annotation of EPAA-derived cellular metabolites with CCBE
Using the optimized CCBE method,we next investigated the metabolites derived from EPAA in N2a cells by LC-MS.Dataindependent high-definition MSEmode acquires the accurate mass of precursor ions and product ions using alternating low-and high-energy collision-induced dissociation in one parallel analysis.The MSEraw data was directly processed by UNIFI software without data conversion.The detailed workflow of the discovery and annotation of ALMs is illustrated in Fig.S9A.To exclude potential resin-derived signals,the metabolite was scored as a‘hit’when its mass signal in cell samples was greater than 10,000 and significantly higher than that in control samples (>5-fold,P<0.01).For further screening of the potential ALMs,ions with a reporter ion fragment (m/z100.0749,[C5H10NO]) and am/zgreater than 441.2897 were selected by UNIFI.The stringent criteria ensured that these ions were EPAA-modified metabolites,excluding their βoxidation products by breaking down FAs.As a result,a total of 376 candidate ALM-LNKs were highlighted in EPAA-probed N2a cells.Due to bearing a 1,2,3-triazole-3-valeramide group,the accurate mass of ALM-LNKs was subtracted by C5H6N4O (m/z138.0542),yielding the accurate mass of the corresponding native metabolites,which were annotated according to their MS and MS/MS data by matching with biochemical databases,including the Human Metabolome Database (HMDB,https://hmdb.ca/) and LIPID MAPS Structure Database (https://www.lipidmaps.org/).The MS match tolerance was set as 20 ppm.The structural elucidation of DPA is shown in Fig.S9B as an example.One potential concern of this study is that a linker moiety installed on metabolites by the resins might affect the structural annotation process by dominating the fragmentation pattern of the reporter-ion.As shown in Fig.6,the MS/MS spectra of four representative ALM-LNKs,including 8-HEPE,MG (0:0/22:5),LPE (0:0/22:5),and PC (22:5/14:0),contained several mass fragments unique to native metabolites,in addition of the prominent reporter-ion(m/z100.0749).These data indicate that the fragmentation patterns of ALM-LNKs preserve critical characteristics or features of native metabolites,facilitating their structural annotation using MS/MS data.Utilizing the proposed interpretation workflow,59 EPA-derived metabolites were identified,as shown in Tables S2 and S3.
The largest family is the GPLs incorporated by EPAA and its elongated or subsequently desaturated FAs.These free FAs are mainly incorporated into GPLs by de novo pathway and the remodeling pathway under the action of lysophosphatidic acid acyltransferases and lysophospholipid acyltransferases,respectively [47].In this study,in addition to the diagnostic ion,the characteristic headgroup fragments were also clearly observed in the MS/MS spectra of GPLs (Figs.6C and D),which assists in clarifying the GPL subtype.Taking LPE(0:0/22:5)and PC(22:5/14:0)as examples,the highest abundant headgroup ions,m/z141.0127 for LPE and phosphatidylethanolamine (PE) andm/z184.0775 for LPC and PC,were observed in their MS/MS spectra.Among 376 candidate ALMs,106 LPC and PC,32 LPE and PE,and 4 sphingomyelins were extracted using UNIFI software.
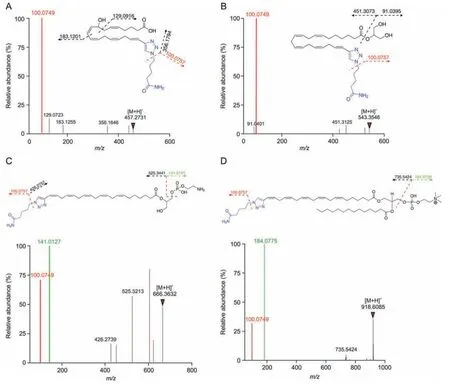
Fig.6.Tandem mass spectrometry (MS/MS) fragmentation of representative metabolites with linker-modified forms after click chemistry-based enrichment (CCBE).(A) 8-hydroxyeicosatetraenoic acid (8-HEPE),(B) monoglyceride (MG,0:0/22:5),(C) lysophosphatidylethanolamine (LPE,0:0/22:5),and (D) phosphatidylcholine (PC,22:5/14:0).
The second family of detected ALM-LNKs is EPA-derived free FAs,including DPA(22:5,n-3),tetracosapentaenoic acid(24:5,n-3),tetracosahexaenoic acid (24:6,n-3) and DHA (22:6,n-3).DPA was found to be the primary EPA-derived metabolite with the highest abundance in N2a cells,suggesting a high conversion rate from EPA to DPA.DHA plays a crucial role in the growth and development of the central nervous system[48].The pathway of DHA biosynthesis from EPA has been controversial.A classical pathway requires direct conversion of EPA to DHA by the catalysis of Δ4-desaturase,but this desaturase may not be present in higher animals [49].A revised pathway was proposed in which EPA(20:5,n-3)is elongated to DPA(22:5,n-3)and further to 24:5n-3 by ELOVL2/5,desaturated to 24:6n-3 by FADS2 in microsomes,and then retro-converted to DHA(22:6,n-3) by peroxisomal β-oxidation [50].In this study,the intermediates 24:5n-3 and 24:6n-3 were detected in EPAA-treated cells,supporting the revised DHA biosynthesis pathway.This study still has several limitations: 1) the chemical and biological properties of EPAA with terminal alkyne is similar,but not exactly identical,with native EPA,compared to isotope-labeled FA;2) the metabolism targeting ethyl group of FA in omega terminus might be not detected;3) many compounds containing clickable group are not commercially available,which would limit the application of the newly developed CCBE strategy.
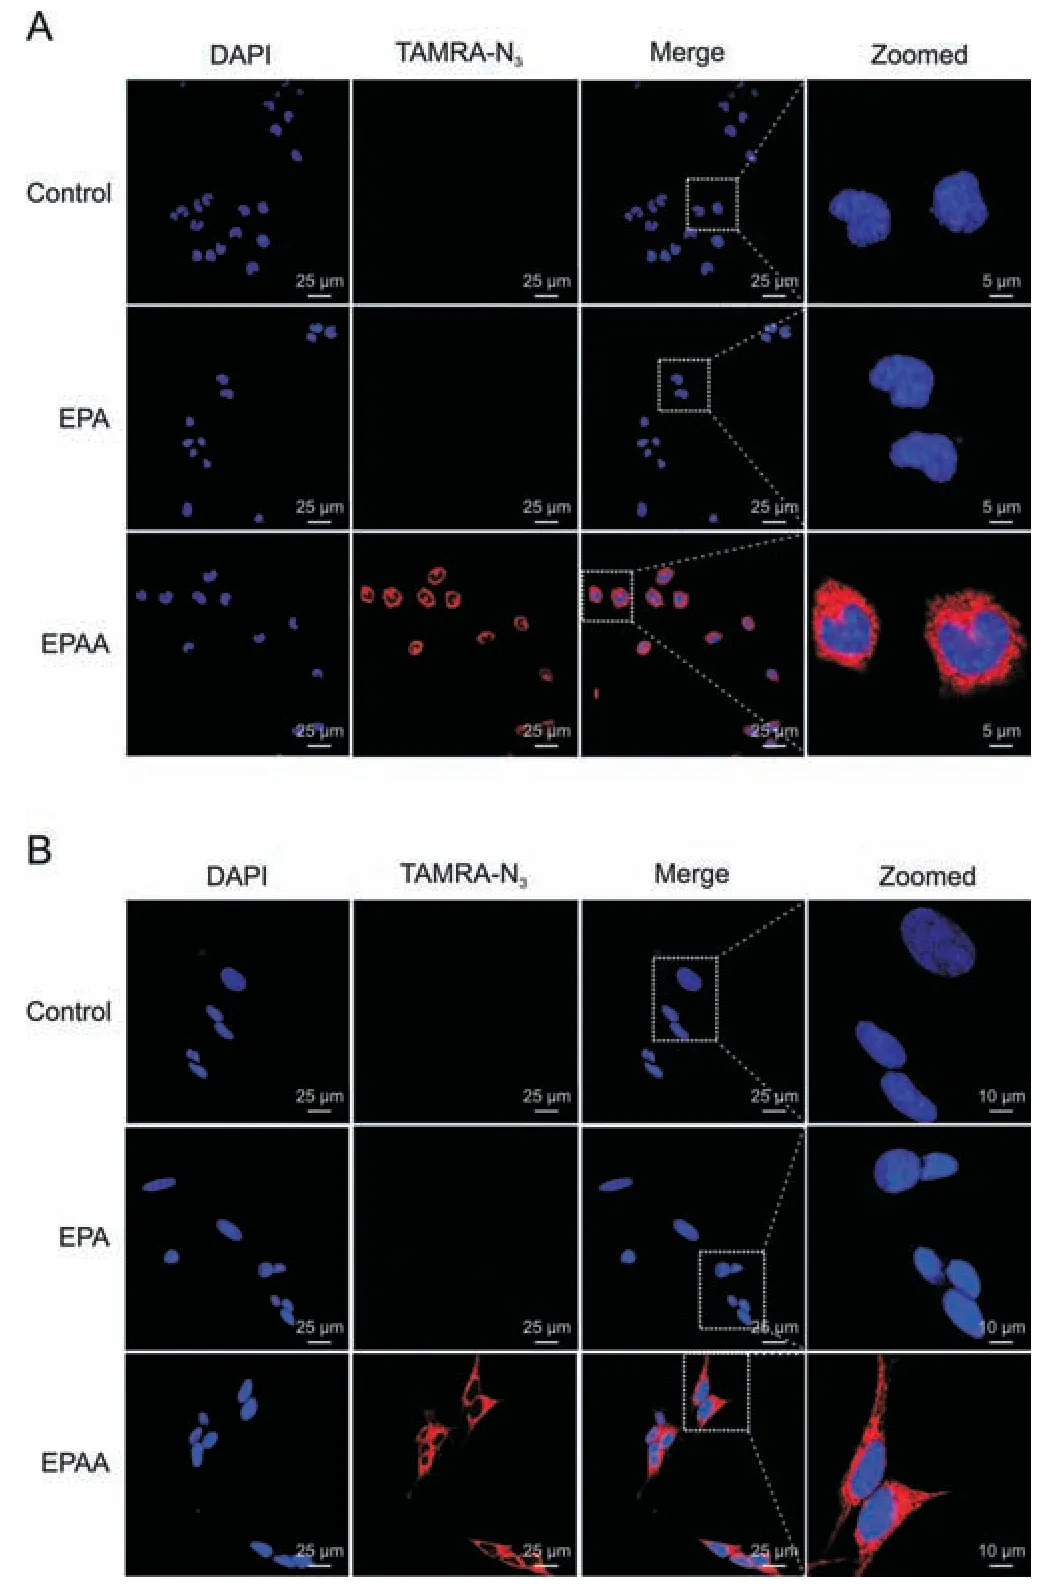
Fig.7. Fluorescence visualization of terminal alkyne-labeled EPA (EPAA) and its cellular metabolites in(A)Neuro2a(N2a)cells and(B)SH-SY5Y neuroblastoma(SY5Y)cells using tetramethylrhodamine azide(TAMRA-N3)dye.Cells were treated with EPAA or eicosapentaenoic acid (EPA) for 24 h and then fixed with 4% (V/V) paraformaldehyde.Terminal alkynes of EPAA and its metabolites in the fixed cells were reacted with TAMRA-N3 with red fluorescence by a Cu(I)-catalyzed azide-alkyne cycloaddition(CuAAC)reaction.After being washed,the cells were mounted with 2-(4-amidinophenyl)-6-indolecarbamidine dihydrochloride (DAPI) and examined by a confocal laser scanning microscope.
3.7.Visualization of EPAA and its cellular metabolites by fluorescence microscopy
The alkyne group of EPAA and its metabolites is expected to realize fluorescence detection by click reaction with azide groupcontaining fluorophores,which can be used to characterize the distribution and localization of EPA and cellular metabolites.This possibility was evaluated using three types of cells,including N2a cells,SY5Y cells,and HepG2 cells.Cells were treated with EPAA or EPA for 24 h and then fixed with 4%paraformaldehyde.Terminal alkynes of EPAA and its metabolites in fixed cells can be reacted with TAMRAN3with red fluorescence by the CuAAC reaction.As shown in Fig.7,a stronger fluorescence signal was observed inside N2a cells and SY5Y cells supplemented with EPAA,compared to the EPA and control groups.These results indicate that EPAA can enter cells efficiently,and metabolites with alkyne groups can be selectively attached to azide-containing dyes by click chemistry in cells.We also observed intense alkyne staining predominantly in the cytoplasm and cellular membrane.Similar results were observed in HepG2 cells (Fig.S10).Thus,this strategy allows us to parallelly characterize both EPA metabolism and the cellular localization of its metabolites.
4.Conclusion
In the present study,we described a click chemistry-based enrichment strategy for tracing cellular metabolism of EPA by LCMS,which is accomplished by alkyne-labeled EPA followed by incubation with neural cells,and enrichment in labeled metabolites by azide-modified resin via CuAAC reaction.EPAA exhibits similar chemical and biological properties and can serve as a promising surrogate to characterize the metabolism of native EPA.The proposed CCBE strategy is highly selective for capturing and enriching the alkyne-labeled metabolites from a complicated matrix and can enhance MS sensitivity of most target analytes.Furthermore,the CCBE strategy facilitates characterization ofsn-position glycerophospholipid regioisomers and structural recognition of relative metabolites by a high diagnostic reporter-ion with am/zof 100.0749 in positive ion mode.This CCBE strategy might be expanded to trace the cellular metabolism of other FAs,small molecules,or drugs.
CRediT author statement
Ru-Jie Yang: Experimentation,Data curation,Investigation,Methodology,Writing -Original draft preparation;Jian ZouandJia-Yue Liu: Experimentation;Jiang-Kun Dai: Experimentation,Methodology;Jian-Bo Wan: Conceptualization,Project administration,Supervision,Writing -Reviewing and Editing.
Declaration of competing interest
The authors declare that there are no conflicts of interest.
Acknowledgments
The work was financially supported by grants from the Research Committee of the University of Macau,Macao SAR,China (Grant No.: MYRG2022-00020-ICMS),and the Science and Technology Development Fund,Macao,China (File Nos.: 0074/2021/AFJ and 0052/2022/A1).
Appendix A.Supplementary data
Supplementary data to this article can be found online at https://doi.org/10.1016/j.jpha.2023.05.001.
 Journal of Pharmaceutical Analysis2023年10期
- Journal of Pharmaceutical Analysis的其它文章
- Protective effects of catalpol on cardio-cerebrovascular diseases: A comprehensive review
- Recent advancements in single-cell metabolic analysis for pharmacological research
- SPME as a green sample-preparation technique for the monitoring of phytocannabinoids and endocannabinoids in complex matrices
- Monoclonal antibody targeting mu-opioid receptor attenuates morphine tolerance via enhancing morphine-induced receptor endocytosis
- Protective effects of dioscin against Parkinson's disease via regulating bile acid metabolism through remodeling gut microbiome/GLP-1 signaling
- Histone deacetylase inhibitor pracinostat suppresses colorectal cancer by inducing CDK5-Drp1 signaling-mediated peripheral mitofission