
Sequential ultrasound molecular imaging for noninvasive identification and assessment of non-alcoholic steatohepatitis in mouse models☆
2023-12-29 01:21TingtingShYujiYouXioynMioHunDengWeiZhngHuolinYePingWngRongqinZhengJieRenTinghuiYin
Liver Research 2023年4期
Tingting Sh ,Yuji You ,Xioyn Mio ,Hun Deng ,Wei Zhng ,Huolin Ye ,Ping Wng ,Rongqin Zheng ,Jie Ren ,**,Tinghui Yin ,**
a Department of Medical Ultrasound, Laboratory of Novel Optoacoustic (Ultrasonic) Imaging, The Third Affiliated Hospital of Sun Yat-sen University,Guangzhou, Guangdong, China
b Department of Medical Ultrasound, Chengdu Women's and Children's Central Hospital, School of Medicine, University of Electronic Science and Technology of China, Chengdu, Sichuan, China
c Department of Medical Ultrasonics,The Third Affiliated Hospital of Southern Medical University,Academy of Orthopedics,Guangzhou,Guangdong,China
Keywords: Non-alcoholic steatohepatitis (NASH)Ultrasound molecular imaging (USMI)CD36 Intercellular adhesion molecule-1 (ICAM-1)Noninvasive diagnosis
ABSTRACT Background and objective: Noninvasive non-alcoholic steatohepatitis (NASH) assessment is a clinical challenge to the management of non-alcoholic fatty liver disease.We aim to develop diagnostic models based on sequential ultrasound molecular imaging (USMI) for the noninvasive identification of NASH in mouse models.Methods: Animal experiments were approved by the Animal Ethics Committee of South China Agricultural University.Forty-nine C57BL/6 mice were divided into normal control,non-alcoholic fatty liver,NASH,and hepatitis groups.Sequential USMI was implemented using CD36-targeted microbubbles(MBs-CD36) and intercellular adhesion molecule-1 (ICAM-1)-targeted microbubbles (MBs-ICAM-1) to visualize hepatic steatosis and inflammation.The targeting signal of USMI was quantified as the normalized intensity difference (NID) with the destruction-replenishment method.Correlation analysis was conducted between the NID-MBs-CD36 and pathological steatosis score and between the NID-MBs-ICAM-1 and pathological inflammation score.Finally,diagnostic models combining NID-MBs-CD36 with NID-MBs-ICAM-1 were established for NASH diagnosis.Results: MBs-CD36 and MBs-ICAM-1 were successfully prepared and used for sequential USMI in all mice.NID-MBs-CD36 values increased with the progression of steatosis,while NID-MBs-ICAM-1 values increased in parallel with the progression of inflammation.A strong positive correlation was identified between NID-MBs-CD36 and pathological steatosis grade (rs=0.9078, P <0.0001) and between NIDMBs-ICAM-1 and pathological inflammation grade (rs=0.9071, P <0.0001).Among various sequential USMI-based diagnostic models,the serial testing model showed high diagnostic performance in detecting NASH,with 95% sensitivity,97% specificity,95% positive predictive values,97% negative predictive values,and 96% accuracy.Conclusions: Sequential USMI using MBs-CD36 and MBs-ICAM-1 allows noninvasive grading of hepatic steatosis and inflammation.Sequential USMI-based diagnostic models hold great potential in the noninvasive identification of NASH.
1.Introduction
Non-alcoholic fatty liver disease (NAFLD),which was recently renamed metabolic dysfunction-associated fatty liver disease(MAFLD),is a spectrum of diseases that ranges from non-alcoholic fatty liver(NAFL)to non-alcoholic steatohepatitis(NASH).1As NAFL with simple steatosis in the liver is considered to have a benign prognosis,lifestyle changes are generally recommended for NAFL patients.However,NASH,the severe form of NAFLD characterized by both fat accumulation and liver inflammation,is associated with a higher risk of liver damage and may progress to cirrhosis or liver cancer.2Once biopsy-proven NASH is confirmed,pharmacological intervention (i.e.pioglitazone and vitamin E) is recommended to prevent disease progression.3Therefore,timely identifying NASH is the cornerstone of decision-making for recommending clinical interventions.
Invasive liver biopsy remains the gold standard for NASH diagnosis through histopathological assessment of liver steatosis,ballooning,and lobular inflammation.4However,liver biopsy has several limitations including sampling bias,poor patient acceptance,and potential complications.3Clinical imaging techniques,such as ultrasound(US)and magnetic resonance imaging,are used to detect or quantify liver steatosis but are unable to distinguish NASH from NAFLD.5,6Thus,it would be of great value to noninvasively identify NASH-related parameters that can serve as surrogate markers of these histologic features.
Ultrasound molecular imaging(USMI)is an emerging technique that uses microbubbles(MBs)as contrast agents to target molecular markers,enabling the visualization of specific biological processes or pathological changes.7-9Previous studies have shown that USMI is an effective diagnostic tool for a wide range of diseases.10-12However,this technique is constrained to assess only one biological process or pathological change at a time,which limits its applications for diseases with multiple pathophysiological processes or molecular changes.
Sequential imaging,typically utilized in fluorescence imaging,can obtain multiparametric information about various physiological changes in the same biological imaging modality.13,14Building on this concept,we propose an imaging technique called“sequential USMI”,which utilizes sequentially acquired US imaging to assess different physiological or pathological processes by utilizing targeted MBs.Sequential USMI may serve as a noninvasive diagnostic tool by enabling comprehensive evaluation of multiple pathological changes of NASH.
In this study,we targeted the fatty acid translocase CD36 and intercellular adhesion molecule-1 (ICAM-1) for sequential USMI.CD36 is closely associated with liver steatosis,while ICAM-1 levels increase with the progression of liver inflammation.Our proposed approach utilizes these MBs to quantitatively visualize hepatic CD36 and ICAM-1 to reveal the degree of hepatic steatosis and inflammation.The ultimate goal is to establish a feasible noninvasive strategy for NASH detection.
2.Methods and materials
2.1. Preparation and characterization of targeted MBs
CD36-targeted MBs (MBs-CD36),ICAM-1-targeted MBs (MBs-ICAM-1),and control MBs (MBs-con) were prepared based on a multistep biotin-streptavidin bridging chemistry method modified from our previous study.11Briefly,biotin-streptavidin liposomes were first prepared by using a filming-rehydration method and then oscillated with perfluoropropane gas to form MBs.Next,biotinylated antibodies were incubated with the MBs to obtain targeted MBs.More details are given in the supplemental materials and methods.The size and zeta potentials of MBs were measured using dynamic light scattering (DLS).Moreover,the linkage of the CD36/ICAM-1 antibody to the surface of the MBs was confirmed using fluorescence microscopy (Nikon,Japan).The specific targeting ability of MBs-CD36,MBs-ICAM-1,and MBs-con was tested using RAW264.7 cells,human umbilical vein endothelial cells(HUVECs),and PC3 cells,respectively,by observing their adhesion on the cell surface.Meanwhile,the CD36 and ICAM-1 expression levels of these three cells were detected by flow cytometry.Thein vitrostability and imaging efficiency of the MBs were evaluated using contrast-enhanced ultrasound (CEUS).Thein vitrobiosafety of MBs was assessed using cell viability assays.Thein vivobiosafety was evaluated through laboratory tests and histopathology after injecting the MBs into mice.See supplemental materials and methods for detailed procedures.
2.2. Ethics approval and animal models
2.2.1.Ethics approval
The use of animals adhered to animal welfare standards and was based on ethological knowledge and respect for species-specific requirements for health and well-being.Due to limited animal experimental facilities in our institution,the research team conducted careful investigations and decided to carry out the animal experiments at South China Agricultural University,which possesses the qualifications for animal breeding.Therefore,the protocol for animal experiments was ethically reviewed and approved by the Animal Ethics Committee of South China Agricultural University(No.2020d080).
2.2.2.Animal models
Forty-nine male C57BL/6 mice,8-10 weeks,were obtained from the Guangdong Medical Laboratory Animal Center.The animal study flowchart is shown in Fig.1A.In addition to the normal control and NASH groups,NAFL (steatosis as the predominant pathologic change) and hepatitis (inflammation as the predominant pathologic change) groups were also included for diagnostic tests of sensitivity and specificity.Six mice fed a normal diet served as the control group.NASH models were induced by feeding mice a methionine and choline-deficient (MCD) diet (Research diets,United States(U.S.))for 4 to 8 weeks(n=20).For the NAFL models,mice were fed an MCD diet for 2 weeks (n=13) or a high-fat diet(Research diets,U.S.)for 5 months(n=4).Hepatitis was induced by an intraperitoneal injection of 300 mg/kg acetaminophen(Solarbio,Beijing,China) for 12 h (n=6).15

Fig.1.Animal study flowchart and schematic illustration of sequential USMI.(A) Control mice were fed a normal diet (n=6).NAFL mice were fed an MCD diet for 2 weeks(n=13) or a high-fat diet for 5 months (n=4).NASH mice were fed an MCD diet for 4 to 8 weeks (n=20),and hepatitis mice were induced by an intraperitoneal injection of 300 mg/kg acetaminophen for 12 h(n=6).They were used to conduct sequential USMI with MBs-CD36 and MBs-ICAM-1 to evaluate hepatic steatosis and inflammation.Then the USMI parameters were used to establish NASH diagnostic models.(B)Sequential USMI can be divided into three stages.In the first stage,the mouse was injected with MBs-CD36 via the tail vein and subjected to USMI by the destruction-replenishment method.The second stage was the clearance of MBs-CD36 in 30 min,which was sufficient to eliminate MBs-CD36.USMI with MBs-ICAM-1 was executed in the third stage via the same imaging parameters.Abbreviations: USMI,ultrasound molecular imaging;NAFL,non-alcoholic fatty liver;MCD,methionine and choline-deficient;NASH,non-alcoholic steatohepatitis;MBs-CD36,CD36-targeted MBs;MBs-ICAM-1,ICAM-1-targeted MBs;ICAM-1,intercellular adhesion molecule-1.
2.3. Sequential USMI protocol
The sequential USMI procedure consisted of two distinct steps,as illustrated in Fig.1B.In the first step,MBs-CD36 was administered intravenously through the tail vein,followed by CD36-targeted USMI using the destruction-replenishment technique(further details are described below).Subsequently,a 30-min intermittent period was set to allow for the complete elimination of MBs-CD36 from the system.The second step was USMI with MBs-ICAM-1,utilizing identical procedures as the initial step.See supplemental materials and methods for detailed USMI procedures.
2.4. Histological examination and biochemical assays
At the end of the USMI procedure,mice were humanely euthanized under anesthesia by exsanguination.Body and liver weights were recorded,and serum samples were collected and analyzed for levels of alanine aminotransferase (ALT),aspartate aminotransferase (AST),albumin,total bilirubin,cholesterol,and triglycerides.Liver sections were stained with hematoxylin and eosin(H&E)using standard techniques.An experienced pathologist blinded to the US data performed histopathological evaluations.The NAFLD activity score (NAS) system was used to assess liver steatosis,ballooning,and lobular inflammation.16Additionally,the CD36 and ICAM-1 expression was analyzed by immunofluorescence staining.See supplemental materials and methods for detailed procedures.
2.5. Statistical analysis
Statistical analyses were performed using IBM SPSS software(version 25.0,IBM Inc,USA).All data are expressed as the mean ± standard deviation.Statistical differences were set at aPvalue <0.05.One-way ANOVA followed by the Least-Significant-Difference test (LSD) or Kruskal-Wallis test followed by Dunn's test was used to determine differences among three or more groups.Pearson’s correlation coefficient and Spearman's correlation coefficient were used to evaluate the association betweenin vivonormalized intensity difference (NID) andex vivohistopathologic score.The diagnostic performance of the USMI-based diagnostic models was estimated by the receiver operating characteristic (ROC) curve.Cut-off values were determined by maximizing Youden's index.When combining CD36-targeted USMI with ICAM-1-targeted USMI to diagnose NASH,binary logistic regression,the sum of NID-MBs-CD36 and NID-MBs-ICAM-1(represented as NID-SUM),parallel testing,and serial testing were used to establish different diagnostic models.The accuracy,sensitivity,specificity,positive predictive value (PPV),and negative predictive value (NPV) of these models were computed.To calculate the combined sensitivity and specificity of serial testing(test A and test B),combined sensitivity=Sensitivity of A × Sensitivity of B,combined specificity=Specificity of A+(1-Specificity of A) × Specificity of B.To calculate the combined sensitivity and specificity of parallel testing (test A or test B),combined sensitivity=Sensitivity of A+(1-Sensitivity of A)×Sensitivity of B,combined specificity=Specificity of A × Specificity of B.
3.Results
3.1. Characterizations of MBs
The successful preparation of MBs was confirmed by fluorescence microscopy.The red fluorescence of DiI-labeled MBs and green fluorescence of Alexa Fluor 488-labeled antibody almost completely overlapped (Fig.2A),demonstrating the successful conjugation of the CD36/ICAM-1 antibody to MBs.MBs-con,MBs-CD36,and MBs-ICAM-1 showed similar mean diameters(1.08 ± 0.04 μm,1.10 ± 0.03 μm,and 1.09 ± 0.01 μm,respectively,P=0.58)and similar zeta potentials(-21.30 ± 1.15 mV,-22.60 ± 2.87 mV,and -22.60 ± 2.83 mV,respectively,P=0.69) (Supplemental Fig.1),indicating that the conjugation of antibodies had no significant influence on the size and zeta potential of MBs.Many adherent MBs-CD36 on RAW264.7 cells and MBs-ICAM-1 on HUVECs were observed(Fig.2B),which was consistent with the flow cytometry analysis that demonstrated the higher CD36 expression level in RAW 264.7 cells and a higher ICAM-1 expression level in HUVECs(Fig.2C).These results suggested the targeting specificity of MBs-CD36 and MBs-ICAM-1 at the cellular level.In addition,MBs-CD36,MBs-ICAM-1,and MBs-con showed stable and contrast ability forin vitroUS imaging(Supplemental Fig.2).Moreover,bothin vitroandin vivoassays showed that the MBs had high biocompatibility (Supplemental Fig.3).Details are described in the supplemental materials and methods.
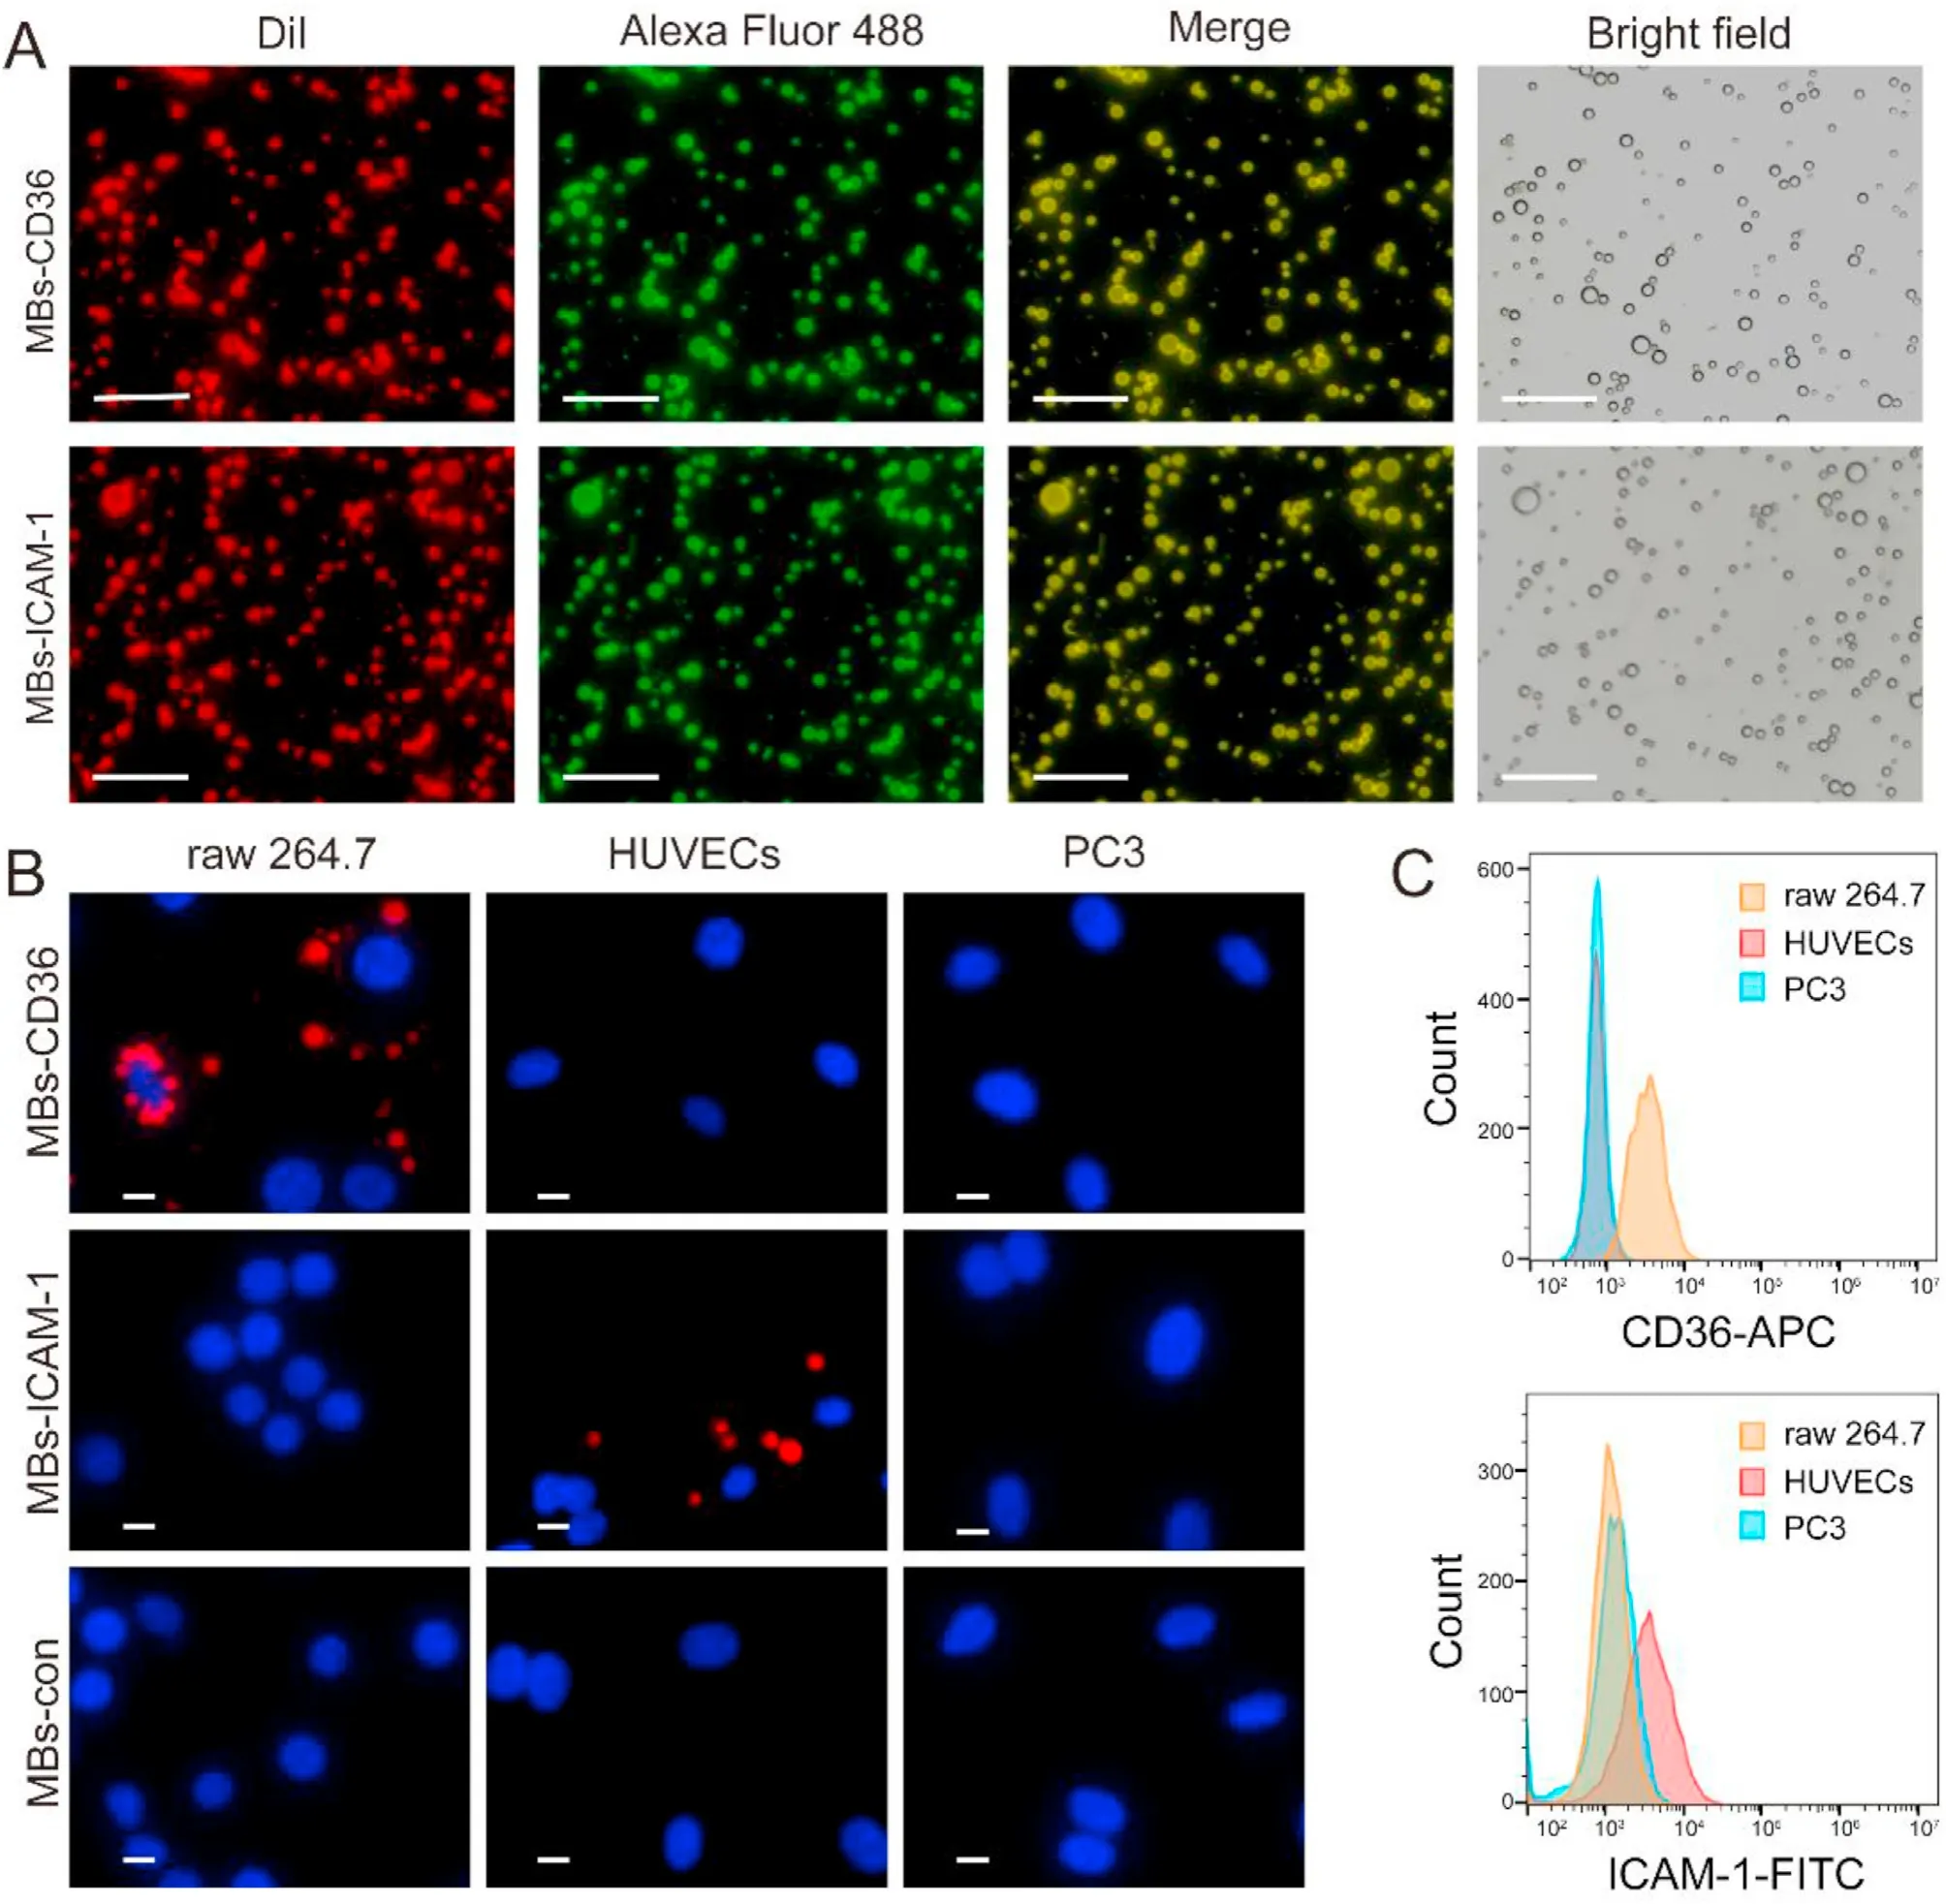
Fig.2.Characterizations of targeted microbubbles.(A)Fluorescence microscopy images confirmed the conjugation of CD36/ICAM-1 antibodies on MBs-CD36/MBs-ICAM-1.MBs were labeled with DiI (red),while the CD36/ICAM-1 antibodies were conjugated to Alexa Fluor 488 (green),Scale bar=20 μm. (B) In vitro specific targeting ability tests.RAW 264.7 cells,HUVECs,and PC3 cells were incubated with MBs-CD36,MBs-ICAM-1,and MBs-con,respectively,Scale bar=10 μm. (C) CD36 and ICAM-1 expression levels of RAW 264.7 cells,HUVECs,and PC3 cells were determined by flow cytometry.Abbreviations: MBs-CD36,CD36-targeted MBs;MBs-ICAM-1,ICAM-1-targeted MBs;ICAM-1,intercellular adhesion molecule-1;MBs-con,control MBs;HUVECs,human umbilical vein endothelial cells.
3.2. Histopathologic assessment and sequential USMI of multiple mouse models
Details of the weight,serological parameters,and pathological grading of different mouse models are described in Supplemental Table 1 and Supplemental Table 2.Representative images of H&E(Fig.3A),Oil Red O(Fig.3B),immunofluorescence staining(Fig.3C),and sequential USMI (Fig.3D) are presented for the control,NAFL,NASH,and hepatitis groups.Hepatic steatosis was observed in the NAFL and NASH groups.Inflammation was observed in the NASH and hepatitis groups.The NID-MBs-CD36 values for the control,NAFL,NASH,and hepatitis groups were 4.56±1.83%,10.61±2.54%,14.85 ± 3.22%,and 5.63 ± 1.39%,respectively.The NID-MBs-CD36 values were significantly higher in NAFL and NASH mice (Fig.3E).The NID-MBs-ICAM-1 values for the control,NAFL,NASH,and hepatitis groups were 3.90±1.68%,5.36±1.56%,12.16±3.55%,and 14.61 ± 2.91%,respectively.The NID-MBs-ICAM-1 values were significantly higher in NASH and hepatitis mice than in control and NAFL mice (Fig.3F).Increased serum ALT levels were observed in the NASH and hepatitis groups (Fig.3G).
3.3. Diagnostic efficiency of grading steatosis by using CD36-targeted USMI
To investigate the diagnostic efficacy of grading steatosis using CD36-targeted USMI,all mice were divided into four groups(S0-S3)according to their pathological steatosis grades.Figure.4A demonstrates that the USMI signal of MBs-CD36 was significantly stronger than that of MBs-con in fatty liver.Furthermore,the oneway ANOVA test revealed no significant differences in NID-MBscon across the four groups (P>0.05).Conversely,NID-MBs-CD36 values increased progressively from S0 (no steatosis) to S3 (severe steatosis) (Fig.4B).Further correlation analysis showed a strong correlation between NID-MBs-CD36 and steatosis grade(rs=0.9078,P<0.001,Fig.4C) and between NID-MBs-CD36 and relative CD36 expression (R2=0.8018,P<0.001,Fig.4D).
To differentiate between different steatosis stages,ROC curves were plotted to determine S ≥1,S ≥2,or S=3,and cut-off values were calculated by maximizing Youden's index.To determine S ≥1,a cut-off value of 7.89%was obtained,with an AUC of 1.00(95%CI:0.99,1.00),a sensitivity of 97%,and a specificity of 100%.To determine S ≥2,a cut-off value of 10.93%was obtained,with an AUC of 0.97(95%CI:0.93,1.00),a sensitivity of 89%,and a specificity of 100%.To determine S=3,a cut-off value of 12.46%was obtained,with an AUC of 0.94(95%CI:0.88,1.00),a sensitivity of 91%,and a specificity of 84% (Fig.4E).The diagnostic performance was highest when determining S ≥1.This indicates that CD36-targeted USMI could compensate for traditional B-mode US imaging,which was considered insensitive to the detection of mild steatosis.
3.4. Diagnostic efficiency of grading inflammation using ICAM-1-targeted USMI
To investigate the diagnostic efficacy of grading inflammation using ICAM-1-targeted USMI,all mice were divided into four groups (A0-A3) according to their pathological inflammation grades.Figure.5A demonstrates that the USMI signal of MBs-ICAM-1 was significantly stronger than that of MBs-con in the inflamed liver.Furthermore,the quantitative analysis revealed no significant differences in NID-MBs-con across the four groups (P>0.05).Conversely,NID-MBs-ICAM-1 values increased progressively from A0 (no inflammation) to A3 (severe inflammation) (Fig.5B).NIDMBs-ICAM-1 strongly correlated with the lobular inflammation score(rs=0.9071,P<0.001,Fig.5C)and relative ICAM-1 expression(R2=0.7198,P<0.001,Fig.5D).
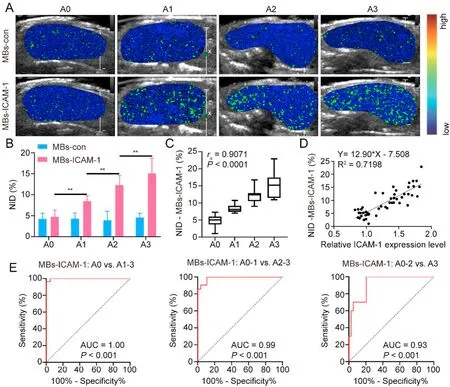
Fig.5.Evaluation of hepatic inflammation in multiple models. Representative color-coded USMI images showed a higher signal in liver lobular inflammation with the administration of MBs-ICAM-1(A).Quantification of USMI revealed that the signal intensity of MBs-ICAM-1 increased with lobular inflammation grade(B).Spearman's correlation analysis demonstrated a good correlation between NID-MBs-ICAM-1 and lobular inflammation scores (C).Linear regression analysis indicated that NID-MBs-ICAM-1 was augmented with increasing relative expression of ICAM-1 (D).ROC analysis of liver lobular inflammation staging by USMI (E).**P <0.01, n=21 in the A0 group, n=7 in the A1 group, n=11 in the A2 group, n=10 in the A3 group.Abbreviations: USMI,ultrasound molecular imaging;NID,normalized intensity difference;MBs,microbubbles;MBs-CD36,CD36-targeted MBs;MBs-ICAM-1,ICAM-1-targeted MBs;ICAM-1,intercellular adhesion molecule-1;MBs-con,control MBs;ROC,receiver operating characteristic;AUC,area under the ROC curve.
ROC curves analyzing the diagnostic performance of ICAM-1-targeted USMI for grading inflammation are shown in Fig.5E.The AUC for identifying inflammation grades greater than or equal to A1(mild) was 1.00 (95% CI:0.99,1.00),with a sensitivity of 96% and a specificity of 100%by using a threshold of 7.35%.The AUC for identifying inflammation grades greater than or equal to A2(moderate)was 0.99(95%CI:0.97,1.00),with a sensitivity of 91%and a specificity of 96%at the threshold of 9.83%.The AUC for identifying inflammation grade equal to A3(severe)was 0.93(95%CI:0.85,1.00),with a sensitivity of 100%and a specificity of 79%at the threshold of 10.82%(Fig.5E).These results demonstrated the good performance of ICAM-1-targeted USMI in grading hepatic inflammation.
3.5. Diagnostic performance of sequential USMI in NASH diagnosis
The aforementioned results provide robust evidence that CD36-targeted USMI serves as an indicator of steatosis,while ICAM-1-targeted USMI serves as an indicator of inflammation.When a single parameter(CD36-targeted USMI or ICAM-1-targeted USMI)was used to diagnose NASH,their diagnostic performance is shown in Fig.6.The AUC of CD36-targeted USMI was 0.93(95%CI:0.81,0.98),and the AUC of ICAM-1-targeted USMI was 0.84(95%CI:0.71,0.93).The optimal cut-off value was 10.93% for NID-MBs-CD36 (with a sensitivity of 95%and a specificity of 86%)and 7.35% for NID-MBs-ICAM-1(with a sensitivity of 100%and a specificity of 76%).

Fig.6.ROC analysis of NASH diagnosis by the imaging parameters. Sequential USMI-based model 1 represents the logistic model combining NID-MBs-CD36 with NID-MBs-ICAM-1;sequential USMI-based model 2 represents the NID-SUM model (NID-SUM=NID-MBs-CD36+NID-MBs-ICAM-1).Abbreviations: ROC,receiver operating characteristic;USMI,ultrasound molecular imaging;NID,normalized intensity difference;MBs,microbubbles;MBs-CD36,CD36-targeted MBs;MBs-ICAM-1,ICAM-1-targeted MBs;ICAM-1,intercellular adhesion molecule-1.
Next,four diagnostic models based on these two parameters(NID-MBs-CD36 and NID-MBs-ICAM-1)were established,and their diagnostic performances were compared to identify a superior NASH diagnostic model.Table 1 displays the diagnostic performances of four models,along with two single parameter-based models.The first model used all NID-MBs-CD36 and NID-MBs-ICAM-1 values to establish a binary logistic regression model,the AUC (0.97) was larger than that of a single CD36-targeted USMI(0.93) and that of single ICAM-1-targeted USMI(0.84) (Fig.6).The second model used the sum of NID-MBs-CD36 and NID-MBs-ICAM-1(represented as NID-SUM)to obtain a new ROC curve and showed unsatisfactory specificity(83%).In the third and fourth models,the cut-off values derived from the CD36-targeted USMI model and ICAM-1-targeted USMI model(10.93%for NID-MBs-CD36 and 7.35%for NID-MBs-ICAM-1) were used for parallel testing (model 3) or serial testing (model 4).Model 3 provided the lowest specificity(69%),PPV (67%),and accuracy (80%).Model 4 demonstrated the highest specificity (97%) and accuracy (96%),along with excellent sensitivity(95%),PPV(95%),and NPV(97%),making it a promising candidate for NASH diagnosis.
4.Discussion
This study successfully visualized liver steatosis and inflammation using USMI based on MBs-CD36 and MBs-ICAM-1.Furthermore,sequential USMI that combined CD36 targeting with ICAM-1 targeting enabled the differential diagnosis of NASH from simple steatosis and other liver inflammatory conditions.
The absence of noninvasive diagnostic methods is a dilemma in the clinical management of NASH.2,4Molecular imaging,which can visualize specific molecular events,represents a largely unexplored landscape with great potential for identifying NASH.A previous study reported that molecular magnetic resonance imaging targeting myeloperoxidase could distinguish NASH from liver steatosis.17In another study,positron emission computed tomography targeting translocator protein was demonstrated to be effective in staging NAFLD.18Among current molecular imaging modalities,USMI offers the advantages of nonionizing radiation,portability,inexpensiveness,and wide accessibility.Moreover,considering the success of previous USMI-related clinical trials,our USMI-based strategy holds great potential for clinical translation.19,20
The selection of appropriate imaging targets is an important prerequisite for USMI.In this study,CD36 and ICAM-1 were chosen as the USMI targets for steatosis and inflammation,respectively,to diagnose NASH.Steatosisis the fundamental pathological change in NAFLD.The fatty acid translocase CD36 is a multifunctional membrane protein expressed at the plasma membrane of multiple liver cells,such as hepatocytes and Kupffer cells,that plays an important role in promoting the uptake and transport of long-chain free fatty acids.21-23Hepatic CD36 expression is normally weak but is enhanced in rodents and humans with fatty livers.24,25Our results also demonstrated that CD36 expression was positively correlated with the grade of steatosis.Thus,CD36 can be considered a potential molecular target for imaging steatosis in NAFLD.In addition to steatosis,inflammationis also a necessary component of the pathological diagnosis of NASH.The progression from simple steatosis to steatohepatitis is characterized by leukocyte adhesion to the sinusoidal endothelium,followed by infiltration into the liver parenchyma to form inflammatory foci.ICAM-1,expressed on the plasma membrane of liver sinusoidal endothelial cells (LSECs),plays a crucial role in leukocyte adhesion.26-28Our study demonstrated a positive correlation between ICAM-1 expression and liver inflammation.Therefore,ICAM-1 on the membrane surface of LSECs can serve as a molecular target for assessing liver inflammation.With the combination of CD36-targeted and ICAM-1-targeted USMI,both steatosis and inflammation can be visualized,leading to an effective diagnosis of NASH.
Notably,we utilized sequential USMI,which involved the use of two separate MBs targeted to CD36 and ICAM-1 instead of a dualtargeted MB that integrated both targets.MBs-CD36 were used to image steatosis,while MBs-ICAM-1 were used to image liver inflammation.As a result,sequential USMI can differentiate between the origin of the targeted signal (whether from steatosis or inflammation),and help identify the dominant pathological change.This can be particularly useful in the NASH drug development process,particularly for evaluating the effectiveness of drugs and exploring the underlying mechanisms.
This study investigated multiple diagnostic models to diagnose NASH,out of which four were comprehensive models based on two parameters,NID-MBs-CD36 and NID-MBs-ICAM-1.According to the pathological criteria of NASH,which require both hepatic steatosis and inflammation,it is more reasonable to use a combination of two parameters instead of a single parameter to establish a diagnostic model.29Thus,the parallel testing model(Model 3),which requires only one of the two parameters for diagnosis,may not meet the diagnostic criteria for NASH.This inference is supported by the data in Table 1,which shows that Model 3 had the lowest specificity and accuracy.The model based on NID-SUM(Model 2)simply sums the values of two parameters,which raises doubts about its rationality.Notably,this model faces the same issue as the method using a dualtarget MB that integrates both CD36 and ICAM-1 targeting into one MB: when one parameter (NID-MBs-CD36 or NID-MBs-ICAM-1) is very high,a positive result could be obtained even if the other parameter is very low.In other words,severe simple steatosis or severe simple inflammation might also be diagnosed as NASH.Model 1,which uses logistic regression to weigh the two parameters,is theoretically more reasonable than Model 2,exhibits improved diagnostic performance,and can be used as an alternative diagnostic model.The serial testing model(Model 4)was theoretically consistent with the diagnostic rules of NASH,which require both steatosis and inflammation to be satisfied.The experimental data in Table 1 verified that this model had the best specificity and accuracy.Based on these results,we ultimately recommend the serial testing model as a superior diagnostic model for NASH.However,the number of mice in this study was limited,and the clinical application value of these diagnostic models needs to be further validated.
5.Conclusions
Several limitations of this study must be considered.First,while animal models help to produce stable NASH/NAFLD-related histopathologic features,they cannot fully replicate all metabolic features of human NAFLD.30Second,the 30-min interval between the two USMI sessions prolongs the imaging time.A recently reported distinct acoustic pressure-based multiple biomarkers USMI method may be of potential for accelerating imaging procedures.31
In summary,our study establishes a promising sequential USMIbased strategy for identifying NASH by visualizing hepatic steatosis and inflammation through the sequential administration of MBs-CD36 and MBs-ICAM-1.As a noninvasive diagnostic tool,this strategy has the potential to aid in clinical therapeutic decisionmaking and drug development for NASH.
Authors’contributions
Tingting Sha and Yujia You contributed equally to this paper and should be considered co-first authors.Tingting Sha: Experiment research,Data curation,Writing-Original draft preparation.Yujia You: Experiment research,Methodology,Writing-Original draft preparation.Xiaoyan Miao:Animal experiments.Huan Deng:Data collection.Huolin Ye:Software.Wei Zhang:Visualization.Rongqin Zheng: Funding,Experiment design,Writing-Reviewing and Editing.Ping Wang: Funding,Writing-Reviewing and Editing.Jie Ren: Funding,Methodology,Writing-Reviewing and Editing.Tinghui Yin: Funding,Conceptualization,Methodology,Writing-Reviewing and Editing.All authors approved the final version of the manuscript for publication.
Declaration of competing interest
Rongqin Zheng is an editorial board member for Liver Research and was not involved in the editorial review or the decision to publish this article.The authors declare that there is no conflicts of interest.
Acknowledgements
We thank Doctor Jianning Chen for his help in the pathological diagnosis and Lianxiong Yuan,MS,for his help in statistical analysis.We also thank South China Agricultural University for assistance with animal experiments.This work was supported by the Science and Technology Planning Project of Guangzhou,China (No.2023A03J0216);the National Natural Science Foundation of China(No.82272021);the Natural Science Foundation of Guangdong Province,China (No.2021A1515010635) and the Major Talents Programme of the Third Affiliated Hospital of Sun Yat-sen University (No.P02445).
Appendix A.Supplementary data
Supplementary data to this article can be found online at https://doi.org/10.1016/j.livres.2023.11.002.
- Liver Research的其它文章
- Dietary pattern and hepatic lipid metabolism☆
- In-depth analysis of de novo lipogenesis in non-alcoholic fatty liver disease: Mechanism and pharmacological interventions☆
- The contributions of bacteria metabolites to the development of hepatic encephalopathy☆
- Autophagy modulates physiologic and adaptive response in the liver☆
- Hepatocellular carcinoma recurrence: Predictors and management☆
- Unveiling the effect of estrogen receptors in alcoholic liver disease:A novel outlook☆